-
Paper Information
- Paper Submission
-
Journal Information
- About This Journal
- Editorial Board
- Current Issue
- Archive
- Author Guidelines
- Contact Us
Advances in Analytical Chemistry
p-ISSN: 2163-2839 e-ISSN: 2163-2847
2024; 13(1): 1-6
doi:10.5923/j.aac.20241301.01
Received: Feb. 26, 2024; Accepted: Mar. 18, 2024; Published: Mar. 22, 2024

A Mesh-Wire Cuvette for Aqueous Sample Analysis in UV-Vis and Far UV Spectroscopy
 Abstract
 Reference
 Full-Text PDF
 Full-text HTML
Tarek R. Farhat, Hasan El Rifai, Rana Jisr, Faith Tharp, Katie Pennington
Physical Sciences, West Virginia University Institute of Technology, Beckley, WV, USA
Correspondence to: Tarek R. Farhat, Physical Sciences, West Virginia University Institute of Technology, Beckley, WV, USA.
| Email: |  |
Copyright © 2024 The Author(s). Published by Scientific & Academic Publishing.
This work is licensed under the Creative Commons Attribution International License (CC BY).
http://creativecommons.org/licenses/by/4.0/

The design and characterization of a new type of cuvette for UV-Vis spectroscopy and Far UV spectroscopy are presented in this paper. The Mesh-Wire Cuvette MWC is a sample cell that accommodates a sample of aqueous nature for instrumental analysis. The MWC is a modified conventional plastic cuvette that is modified with mesh-wire windows for UV-Vis and Far UV radiation transmission. The mesh-wire window eliminates the walls that come between the aqueous sample and probing radiation. The walls of conventional cuvettes are made of plastic, glass, quartz, or other ceramics transparent to UV-Vis and Far UV radiation. Removing the said walls and replacing them with air would allow the passage of all incident wavelengths and maximize the ratio of the transmission of radiation intensity. The Mesh-Wire Cuvette provides users in various areas of science greater access to wavelength regions (e.g. Far UV to X-ray) that are not practical to apply with existing technology.
Keywords: Far UV Spectroscopy, Cuvette, Far UV-Vis, Sample cell, UV-Vis spectroscopy, Quartz cuvette
Cite this paper: Tarek R. Farhat, Hasan El Rifai, Rana Jisr, Faith Tharp, Katie Pennington, A Mesh-Wire Cuvette for Aqueous Sample Analysis in UV-Vis and Far UV Spectroscopy, Advances in Analytical Chemistry, Vol. 13 No. 1, 2024, pp. 1-6. doi: 10.5923/j.aac.20241301.01.
Article Outline
1. Introduction
- Cuvettes or optical sample cells are used in UV-Vis and Far UV spectroscopy and come in various geometries and structures [1,2], however, these cuvettes share one common feature. All cuvettes have two-facing optically transparent windows that allow radiation in the UV-Vis and Far UV regions to pass through based on the material used. The transparent windows can be plastic, glass, quartz, or other ceramics transparent to UV-Vis and Far UV radiation. For example, fused silica has a transmission window with a minimum cut-off wavelength of 150 nm followed by Quartz at 190 nm, while glass and plastic are limited to wavelengths longer than 300 nm [1,2,3]. With this wavelength range limitation, most UV-Vis spectrometers are designed to operate between 190 nm to 1200 nm [3,4,5]. Bringing in a sample cell that can operate in the UV-Vis and Far UV regions down to 100 nm can have a remarkable impact in this spectroscopy domain. Readers are referred to a review that addresses advances in the Far UV region and its potential applications in the region of 100 nm to 200 nm [6]. To go around the limitations imposed by conventional cuvettes, researchers who investigate instrument performance have applied attenuated internal reflection ATR spectroscopy in the Far UV region to probe samples in the 150 to 200 nm region [6]. Near 190 nm region, conventional UV-Vis can probe common ions such as Cl-(aq), NO3-(aq), NH3(aq),…etc at a low detection level of 100 to 10 ppm [7,8].Some optical materials or ceramics are designed for vacuum UV (VUV) instruments that can be transmissive down to ~160 nm. However, in general, these optical materials are moist sensitive and mostly have applications as optical windows and not cuvettes [1,2,3]. Optical materials that are used by cuvettes suffer from reflection and scattering losses. Although ceramic transmissive windows in the UV-Vis region can be as high as 90% transmission, reflection and scattering losses by the optical material can decrease transmission to less than 90% [4,5]. This paper introduces the Mesh-Wire Cuvette MWC that is restricted to applications in aqueous media but with capabilities to operate at any wavelength range by removing wavelength optical losses adhered to transmissive optical materials. Thus, the MWC is a sample cell that accommodates a sample of aqueous nature for instrumental quantitative and qualitative analysis. The design of this new type of cuvette is dedicated to UV-Vis spectroscopy and Far UV spectroscopy, however, it can have applications in attenuated total internal reflection systems, polarimetry, and fluorescence spectrometry. The proposed MWC cuvette that is studied in this paper, is a conventional plastic cuvette that is modified with mesh-wire windows for UV-Vis and Far UV radiation transmission. The MWC can also be designed using metals or ceramics. The mesh-wire window eliminates the two-facing optically transparent windows that come between the aqueous sample and probing radiation. Removing the said transparent windows and replacing them with air would allow the passage of incident wavelengths and maximize the transmission ratio of radiation intensity. The mesh-wire cuvette MWC allows users in various areas of science greater access to wavelength regions that are difficult to handle with conventional spectrometers. However, to be able to function in the Far UV region, conventional UV-Vis spectrometers must be equipped with sources, detectors, and optical components that operate in wavelength regions of 100 nm to 190 nm. Commercial and research vacuum UV spectrometers possess sources and detectors that operate from 10 nm to 200 nm. For example, Deuterium lamps, Hydrogen lamps, and Hollow Cathode lamps act as suitable Far UV sources [6,9,10,11]. For detection, photodiodes and photomultipliers with specialty coating can serve as good detectors. Diamond films were used as suitable detectors [6]. The key factor is to isolate the humidity-sensitive optical windows from the water molecules that get airborne from the MWC [6,9,10,11]. In this regard, optical windows are coated with nano-thin materials to minimize their degradation by humidity or air impurities [3,6]. In a previous paper [12], we verified that a superhydrophobic mesh wire can hold a 5 cm column of water. In this research, we utilize this capability to design the mesh wire cuvette MWC. We will compare the performance of the (MWC) to the conventional glass cuvette (GC) and the Quartz cuvette (QC) using aqueous solutions of caffeine, hydrochloric acid, and potassium chromate. We aim to verify, whether the proposed design needs further improvement, shows similar performance, or can outperform conventional cuvettes.
2. Experimental Procedure
- Glass cuvettes and Quartz cuvettes were properly cleaned with ethanol and pure water before use. Mesh-Wire Cuvette MWC was cleaned with pure water only. In this experiment, the three cuvettes were tested against three reference backgrounds. These were i) air (i.e. empty cuvette holder), ii) empty cuvette, and iii) cuvette filled with pure water. Samples were pumped in and out of the same cuvette to maintain a proper ratio to the reference background. To verify a proper background for spectral measurements, water-vs-water spectra were recorded that must show negligible impurity or cross-contamination across sample spectra before any experiments were conducted. The Mesh Wire Cuvette MWC design: A plastic cuvette was modified to have two openings that are covered by a 38-mesh wire (1 mm x 0.5 mm holes), Figure 1a. The mesh wire was coated by a polyallylamine hydrochloride/ Polytetrafluorethylene ultrathin film [12,13] to make it acquire a superhydrophobic surface. A scanning electron micrograph, Figure 1b shows the coated and uncoated surface where UV-Vis radiation can pass through the grid. A solution inside the cuvette gets trapped by the coated mesh wire ready to be probed by UV-Vis radiation, Figure 1c. The solution meniscus is in direct contact with air, Figure 1d. The cuvette is designed to fit inside a Thermo Scientific Evolution 220 UV-Vis spectrometer set at wavelength range 1100 nm – 190 nm, 100%T for empty holder or solvent correction, 1 nm resolution). The cuvette performance was tested in the wavelength region 1100 nm – 190 nm using pure water (2.5 to 4 μScm-1), a 200 mg/L Caffeine solution, a 0.0024 M potassium chromate K2CrO4 solution, and a 36 mg/L hydrochloric acid solution.
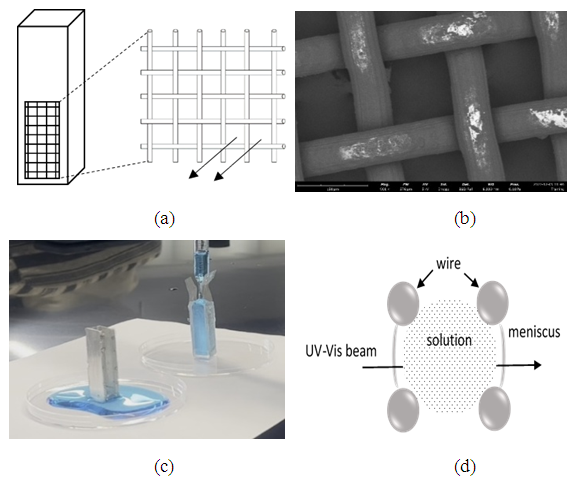 | Figure 1. (a) A mesh wire cuvette MWC with mesh wire window showing the path of the UV-Vis radiation, (b) Scanning Electron Microscopy image showing the coated surface of the mesh#38 wire, (c) a photo showing an uncoated cuvette that leaks the solution and a coated cuvette that retains it, (d) a schematic showing a cross-section of a MWC and a UV-Vis beam |
3. Results and Discussion
- Assessment of results was based on background calibration analysis and aqueous sample analysis. For background calibration, empty cuvettes and water-filled cuvettes were tested. For the aqueous sample analysis, solutions of different natures and dilutions were tested.
3.1. Background Calibration Analysis
- The mesh wire and the cuvette opening of the mesh wire cuvette MWC are expected to block a portion of the incident radiation Io. The transmitted radiation through a cuvette Ic or the Absorbance was examined by conducting experiments on empty cuvettes against air (i.e. an empty cuvette holder), Figure 2. The UV-Vis spectrum of the glass cuvette GC gave a spectrum in Figure 2a with uniform absorbance of 0.05 to 0.1 across a wavelength window of 1000 to 250 nm.The Absorbance starts rising sharply at lower wavelengths because glass blocks UV 190 to 250 nm. The UV-Vis spectrum of the Quartz cuvette QC gave a spectrum in Figure 2b with uniform absorbance of 0.05 to 0.1 across a wavelength window of 1000 to 250 nm that rises slightly at lower wavelengths because Quartz is transmissive to UV in the 190 to 250 nm region. The UV-Vis spectrum of the MWC gave a spectrum in Figure 2c with a uniform absorbance of 0.4 across a wavelength window of 1000 to 190 nm pertaining to the blocking of incident UV-Vis radiation by the homemade MWC. Will a 0.4 absorbance compromise sensitivity performance? this is a question that will be addressed next sections. An empty cuvette was tested against an empty cuvette and the expected spectra is a noise background that fluctuates around a zero absorbance.
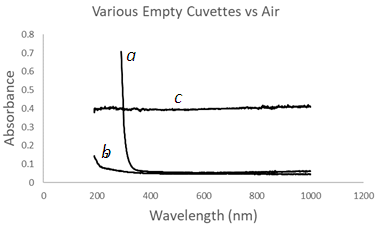 | Figure 2. UV-Vis spectra of various empty cuvettes vs Air. (a) glass cuvette GC, (b) Quartz cuvette QC, (c) Mesh wire cuvette MWC |
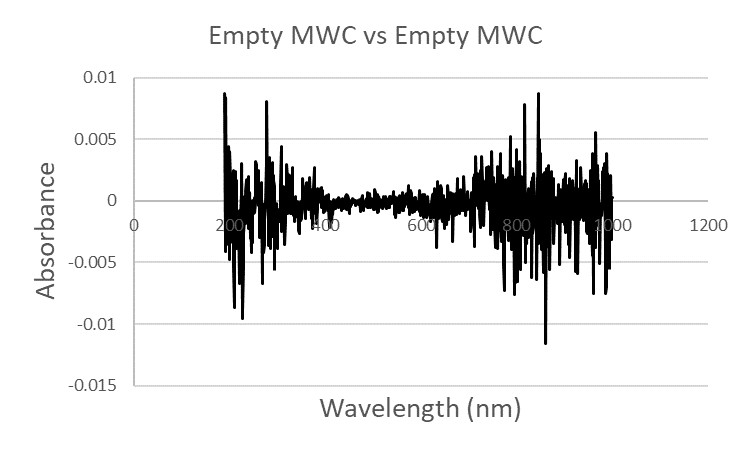 | Figure 3. A UV-Vis spectrum of an empty MWC against an empty MWC |
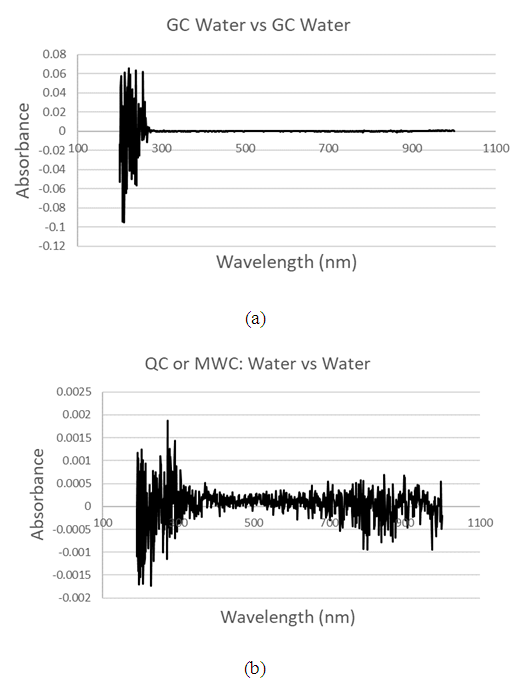 | Figure 4. UV-Vis Background spectra of (a) GC water vs GC water, (b) typical QC water vs QC water, or MWC water vs MWC water to verify zero background and minimum impurity level |
3.2. Aqueous Sample Analysis
- This study is not to conduct any quantitative analysis on a particular chemical but to demonstrate the capability of the proposed mesh wire cuvette MWC by comparing its transmissive performance to conventional cuvettes. The three solutions selected show absorption peaks close to the Far UV between 190 to 250 nm and were used to test the performance of the MWC in comparison to the conventional glass cuvette GC and the Quartz cuvette QC. The first solution is a caffeine solution that exhibits two strong absorption peaks across a band from 320 nm to 200 nm. The second solution is a hydrochloric acid solution that exhibits a decaying band in the Far UV between 190 to 215 nm. The third solution is a chromate solution that exhibits two strong peaks at 377 nm and 273 nm. Using a glass cuvette, Caffeine was tested at three concentration levels 200 ppm, 100 ppm, and 50 ppm, Figure 5 a,b,c. A single spectral peak with a maximum absorbance Amax ~ 2.5 appears at λmax = 284 nm. As expected, there is a cut-off wavelength at 250 nm making a noisy region between 250 to 200 nm. The caffeine solution was diluted to 100 ppm and 50 ppm to produce the peaks in Figure 5 b,c.
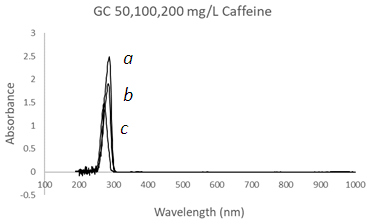 | Figure 5. UV-Vis spectra of Caffeine solutions using a Glass Cuvette (GC) at three different concentrations, (a) 200 mg/L, (b) 100 mg/L, and (c) 50 mg/L with λmax = 284 nm |
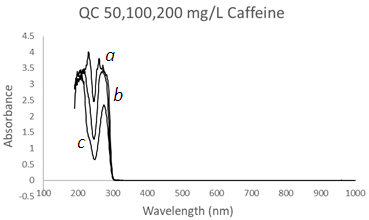 | Figure 6. UV-Vis spectra of Caffeine solutions using a Quartz Cuvette at three different concentrations, (a) 200 mg/L, (b) 100 mg/L, and (c) 50 mg/L at λmax1 = 277 nm and λmax2 = 208 nm |
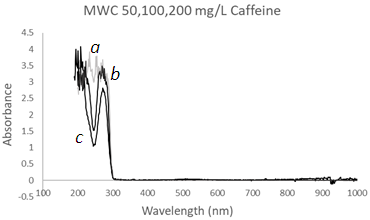 | Figure 7. UV-Vis spectra of Caffeine solutions using a Mesh Wire Cuvette MWC at three different concentrations, (a) 200 mg/L, (b) 100 mg/L, and (c) 50 mg/L at λmax1 = 277 nm and λmax2 = 208 nm |
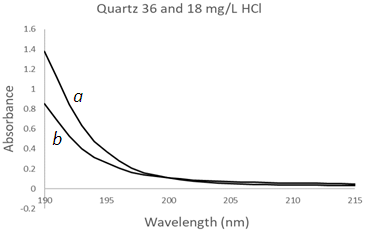
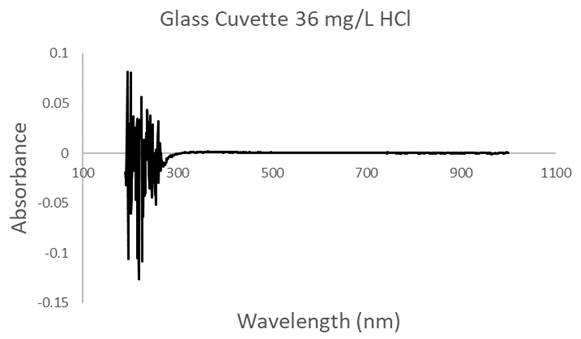 | Figure 8. UV-Vis spectra of hydrochloric acid solutions using a glass Cuvette (GC) at two different concentrations, (a) 36 mg/L, (b) 18 mg/L. The decaying signal characteristic of the HCl solution is completely masked by the cut-off at 250 nm |
 | Figure 9. UV-Vis spectra of hydrochloric acid solutions using a Quartz Cuvette (QC) at two different concentrations, (a) 36 mg/L, (b) 18 mg/L |
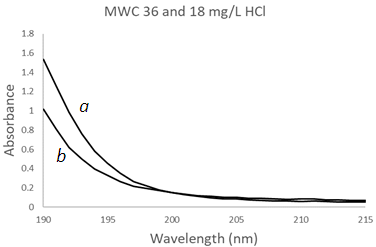 | Figure 10. UV-Vis spectra of hydrochloric acid solutions using a Mesh Wire Cuvette (MWC) at two different concentrations, (a) 36 mg/L, (b) 18 mg/L |
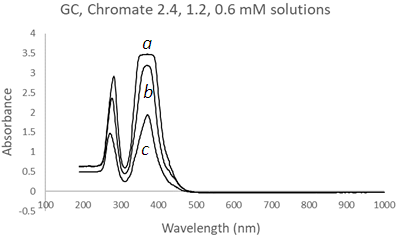 | Figure 11. UV-Vis spectra of Chromate solutions using a Glass Cuvette (GC) at three different concentrations, (a) 2.4 mM, (b) 1.2 mM, and (c) 0.6 mM |
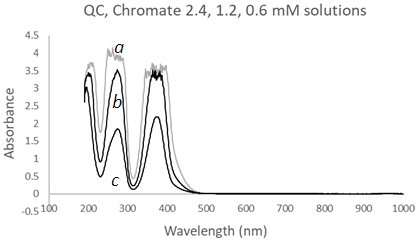 | Figure 12. UV-Vis spectra of Chromate solutions using a Quartz Cuvette (QC) at three different concentrations, (a) 2.4 mM, (b) 1.2 mM, and (c) 0.6 mM |
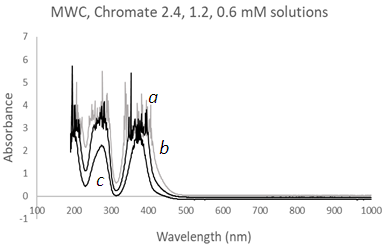 | Figure 13. UV-Vis spectra of Chromate solutions using a Mesh Wire Cuvette (MWC) at three different concentrations, (a) 2.4 mM, grey, (b) 1.2 mM, and (c) 0.6 mM |
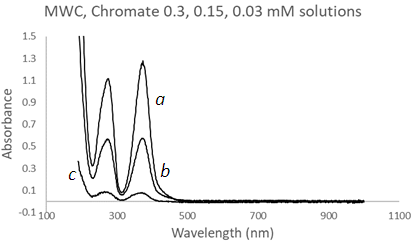 | Figure 14. UV-Vis spectra of Chromate solutions using a Mesh Wire Cuvette (MWC) at three different concentrations, (a) 0.3 mM, grey, (b) 0.15 mM, and (c) 0.03 mM |
4. Conclusions
- In this paper, it was demonstrated that a new type of cuvette called the Mesh Wire Cuvette (MWC) can function as a conventional cuvette in aqueous sample analysis. The MWC has the advantage of being transparent to any wavelength and can function in any spectral region. Using aqueous media, the MWC was shown to perform better than glass cuvettes and even outperform the Quartz cuvettes in sensitivity. The MWC is not going to replace conventional cuvettes, but it can operate in spectral regions where the function of conventional cuvettes is compromised. With the advantage of providing higher sensitivity and wider spectral bandwidth, the MWC can open the door to qualitative and quantitative analysis in spectral regions that are practically difficult to work with using conventional UV-Vis spectroscopy.
ACKNOWLEDGEMENTS
- The authors would like to thank the West Virginia University Institute of Technology and the WV NASA EPSCoR Space Grant Consortium for the support of this research.