-
Paper Information
- Paper Submission
-
Journal Information
- About This Journal
- Editorial Board
- Current Issue
- Archive
- Author Guidelines
- Contact Us
Advances in Analytical Chemistry
p-ISSN: 2163-2839 e-ISSN: 2163-2847
2022; 12(1): 1-16
doi:10.5923/j.aac.20221201.01
Received: Jun. 8, 2022; Accepted: Jun. 27, 2022; Published: Jul. 15, 2022

Assessment and Spatio-seasonal Variation of Physiochemical Parameters and Heavy Metals in the Warri River, Delta State, Nigeria
 Abstract
 Reference
 Full-Text PDF
 Full-text HTML
Isreal O. Akinwole1, 2, Isa Elabor2, 3, Gibson I. Alaiya3
1Department of Chemical Engineering, Ladoke Akintola University of Technology, Ogbomoso, Nigeria
2Jacio Environmental Limited, Effurun, Delta State, Nigeria
3Department of Industrial Chemistry, University of Benin, Benin City, Nigeria
Correspondence to: Isreal O. Akinwole, Department of Chemical Engineering, Ladoke Akintola University of Technology, Ogbomoso, Nigeria.
| Email: |  |
Copyright © 2022 The Author(s). Published by Scientific & Academic Publishing.
This work is licensed under the Creative Commons Attribution International License (CC BY).
http://creativecommons.org/licenses/by/4.0/

This study assessed some physiochemical and heavy metal parameters of Warri River in relation to the Nigeria Standard for Drinking Water Quality/Nigeria Industrial Standard (NSDWQ/NIS 554:2015) and World Health Organization (WHO) guidelines for surface water. The study was done for two seasons (dry and wet season) and at five sampling points (SP), to ascertain how seasonal and location variation affect thirteen (13) physiochemical parameters and seven (7) heavy metals. The sampling and analysis were conducted in accordance with the American Public Health Association (APHA). There was a significant spatial variation (p < 0.05) in average values of pH, EC, TDS, Turb, TSS,  TP, and TN, while there was a significant seasonal variation (p < 0.05) in the average values of pH, WT, O&G, COD, and TP in Warri River. The total average value of EC, TDS,
  and Turb exceeded NSDWQ/NIS and WHO limits for both seasons, especially from SP 3 to SP 5. The concentrations of Pb, Fe, and Ni exceeded the NSDWQ/NIS and WHO limits for both seasons, while Cd was not detected. The results showed that the mean concentrations of metals ranked (high to low) Fe > Zn > Ni > Cu > Pb > Cr during both seasons. There was significant spatial variation (p < 0.05) but no seasonal significant variation for all of the analysed heavy metals in Warri River. As a result, governments and other responsible authorities must monitor industrial effluent discharged into Warri River.
Keywords: Heavy metals, Physiochemical parameters, Warri River, Sampling points
Cite this paper: Isreal O. Akinwole, Isa Elabor, Gibson I. Alaiya, Assessment and Spatio-seasonal Variation of Physiochemical Parameters and Heavy Metals in the Warri River, Delta State, Nigeria, Advances in Analytical Chemistry, Vol. 12 No. 1, 2022, pp. 1-16. doi: 10.5923/j.aac.20221201.01.
Article Outline
1. Introduction
- Water is the most abundant substance on the earth's surface, and all forms of life require it to survive. Hence, this life-saving resource must be treated as a natural treasure [41,81]. Water pollution and deterioration, on the other hand, are on the rise as a result of urbanisation and industrialisation, especially in developing countries that rely on surface and groundwater for direct drinking and irrigation [43]. The rate at which pollutants are discharged into water bodies exceeds the rate at which water bodies self-purify, which is a major source of concern [63]. In this regard, water quality is assessed in terms of both the immediate condition and the long-term duration.Surface water quality is influenced by a number of natural and anthropogenic processes. Natural processes include rock weathering, evapotranspiration, wind-driven depositions, soil leaching, hydrological run-off, and biological processes. Anthropogenic processes include agricultural practices, industrialisation, urbanisation, household sewage, and other man-made activities. This often leads to an imbalance in the ecosystem and generates pollutants that can alter the physicochemical and biological parameters that influence the growth of living organisms in surface water. However, these parameters are seasonal and climatic in nature [75,51,18,59,77].Warri town is located on the banks of the Warri River in southern Nigeria and is an oil hub. The city boasts a modern seaport that acts as a cargo transit point between the Niger River and the Atlantic Ocean, but it is currently inactive [6]. Along the Warri River, there are oil wells, flow stations, and tank farms, all of which are involved in activities like oil exploration, field development, production operations, transportation, storage, and distribution. Heavy metal pollution may also be linked to crude oil exploitation (drilling), transportation, and other industrial processes [58]. These activities have the potential to worsen the river's water quality over time; hence, it's critical to keep an eye on the pollution levels. Pollution owing to an increase in oil spillages through vandalism, pipeline maintenance, aged facilities, accidents, and illegal bunkering have all also become major concerns [60,35]. The degree of pollution is generally assessed by studying the physical, chemical and biological characteristics of the bodies of water, which are prone to change owing to different kinds of pollution, seasonal fluctuation, water extraction, etc. [76,56,73]. Thus, the need to study the physicochemical characteristics of Warri River to determine the quality and its effects on aquatic environment have direct consequences on man and the ecosystem in general.
1.1. Study Area
- Warri River is one of four major coastal rivers in terms of commercial importance in the Niger Delta, Nigeria. It originates from around Utagba Uno and flows through areas of freshwater swamps, mangroves, and ridges of coastal sand [2,4]. It extends between latitudes 5° 21'
 6° 00' N and longitudes 5° 24'
  6° 21' E, covering an area of about 255 sq km with a range of about 150 km. It drains a number of tributaries that join the rivers Forcados and Escravos in the lower Niger Delta via Jones Creek, which then flows into the Atlantic Ocean. With a mean annual rainfall of roughly 3000mm, the area enjoys tropical humidity of the semi-hot equatorial type [25,47,50]. Other activities along the interconnected network of fresh water aquifers include auto mechanic workshops; fishing; timber logging; river ports; crude oil and refined fraction loading and offloading (Figure 1); rubber processing; and sand mining operations. Local traders' markets and jetties are also found along Warri's main river.
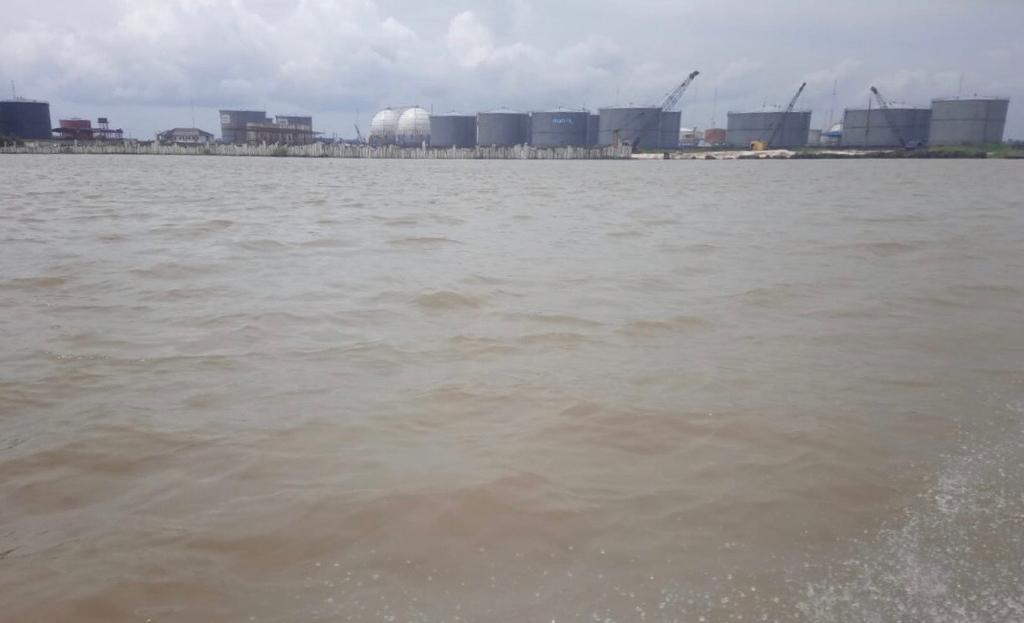 | Figure 1. Tank farm along Warri River |
1.2. Specific Objectives
- 1. Determined the concentration of physiochemical and heavy metals (HM) parameters for dry and wet season2. Compared the spatial and seasonal variation of the sampling points3. Compared all of the Warri River water's measured parameters, with the World Health Organization [83] and the Nigeria Standard for Drinking Water Quality/Nigerian Industrial Standards 554:2015 [45] surface water guideline to determine the degree of contamination or effect of effluent discharged4. The average mean
 standard deviation (SD), and Pearson's correlation (r) value were calculated using SPSS version 25 and MS Excel 2016 to indicate the degree of physicochemical and HM relationship5. Analysis of variance (ANOVA) using SPSS, version 25 was employed to perform a test of significance at p < 0.05, in order to determine the seasonal and spatial variation in the physicochemical parameters and heavy metals concentration
2. Methodology
2.1. Water Sample Collection
- Water samples from five sampling points (SPs) were collected in triplicate into sterile bottles. The sampling strategy was designed to cover 18.67 km between SP 1 and SP 5 (Table 1 and Figure 2). Surface water sampling was carried out on a seasonal basis, namely during dry season (08 December, 2021) and wet season (17 June, 2021) between 0900 hrs and 1200 hrs. A total of 30 water samples were collected from the sampling points (15 samples from each season).
|
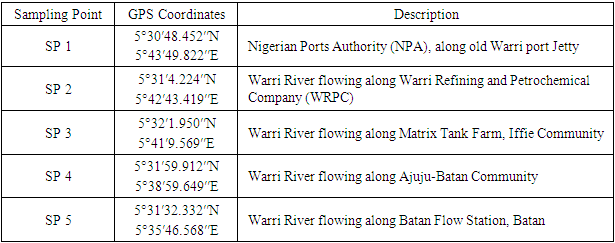
 | Figure 2. Map of study area indicating sampling points along Warri River (developed from ArcGIS Pro) |
2.2. Laboratory Analysis of Water Samples
- In-situ physiochemical parameters: pH, water temperature (WT), dissolved oxygen (DO), electric conductivity (EC) and total dissolved solids (TDS) were measured. pH and WT were determined using a pHep4 Pocket pH & mercury glass thermometer, respectively. However, the pH was later validated in the laboratory using model PHS-25, Searchtech Instruments, England. EC and TDS were measured using TDS, pH, EC, and Temperature 4 in 1 Kit, but the EC was confirmed using DDS-11A, Serchtech Instruments, England. DO was measured using YSI 550A DO meter.The following parameters were determined: turbidity (turb), total soluble solid (TSS), oil and grease (O&G), biological oxygen demand (BOD), chemical oxygen demand (COD), sulphate
 nitrate
  chloride
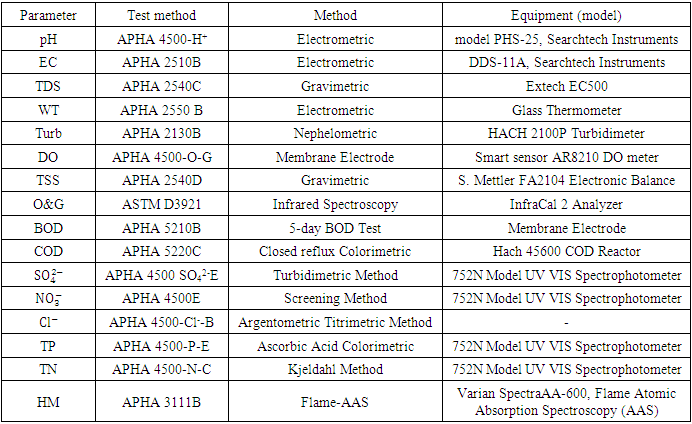
  total phosphorous (TP), total nitrogen (TN). And heavy metals (HM) such as; copper (Cu), lead (Pb), zinc (Zn), iron (Fe), nickel (Ni), cadmium (Cd) and chromium (Cr).These analyses were carried out at Jacio Environmental Limited, Effurun, Delta State, Nigeria. All water sample analyses were conducted according to the approved standard analytical methods by American Public Health Association [13] (Table 2). Each analysis was carried out three times, and the average value was obtained. Laboratory quality assurance and quality control approaches, including the use of standard operating procedures, were used to ensure the analytical data integrity, calibration with standards, analysis of reagent blanks, recovery of known additions, and analysis of replicates.
|
3. Result and Discussion
3.1. Physicochemical Parameters
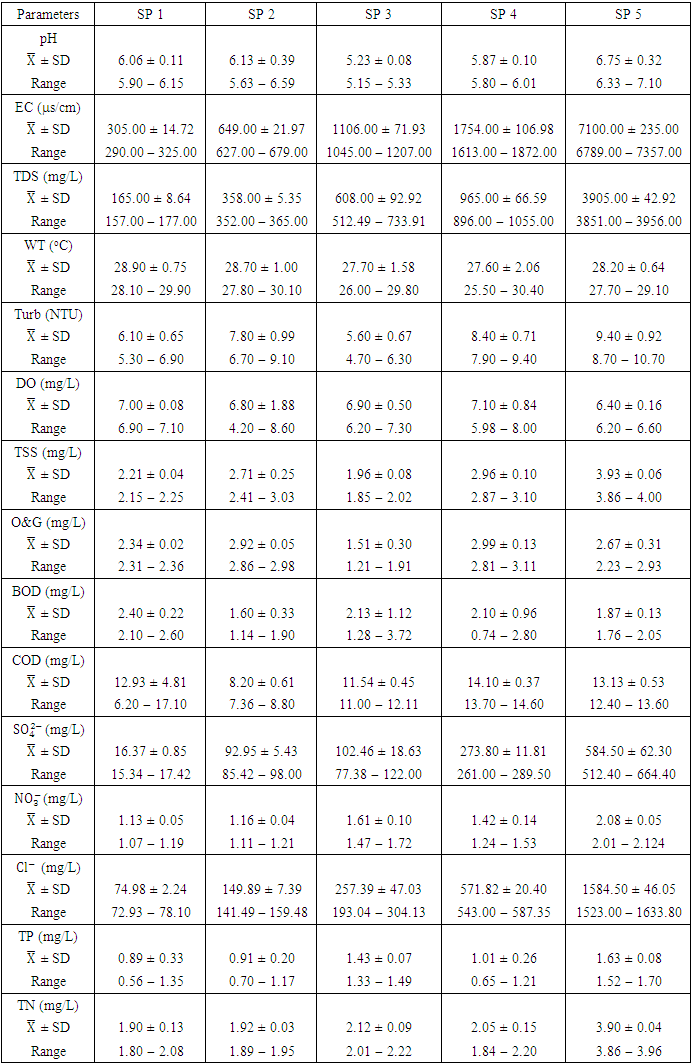
- A pH range of 6.5-9.0 is ideal for most aquatic species. Aquatic organisms are stressed and can reduce reproduction when the pH of water is too high or low. The pH of chemical parameter and heavy metal in water can affect their solubility and toxicity [27,16]. The pH values of water samples from Warri River varied from 5.15 to 7.10 in dry season and between 5.49 and 7.23 in wet season. SP 5 showed higher mean value (7.10 ± 0.10) during wet season while the lowest average pH value (5.23 ± 0.08) was found at SP 3 in dry season (Table 3 and 4). The mean pH across all SP during the dry season (6.01 ± 0.54) and wet season (6.53 ± 0.46) indicated that Warri River is slightly acidic in both seasons (Table 5). This could be as a result of acid rain caused by indiscriminate gas flaring from the Warri Refinery and flow stations in the area, as recorded by Efe and Mogborukor [19]. The dry season mean pH was found to be lower than the WHO and NSDWQ/NIS limit range, while the wet season mean pH was within the limit range. The low pH may be due to dissolved SOx, NOx, COx, and H2S gases overtime through wet deposition (precipitation) or dry deposition (as gases or particles) as a result of acid rain and gravity, respectively. There was a significant spatial and seasonal variation (p < 0.05) in average pH values in Warri River (Table 5). Okoye and Iteyere [48], Aghoghovwia [5], and Kaizer and Osakwe [39] results agree with the slightly acidic pH values of the Warri River.
|
|
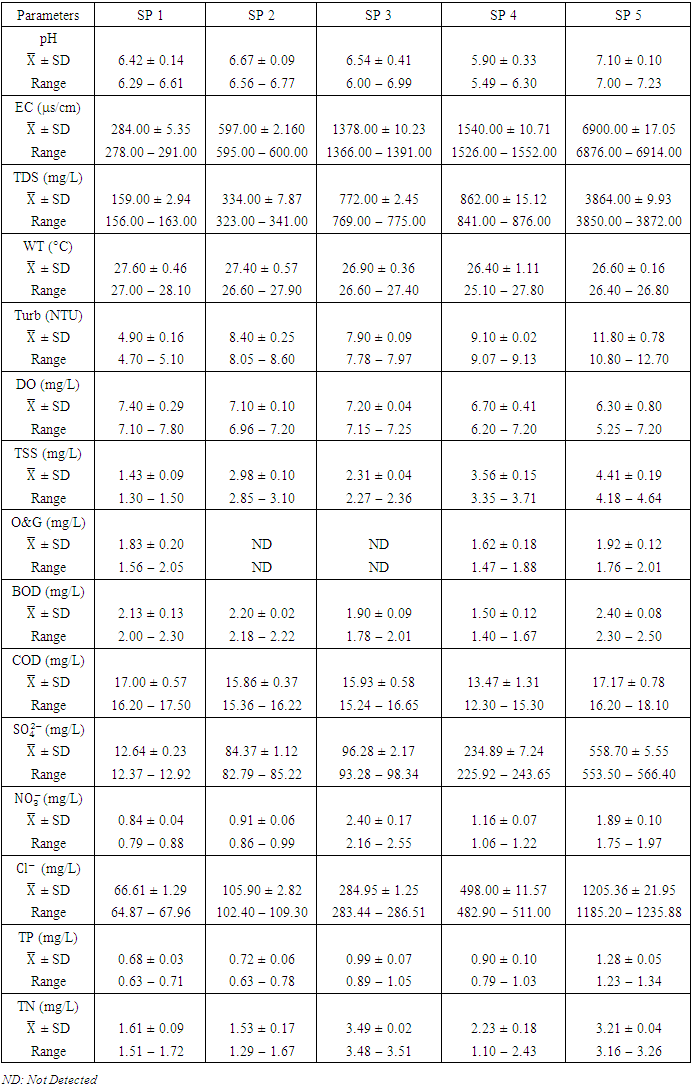
 | Table 5. Standard limit and ANOVA relation of physicochemical parameters at different sampling points and different seasons |
 ), varied from 157.00 to 3956.00
  in dry season and between 156.00 and 3872.00
  in wet season. SP 5 recorded the highest mean values (3905.00 ± 42.92
  ) during dry season, while the lowest average TDS value (159.00 ± 2.94
  ) was found at SP 1 in wet season (Table 3 and 4). During the dry and wet seasons, the overall mean TDS concentration was 1200.20 ± 1379.70
  and 1198.20 ± 1358.55
  , respectively. These values exceeded the WHO and NSDWQ/NIS limits (Table 5). This has reduced the clarity of the water, which has contributed to a decrease in photosynthesis and led to an increase in water temperature. The increase in temperature, in turn, leads to a high dissolution rate of dissolved minerals. High TDS was expected because of the high EC recorded, and also at a significance level of 0.01 the EC and TDS of different source of water were found to be correlated in all types of water [17]. On the contrary, the TDS results reported by Umedum et al. [73] and Aghoghovwia [5] were low. There is a significant variation in mean TDS value among the sampling points (p < 0.05), while there was no significant seasonal difference in mean EC value in the Warri River (Table 5).WT is a governing factor in aquatic habitat dynamics because it interferes with organism metabolism, influences reproduction, speeds up chemical processes, and accelerates organic matter breakdown. It can raise metabolic oxygen demand, affecting numerous species when combine with lower oxygen solubility. The rate of microbial activity is likewise increased when temperature rise [21,49,70]. The WT, measured in degree Celsius (°C), observed varied from 25.5 to 30.4°C in dry season and between 25.1 and 28.1°C in wet season. SP 1 showed the highest mean values (28.90 ± 0.75°C) during the dry season, while the lowest average WT value (26.40 ± 1.11°C) was found at SP 4 in wet season (Table 3 and 4). As expected, WT were highest during dry seasons and lowest during wet seasons. The average total of WT in dry season was 28.22 ± 1.42°C, while during wet season it was 26.98 ± 0.77°C. There were no significant differences (p > 0.05) in WT among the sampling points. Nevertheless, the seasonal trends in the distribution of WT showed significant changes (p < 0.05) (Table 5).Turb is a measurement of water cloudiness which is a result of TSS, dissolved organic matter, microbial growth etc. Turb is one of the most significant characteristics in water analysis because it decreases light penetration and hence hinders photosynthesis of submerged plants and algae. Fish production may suffer as a result [67,28]. The values of Turb, measured in Nephelometric Turbidity Unit (NTU), in samples ranged from 4.70 to 10.70 NTU in dry season and between 4.70 and 12.70 NTU in wet season. SP 5 recorded the highest mean Turb values (11.80 ± 0.16 NTU) and SP 1 recorded the lowest average (4.90 ± 0.16 NTU), both during wet season. The mean Turb in dry and wet season was 7.46 ± 1.63 NTU and 8.42 ± 2.25 NTU respectively (Table 3 and 4), and these were slightly higher than the WHO and NSDWQ limits (Table 5). This could be as a result of the many domestic, anthropological, and industrial wastes from the town and along the river being all channelled into the Warri River. Okoye et al. [48], and Ovonramwen [55] also recorded similar Turb. An increase in dissolved minerals and frequent movement of boats, barges, and vessels at low tide during the dry season could disturb the sediment, clay, and silt particles of the river at the time of sampling and could also lead to an increase in turbidity. An increase in the growth of microorganisms due to decomposing organic matter could contribute to higher turbidity during the dry season [54]. There is a significant variation in mean Turb value among the SP (p < 0.05), while there was no seasonal significant difference in mean Turb value in Warri River (Table 5).DO is a crucial sign of water pollution and a water quality metric. The low dissolved oxygen level in surface water implies microbial pollution or chemical deterioration [22,28]. The DO content of the examined water samples from Warri River varied from 4.20 to 8.60
  in dry season and between 5.25 and 7.80
  in wet season. During the wet season, SP 1 (7.40 ± 0.29
  ) had the highest mean value and SP 5 (6.30 ± 0.80
  ) had the lowest mean value (Table 4). The mean DO for the dry season was 6.84 ± 0.98
  while the for the wet season was 6.94 ± 0.58
  . There was no significant spatial and seasonal variation (p > 0.05) in the average DO values in Warri River (Table 5). The DO concentration recorded implies the river is less polluted by organic matters. These results were similar to a study recorded in Umedum et al. [73], Tesi et al. [71], Okoye et al. [48], and Aghoghovwia [5]. TSS is defined as the amount of fine particulate matter (< 2 microns in size) that remains in suspension in water [15]. TSS concentration in the water sample varied from 1.85 to 4.00
  in dry season and between 1.30 and 4.64
  in wet season. The highest mean value was observed in SP 5 (4.41 ± 0.19
  ) and the lowest mean value was recorded at SP 1 (1.43 ± 0.09
  ) during the wet season (Table 4). There is a significant variation in mean TSS value among the sampling points (p < 0.05), while there was no significant seasonal difference in mean TSS value in Warri River (Table 5). The average TSS for both dry and wet season was 2.75 ± 0.70 and 2.94 ± 1.03
  respectively, which is within the NSDQW limit. This could be due to the river's constant flow into the Atlantic Ocean and the absence of sandmining at sampling points. Umedum et al. [73] also recorded low TSS, while high TSS was recorded by Idomeh et al. [34] and Tesi et al. [71].O&G includes Fats, lubricant and motor oils, waxes, fuels, total petroleum hydrocarbons, and other related elements present in water that form thin films on the water because they do not readily mix with water. This film depletes the oxygen level in the surface water by not allowing the atmospheric oxygen to dissolve in the water, thereby wreaking havoc on aquatic life [20]. The O&G concertation varied from 1.21 to 3.11
  in dry season and between 1.47 and 2.05
  in wet season. SP 4 showed the highest O&G mean concentration (2.99 ± 0.13
  ) and the lowest average O&G concentration (1.51 ± 0.30
  ) was found at SP 3 in dry season (Table 3 and 4). The dry season average O&G concentration was 2.49 ± 0.58
  and 1.79 ± 0.21
  during the wet season. Similar O&G results were recorded by Arimoro et al. [12], while high O&G was recorded by Okoye and Iteyere [48]. There were no significant differences (p > 0.05) in O&G among the sampling points. Nevertheless, the seasonal trends in the distribution of O&G showed significant changes (p < 0.05) (Table 5). BOD is the amount of dissolved oxygen required by bacteria and other microorganisms to decompose and break down organic matters that are aerobically degradable in 1 litre of water. BOD is an indicator of levels of organic pollution and is useful in managing pollution control of streams and assessing their self-purification capacity [24,31,14]. The BOD value varied from 0.74 to 3.72
  in dry season and between 1.40 and 2.50
  in wet season. The highest mean value was observed in SP 1 (2.40 ± 0.22
  ) during dry season, while the lowest mean value was recorded at SP 4 (1.50 ± 0.12
  ) during the wet season (Table 3 and 4). The average BOD concentration during the dry and wet season was 2.02 ± 0.74 and 2.03 ± 0.32
  , respectively. This low BOD concentration means the river has a low content of organic matter and has low counts of microbial organisms [71]. There was a significant spatial and seasonal variation (p < 0.05) in average BOD values in Warri River (Table 5). Tesi et al. [71], Okoye and Iteyere [48], and Idomeh et al. [34] recorded considerably higher BOD.COD is the amount of dissolved oxygen required to oxidise chemical, organic, and inorganic materials in water. It's a method for determining how much organic matter has contaminated water [66]. The range of values obtained for COD in the water samples from Warri River varied from 6.20 to 17.10
  in dry season and between 12.30 and 18.10
  in wet season. SP 5 showed the highest mean concentration (17.17 ± 0.78
  ) during the wet season and the lowest average COD concentration (8.20 ± 0.61
  ) was found at SP 2 in dry season (Table 3 and 4). The mean COD values during the dry season was 11.980 ± 3.01
  and wet season was 15.89 ± 1.54
  for the Warri River. As expected, the BOD was lower than the COD, but the high COD result indicated that the water samples contained more inorganic matters. There were no significant differences (p > 0.05) in COD among the sampling points. Nevertheless, the seasonal trends in the distribution of COD showed significant changes (p < 0.05) (Table 5). Similar COD values were recorded by Tesi et al. [71], Okoye and Iteyere [48].
 can be present in practically all natural water bodies, either naturally (leached from sulphate-bearing soils and rocks) or as a result of municipal/industrial emissions [7,53]. The
  concentration of water samples varied from 15.34 to 664.40
  in dry season and between 12.37 to 566.40
  in wet season. The highest mean value was observed in SP 5 (584.50 ± 62.30
  ) during dry season and the lowest mean concentration of
  was recorded at SP 1 (12.64 ± 0.23
  ) during the wet season (Table 3 and 4). The total average concentration in dry (214.02 ± 205.62
  ) and wet (197.38 ± 194.51
  ) seasons fell within the standard limit for WHO but not NSDWQ/NIS (Table 5). However, during both seasons, SP 4 and SP 5 exceeded WHO and NSDWQ/NIS (Table 3, 4 & 5). Firstly, this could be as a result of discharged effluent from sewage treatment plants on boat house and produced water from flow stations. Secondly, the high sulfate value could also be attributed to the intrusion of dissolved solids containing sulfate from highly saline water body. Thirdly, the flared gases may have been washed down from the atmosphere through rainfall (acidic rain) or as a result of gravity. There was a significant variation in mean
  value among the sampling points (p < 0.05), while there was no seasonal significant difference in mean
  value in Warri River (Table 5). There is no record of excess sulfate in any article on Warri River to corroborate the findings of this study.
 is a stronger indicator of the potential of a sewage, manure, or industrial discharge source since they impact aquatic plant and animal development, dissolved oxygen, temperature, and other indicators [82,3]. The
  concentration from the water samples varied from 1.07 to 2.12
  in dry season and between 0.79 and 2.55
  in wet season. The highest mean value was observed in SP 3 (2.40 ± 0.17
  ) and the lowest mean value was recorded at SP 1 (0.84 ± 0.04
  ) during the wet season. In the dry season, the overall mean concentration of
  was 1.48 ± 0.36
  while in wet season, it was 1.44 ± 0.62
  (Table 3 and 4), both of which were below the WHO and NSDWQ/NIS standards (Table 5). This could be as a result of the lack of tanneries, farming, and minimal domestic sewage discharge along the river. Hence, the Warri River is not
  contaminated. There was a significant variation in mean
  value among the sampling points (p < 0.05), while there was no seasonal significant difference in mean
  value in Warri River (Table 3). Umedum et al. [73], Kaizer and Osakwe [39], Okoye and Iteyere [48] all recorded similar low
  concentrations, whilst Tesi et al. [71] and Aghoghovwia [5] recorded high
  concentrations.
 in water bodies can come from a variety of sources, including natural sources (soil), municipal or industrial sewage, and chlorine-treated sewage effluents, and it is frequently used as a chemical pollution indicator for sewage contamination [80,42,78]. The
  concentration varied from 72.93 to 1633.80
  in dry season and between 64.87 and 1235.88
  in wet season. The highest mean value was observed in SP 5 (1584.50 ± 46.05
  ) during the dry season, while the lowest mean value was recorded at SP 1 (66.61 ± 1.29
  ) during the wet season (Table 3 and 4). The overall average
  for dry and wet seasons was 527.72 ± 555.76
  and 432.16 ± 415.82
  respectively, but they both exceeded the WHO and NSDWQ/NIS limits (Table 5). This could be due to indiscriminate dumping of solid and highly chlorinated sewage wastes from barge houses, tank farms, and flow stations along the river, as well as other anthropogenic activities. Produced water contains salts which are primarily chlorides and sulfides of calcium, magnesium, and sodium. Therefore, treated produced water that is discharged into the river may contain high levels of chlorides [44,36]. Also, the high chloride value could also be attributed to the intrusion of dissolved solids containing chloride from a highly saline water body. There is a significant variation in mean
  value among the sampling points (p < 0.05), while there was no seasonal significant difference in mean
  value in Warri River (Table 5). SP 1 and SP 2 recorded similar
  concentration by Umedum et al. [73] and Tesi et al. [71], while very high concentration recorded in SP 3 – SP 5 was not recorded by any article on Warri River.The sum of orthophosphate, polyphosphate, and organic forms of phosphorus is referred to as total phosphorus (TP). In unpolluted bodies of water, total phosphorus is an essential element for plants and algae growth, but when there is too much of it in the water, it can hasten eutrophication (accelerated plant growth, algal blooms, low dissolved oxygen) [26,1,61]. The concentration of TP varied from 0.56 to 1.70
  in dry season and between 0.63 and 1.34
  in wet season. SP 5 showed higher mean values (1.63 ± 0.08
  ) during dry season while the lowest average TP value (0.68 ± 0.03
  ) was found at SP 1 in wet season (Table 3 and 4). The mean TP values during the dry season was 1.17 ± 0.37
  and 0.92 ± 0.23
  during wet season. Low TP could be further confirmed by the absence of aquatic vegetation on the Warri River, with the exception of a few plants that were flushed into the river from stagnant water following heavy rain during wet seasons. There was a significant spatial and seasonal variation (p < 0.05) in average TP values in Warri River (Table 5).Nitrate
  nitrite
  , organic nitrogen, and ammonia are all parts of total nitrogen (TN). Total nitrogen is a key contributor to eutrophication of water bodies, which in high concentration disturbs ecology and results in harmful algal blooms, oxygen depletion, and biodiversity loss, among other issues [85]. The concentration of TN varied from 1.80 to 3.96
  in dry season and between 1.29 and 3.51
  in wet season. SP 5 showed the highest mean values (3.90 ± 0.04
  ) during dry season, while the lowest average TN value (1.53 ± 0.17
  ) was found at SP 2 in wet season (Table 3 and 4). During the dry season, the mean TN was 2.38 ± 0.77
  , and 2.41 ± 0.82
  during the wet season. This concentration may have been caused by sewage effluents from small villages, but there was no runoff from land where manure or chemical fertilizer had been applied or stored. There is a significant variation in mean TN value among the sampling points (p < 0.05), while there was no seasonal significant difference in mean TN value in Warri River (Table 5).The correlation matrix for the estimated physiochemical parameters in Warri River during the dry and wet season are shown in tables 6 and 7, respectively. During the dry season, there was a strong and positive correlation between (EC and TDS, r = 0.998), (EC and TSS, r = 0.883), (EC and
  , r = 0.964), (EC and
  , r = 0.991), (EC and TN, r = 0.977), (TDS and TSS, r = 0.881), (TDS and
  , r = 0.959), (TDS and
  , r = 0.990), (TDS and TN, r = 0.979), (Turb and TSS, r = 0.907), (TSS and
  , r = 0.914), (TSS and
  , r = 0.903), (TSS and TN, r = 0.816), (
 and
and  , r = 0.986), (
 and TN, r = 0.892) and (
 and TN, r = 0.945).
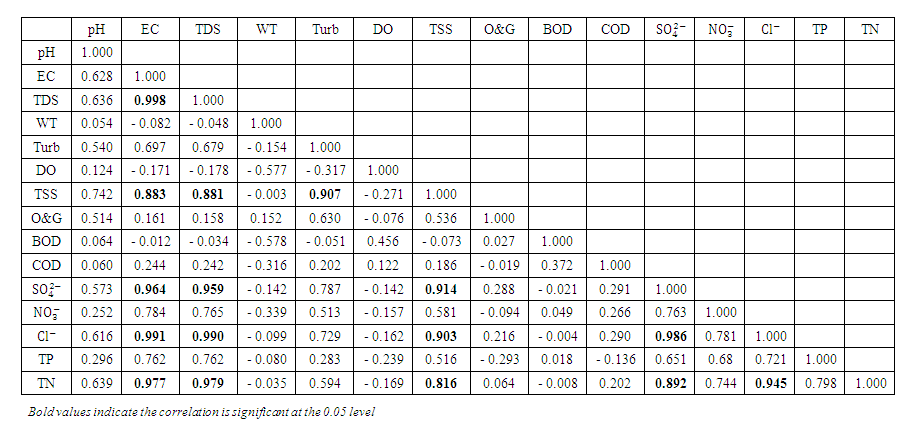 | Table 6. Correlation matrix of the physicochemical parameters during dry season |
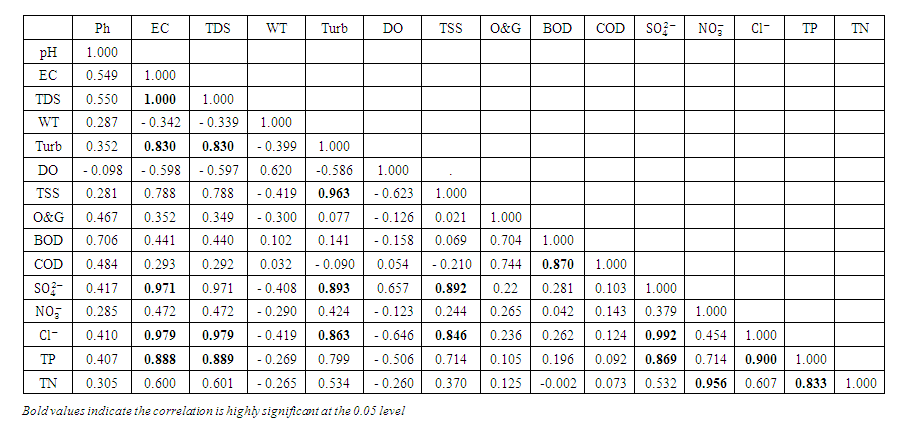 | Table 7. Correlation matrix of the physicochemical parameters during wet season |
 , r = 0.971), (EC and
  , r = 0.979), (EC and TP, r = 0.888), (TDS and Turb, r = 0.830), (TDS and
  , r = 0.971), (TDS and
  , r = 0.979), (TDS and TP, r = 0.889, (Turb and TSS, r = 0.963), (Turb. and
  , r = 0.893), (Turb. and
  , r = 0.863), (TSS and
  , r = 0.892), (TSS and
  , r = 0.846), (BOD and COD, 0.870), (
 and
and  , r = 0.992), (
 and TP, r = 0.869), (
 and TN, r = 0.956), (
 and TP, r = 0.900) and (TP and TN, r = 0.833).
3.2. Heavy Metal
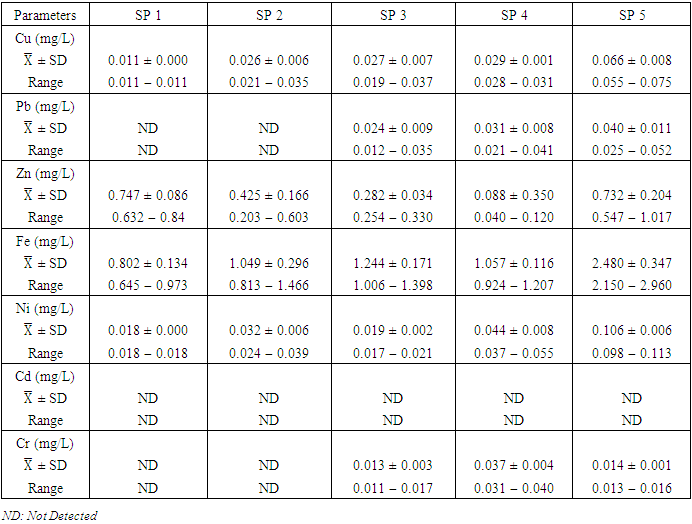
- Cu is a critical micronutrient for a variety of metabolic activities in both prokaryotic and eukaryotic organisms. Despite the fact that copper is a necessary component of human metabolism, overly high dosages cause significant mucosal irritation and corrosion, as well as widespread capillary damage, hepatic and renal damage, and central nervous system irritation, which leads to melancholy [42,62,65]. The concentration of Cu in the water under study ranged from a minimum of 0.011
 (SP 1) to a maximum of 0.075
  (SP 5), both during the dry season across the sampling points (Table 8 and 9). The mean concentration of Cu during dry season was 0.035 ± 0.019
  with values ranging from 0.011 to 0.075
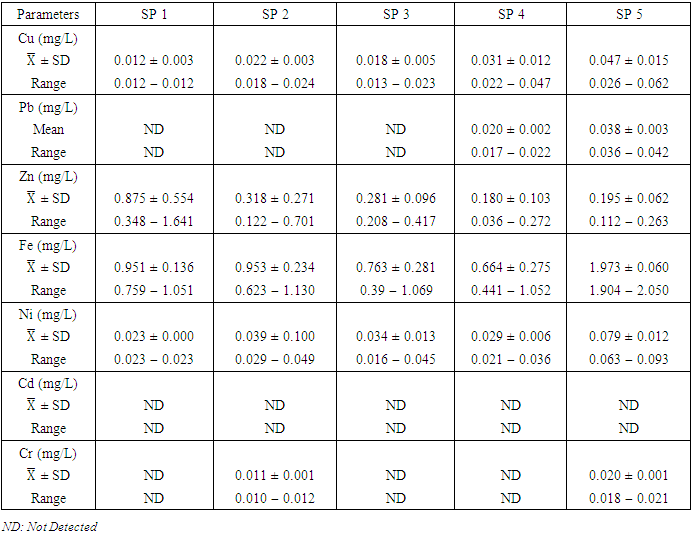
  , while during wet season was 0.029 ± 0.016
  with values ranging from 0.012 to 0.062
  . Similar results were recorded by Aghoghovwia et al. [6], Okoye and Iteyere [48], Ama et al. [9] and Kaizer and Osakwe [39]. The Cu concentration did not exceed WHO and NSDWQ/NIS limits (Table 10).
|
|
 | Table 10. Standard limit and ANOVA relation of heavy metal at different sampling points and different season |
 in dry season and between 0.017 and 0.042
  in wet season. SP 5 showed the highest mean Pb values (0.040 ± 0.011
  ) during dry season while the lowest concentration (0.020 ± 0.002
  ) was found at SP 4 in wet season. Pb was not detected in SP1 &2 during dry season and SP1, 2 & 3 during wet season (Table 8 and 9). The mean Pb concentration during dry season was 0.032 ± 0.012
  and 0.029 ± 0.010
  during wet season (Table 10). Similar results were observed by Aghoghovwia et al. [6], Ama et al. [9], and Kaizer and Osakwe [39]. Pb concentration exceeded WHO and NSDWQ/NIS limits (Table 10). This might be caused by flaking paint from ships, boat homes, and old buildings washing down the river [8].Zn is an essential trace element that plays a key role in the physiological and metabolic process of many organisms, it is a component of proteins as well as greater number of enzymes [64,57]. Bacteria, plants, and animals, including humans, require this trace element to survive. It's also a metal with a low concentration in surface water due to its limited mobility from rock weathering or natural sources [37]. High concentration of Zn leads phytotoxicity, reproduction problem, and brain disorder [74]. The concentration of Zn during dry season ranged from 0.040 to 1.017
  and the average concentration across the SP was 0.455 ± 0.295
  . The concentration of Zn during wet season ranged from 0.036 to 1.641
  and the average concentration across the SP was 0.370 ± 0.397
  . The highest concentration of Zn was recorded at SP 1 (0.747 ± 0.086
  ) (Table 8) during dry season while the lowest average concentration was measured at SP 4 (0.180 ± 0.103
  ) (Table 9) during wet season. Okoye and Iteyere [48] also recorded close results. Zn concentration did not exceed WHO and NSDWQ/NIS limits (Table 10). Fe is a naturally occurring metal that plays a significant role in the environment since it is linked to a variety of abiotic and biotic processes. Natural deposits, industrial wastes, iron ore refinement, and corrosion of iron-containing metals can all release Fe into the water [68]. Although, Fe is a necessary nutrient for most species, too much of it can harm the liver, pancreas, and heart in humans [16]. The mean concentration of Fe during dry season was 1.326 ± 0.660
  , with values ranging from 0.645 to 2.960
  while during the wet season was 1.061 ± 0.535
  , with values ranging from 0.390 - 2.050
  . The highest mean concentration across SP was recorded at SP 5 (2.480 ± 0.347
  ) during the dry season, ranging from 2.150 − 2.960
  , while the lowest mean concentration across SP was recorded at SP 4 (0.664 ± 0.275
  ) during wet season, ranging from 0.441 − 1.052
  (Table 8 and 9). Fe concentration exceeded WHO and NSDWQ/NIS limits (Table 10). Apart from natural deposits of Fe in the river, iron and Steel industry at Aladja discharged effluents into the river, numerous iron alloy machineries and equipment are on, moving, and buried in this river, abandoned jetty, barges, and unpainted vessels parked by the water side are continually subjected to electrochemical reaction (corrosion), which results in rust flaking off iron metal into the river. Similar results were recorded by Tesi et al. [71] and Aghoghovwia et al. [6], low concentrations by Kaizer and Osakwe [39], Umedum et al. [73], whilst high concentrations were recorded by Okoye and Iteyere [48].Ni is an important trace element for aquatic organisms, but higher concentrations can be toxic. It could be derived from both natural and anthropogenic activity. Ni pollution can come from a variety of sources, including industry, the usage of liquid and solid fuels, as well as municipal and industrial waste [29]. At high concentrations, nickel limits the growth of algae [23]. The concentration of Ni from water samples varied from 0.017 to 0.113
  in dry season and between 0.016 and 0.093
  in wet season. The mean concentration of Ni during the dry season was 0.048 ± 0.035
  and 0.044 ± 0.024
  during wet season. SP 5 showed the highest mean Ni values (0.106 ± 0.006
  ) while the lowest mean of Ni (0.018 ± 0.000
  ) was found at SP 1, both in dry season, across all SP (Table 8 and 9). Ni concentration exceeded WHO and NSDWQ/NIS limits (Table 10). This could be as a result of industrial and domestic wastes discharged in to the river.Cd is the one most commonly found heavy metals and is uniformly distributed in trace amounts in the earth’s crust and is highly toxic and responsible for several cases of food poisoning [32]. Small quantities of Cd cause adverse changes in the arteries of human kidneys [30]. Cd enters water through industrial discharges or the deterioration of galvanized pipes and can be present in groundwater from a wide variety of sources in the environment and from industry [33]. Cd was not detected in any of the sampling points for both seasons.Cr is a heavy metal that may be found in nature, but only in a mixed condition with oxidation states ranging from +2 to +6. Cr can enter natural streams by weathering of Cr-containing rocks, direct discharge from industrial operations, or soil leaching [72,40]. The valence state of Cr determines its toxicity to plants. Whilst Cr (VI) is very toxic and mobile, Cr (III) is not. Cr toxicity in contaminated water bodies has detrimental consequences for human health (carcinogen), as well as plant dry matter production, photosynthesis, and mineral nutrition [52]. The average concentration of Cr during dry season was 0.023 ± 0.012
  and ranged from 0.011 to 0.040
  . The highest concentration of Cr during dry season was recorded at SP 4 (0.037 ± 0.004
  ), ranged from 0.031 to 0.040
  while the lowest average concentration of Cr was measured at SP 3 (0.013 ± 0.003
  ), ranged from 0.011 − 0.017
  . The average concentration of Cr during wet season was 0.015 ± 0.005
  and ranged from 0.010 to 0.021
  . The highest concentration of Cr during wet season was recorded at SP 5 (0.020 ± 0.001
  ), ranged from 0.018 to 0.021
  while the lowest average concentration of Cr was measured at SP 2 (0.011 ± 0.001
  ), ranged from 0.010 − 0.012
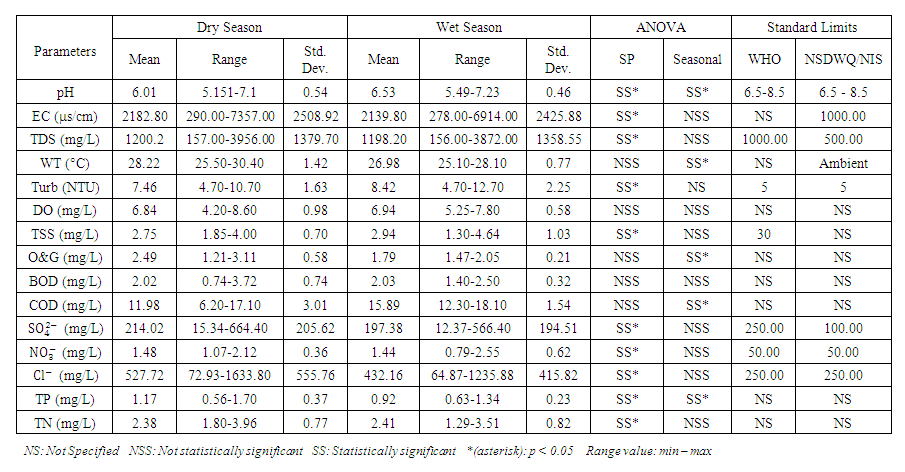
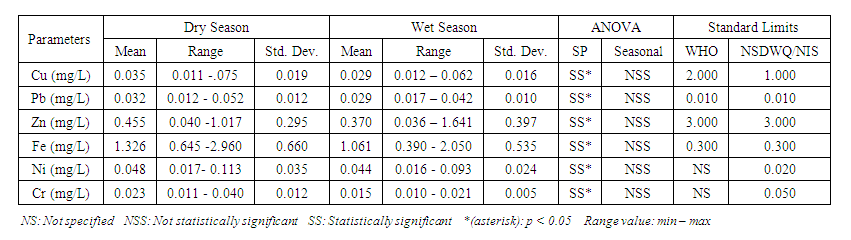
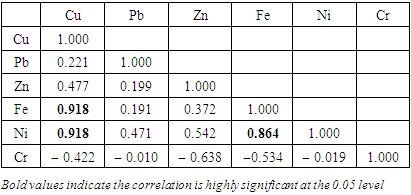
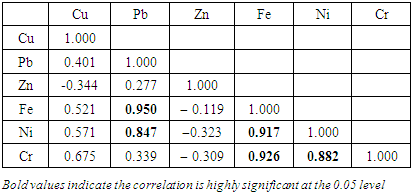
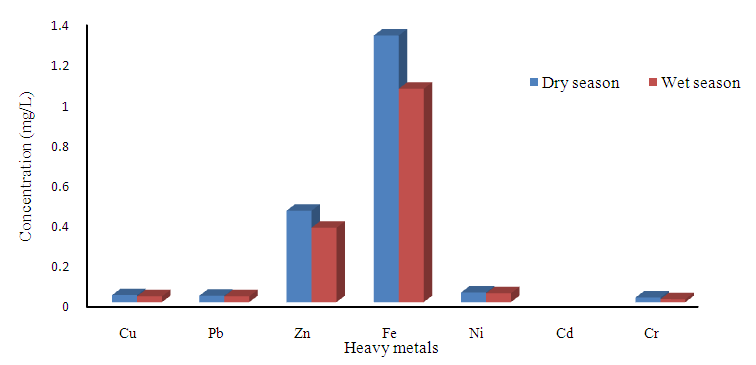
  (Table 8 and 9). Cr concentration did not exceed WHO and NSDWQ/NIS limits (Table 10). The mean concentration of the metals in the studied river, varied in the order of Fe > Zn > Ni > Cu > Pb > Cr (Figure 3). Heavy metal concentrations were greater during the dry season than during the rainy season. The maximum concentration of most metals during the dry season is owing to the river's gentler flow during the dry season, as well as the fact that water volume has decreased, causing dissolved metals to be at greater concentration levels with industrial and municipal discharge into the river remaining unchanged. There was significant variation (p < 0.05) in the mean values across the sample stations in Warri River for all of the analysed heavy metals, but there was no seasonal significant variation in mean value (p > 0.05) (Table 10). The correlation coefficient matrix among the selected heavy metals was presented in Tables 11 and 12. Strong significant correlations between the heavy metals during the dry season (Table 11) were Fe and Cu (r = 0.918), Ni and Cu (r = 0.918), Fe and Ni (r = 0.864), which could indicate the same or similar source input. Strong significant correlations between the heavy metals during the wet season (Table 12) were Fe and Pb (r = 0.950), Ni and Pb (r = 0.847), Ni and Fe (r = 0.917, Cr and Fe (r = 0.926), Cr and Ni (r = 0.882), which could indicate the same or similar source input.
|
|
 | Figure 3. Heavy metals concentration during dry and wet season |
4. Conclusions and Recommendations
- The assessment result of surface water samples from Warri River for physicochemical parameters and heavy metals revealed a significant contamination as one travels down from SP 1 to SP 5. The high concentration of EC, TDS,
 and Turb followed this trend and could be as a result of more dense industrial activity as you travel down the river, mostly during the dry season. The concentration of the aforementioned physiochemical parameters exceeded the standard allowable limits of NSDWQ/NIS and WHO from SP 3 to SP 5, which confirms the presence of inorganic salts, organic matter, and other dissolved materials in Warri River. Fe is quite abundant in the earth’s crust; hence, natural waters always contain a variable concentration of Fe. Hence, the high concentration of Fe could be as a result of the geological make-up of the river bed and/or industrial activities along the river. The concentrations of Fe, Pb and Ni exceeded the NSDWQ/NIS and WHO standard limits, while Cd was not detected for both seasons. As a result, the government and other responsible authorities should take necessary remedial action and endorse further research into other physical, chemical, and unassessed biological parameters of serious environmental concern, as well as the identification of possible sources of high EC. However, more research is needed to separate the natural and anthropogenic contributions to the chemical and biological state of Warri River.
Declaration of Competing Interest
- The authors have no conflict of interest.
ACKNOWLEDGMENTS
- This work was supported by Jacio Environmental Limited, Effurun, Delta State, Nigeria.