-
Paper Information
- Paper Submission
-
Journal Information
- About This Journal
- Editorial Board
- Current Issue
- Archive
- Author Guidelines
- Contact Us
Advances in Analytical Chemistry
p-ISSN: 2163-2839 e-ISSN: 2163-2847
2019; 9(2): 23-33
doi:10.5923/j.aac.20190902.01

Validation of the Atomic Absorption Spectroscopy (AAS) for Heavy Metal Analysis and Geochemical Exploration of Sediment Samples from the Sebangan River
 Abstract
 Reference
 Full-Text PDF
 Full-text HTML
Asare Ebenezer Aquisman1, 2, Zaini Bin Assim1, Rafeah Binti Wahi1, Droepenu Eric Kwabena1, 2, Wilson Festus3
1Faculty of Resource Science and Technology, Universiti Malaysia Sarawak, Kota Samarahan, Sarawak State, Malaysia
2Graduate School of Nuclear and Allied Sciences, University of Ghana, AE1, Kwabenya –Accra, Ghana
3Graduate School, University of Education Winneba, Central Region, Ghana
Correspondence to: Asare Ebenezer Aquisman, Faculty of Resource Science and Technology, Universiti Malaysia Sarawak, Kota Samarahan, Sarawak State, Malaysia.
| Email: |  |
Copyright © 2019 The Author(s). Published by Scientific & Academic Publishing.
This work is licensed under the Creative Commons Attribution International License (CC BY).
http://creativecommons.org/licenses/by/4.0/

This study was to validate the Atomic Absorption Spectroscopy (AAS) in the determination of heavy metals using surface sediments from the Sebangan (estuary of Sadong River), Sarawak State, Malaysia as a case study. Aqua regia procedure was used to extract the trace elements from the sediments. The Scanning Electron Microscope was used to analyse and investigate the microstructure morphology and chemical composition characterizations of the sediments. The results of the examination confirmed to the fact that the technique validated was appropriate and less laborious for the determination of the 12 metals of interest (Al, Mn, Ca, Cd, Cu, Fe, Cr, Ni, Co, Zn and Pb) in the sediment. Massive deposits of sharp teeth granite and quartz particles of distinct tetrahedral conformation with plus size were observed in the samples investigated.
Keywords: Validation, Atomic Absorption Spectroscopy, Aqua regia, Sediment, Scanning Electron Microscope
Cite this paper: Asare Ebenezer Aquisman, Zaini Bin Assim, Rafeah Binti Wahi, Droepenu Eric Kwabena, Wilson Festus, Validation of the Atomic Absorption Spectroscopy (AAS) for Heavy Metal Analysis and Geochemical Exploration of Sediment Samples from the Sebangan River, Advances in Analytical Chemistry, Vol. 9 No. 2, 2019, pp. 23-33. doi: 10.5923/j.aac.20190902.01.
Article Outline
1. Introduction
- A challenge exists in the estimation of the concentrations of trace elements in sediment, soil and water samples in aquatic and terrestrial ecosystems. The results attained usually differ with respect to the analytical technique employed [1-4]. Heavy metals pose a severe threat as pollutants of both aquatic and terrestrial ecosystems because of their noxiousness and tenacity in infinitesimal proportions. Mercury (Hg), Lead (Pb), Cadmium (Cd), Chromium (Cr) and Nickel (Ni) are by far the most profuse, tenacious and deadly heavy metals prevailing in the biosphere [5-7]. Sediments are reservoirs of a variation of biological and chemical waste including trace quantities of metals such as Mn, Co, Ni, Mo, Cu, Cd and Cr. The physiognomies of metals dissolved in water and sediments depend on the character of the metal species. Thus the speciation of metals is vital in the environmental chemistry of natural aquatic systems and water from sewage systems [7,8]. According to [7], the chemical nature and possible occurrence of elements related to the sediment load can be deduced by the extraction techniques connecting the use of a variability of reagents. Consequently, [5], opined that the determination of metal speciation with sequential extraction technique provides a vital approach for the assessment of the methods of occurrence and dissemination of heavy metals in dynamic atmospheres especially where metal concentration scattering patterns can be credited to a diversity of lithogenic and human-induced geochemical interactions. According to [9], speciation analysis of an element is the estimation of the individual concentrations of the various chemical forms of that element which constitute the total concentration of that element in a sample. Speciation is significant to the comprehension of trace element toxicity, in both aquatic and biological systems. Chemical speciation methods contribute data on bioavailability [6,7]. Numerous speciation researches on trace elements involving natural waters, aquatic organisms, sediments and soils have been conducted over the years. Several modern analytical techniques are available for reliable speciation studies in waters and sediments exist, including ultrafiltration, electrophoresis, ion exchange, dialysis, liquid-liquid extraction, polarography, anodic stripping voltammetry, AAS (Atomic Absorption Spectrophotometry) [1-4,10], ICP-OES (Inductively Coupled Plasma - Optical Emission Spectroscopic) [6-8,11] and ICP-MS (Inductively Coupled Plasma - Mass Spectrometry) [5-8,11]. The Atomic absorption spectroscopy (AAS) is a significant instrumental technique for the determination of these metals because of its numerous advantages including low cost, significant accuracy, greater sensitivity and detection limits as well as relatively short duration for analysis [1]. The objective of this paper is to validate the Atomic Absorption Spectroscopy (AAS) in the determination of heavy metals using surface sediments from the Sebangan (estuary of Sadong River), Sarawak, Malaysia as a case study.
2. Study Area
- In March 2019, a total of 15 surface sediments were assembled from Sebangan River (estuary of Sadong River). The samples were collected from five (5) different stations. The GPS of the location is N 01°33′03.2″ E110°45′56.4″. The Wedepohl stainless steel grab sampler was employed for sample collection. The samples were then transferred into polyethylene bags. They were kept refrigerated at a temperature of -40°C.
3. Experimental Procedure
3.1. Materials
- Reagents of analytical grade were used. The solvents used in the preparation of the standard were deionized and distilled water. For the analysis, concentrated acids and 1000.0ppm standard stock solutions were bought from Merck in Germany. Each of the elemental standard solutions was prepared according to the instructions from the leaflet attached to the various 1000.0 ppm single-elemental standard solutions bought from Merck. The polyethylene containers as well as glassware were positioned in 15% tetraoxosulphate (iv) acid (H2SO4) for a day before used. Double-distilled water was used to rinse all the glassware. Certified Reference Material (CRM) Number 142Q, sewage sludge amended soil, standardized by Reference from Community Bureau was used to define the correctness of the techniques. A graduated balance was used for recording the weight of the samples. In order to evaluate the moisture content, a drying oven (MEMMERT B113.1096) at a temperature of 105°C was used. The loss of ignition at a temperature of 550°C was done by using muffle furnace (Ney Vulcan D-550 series).
3.2. Extraction Procedure
- Extraction of heavy metals in sediment samples were performed using an aqua regia extraction procedure described by [9]. Aqua regia has been shown to be an appropriate extractant for arsenic and metals from soils and sediments [9]. Sediment samples were dried for 4 hours at 105°C and they were grounded onto a homogenous fine powder using agate mortar and pestle. A 0.5 g aliquot of each dry sediment sample was placed into a borosilicate beaker, and 12 mL aqua regia (3:1 HCl/HNO3) was added. The beakers were covered with watch glasses and left for 16 hours at room temperature. The samples were heated for 2 hours on a hot plate at approximately 80°C. After the first 15 hours of heating the watch glasses were removed and small amounts of 1% v/v HNO3 were periodically added to avoid drying of the samples. The samples were allowed to cool and then filtered on Whatman 41 filter papers. The samples were taken to 50 mL 1% v/v HNO3, thoroughly washing beakers and filters. All reagents used were of analytical grade or better and Milli-Q water was used for the whole process.
3.3. Instrumentation
3.3.1. Atomic Absorption Spectrophotometer (AAS) Validation
- According to [1] the Atomic Absorption Spectroscopy is used for qualitative and quantitative analysis of an element. The technique is based on the measurement of the absorption of optical radiation by atoms in the gaseous state. The technique is fast, simple and is applied for the analysis of many trace elements found in sediments, soils, industrial and domestic detritus, surface and underground water. The concentrations of trace elements in single-elemental standard samples were analyzed using a Perkin Elmer Atomic Absorption Spectrophotometer (AAS) Model Optima 8300 series using acetylene, nitrous oxide and compressed air for burning. The gases have a specific flow rate based on the element of interest. Flame atomiser is divided into two (2), total consumption burner and premixed burner. Temperature of the rod was raised to dry and atomise the sample in a chamber. A hollow – cathode lamp (HCL) are made of the metal of the substance to be analysed (each metal have a specific HCL). The anode is made up of Tungsten with each HCL has a particular current for optimum performance. Above all, higher voltage produced a brighter or clear emission and less baseline noise. Deuterium lamp was used to calibrate the wavelength for background purposes. Standard and blank solutions were prepared by using 1% (v/v) HNO3. Three (3) different concentrations were prepared by adding suitable volume of stock standard solution (100 mg/kg) to 100.0 mL capacity graduated flask and it was top up with distilled water to the mark.
3.3.2. Scanning Electron Microscopy (SEM) Analysis
- According to [12], the scanning electron microscope (SEM) is one of the most versatile instruments available for the analysis and examination of the microstructure morphology and chemical composition characterizations. It is a type of microscope that forms several images by focusing a beam of electrons onto a surface of a material and using the returned interactions to create an image. In this instance the electrons are emitted via a field emission gun (FEG)/ tungsten cathode and accelerator. In the process of SEM characterization, small amount of the sediment samples was placed onto an aluminium plate with the help of double edged adhesive membrane on the plate. The sample were further mounted on a sample holder followed by coating with a conductive metal (gold) using a sputter coater. The whole sample was analysed by scanning with a focused fine beam of electrons using JOEL JSM-6390LA Analytical Scanning Electron Microscope.
3.4. Statistical Analysis of Data
- The Statistical Package for Social Science (IBM SPP version 24) was employed for the analysis and statistical computation of the data obtained.
4. Results and Discussion
4.1. Figures of Advantage
- As an indispensable analytical prerequisite the principle of validation forms an inevitable part of the process of elemental analysis. The method provides a system for elucidating instrumental demand. It also confirms the performance capacities of the technique being scrutinized by ensuring that it is congruent with methodological requirements.
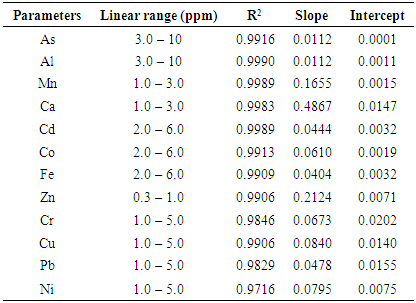
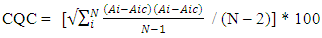
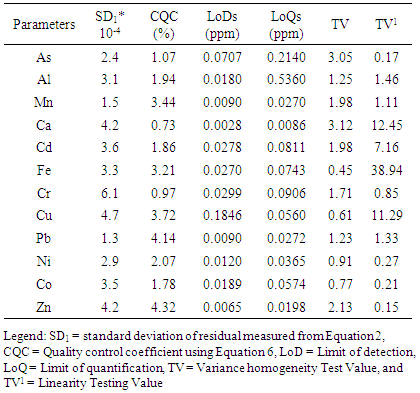
4.2. Calibration Equation
- A proven correlation relating the concentration of standard solution and the discharge intensity [5,13,14] is vital for quantitative appraisal. To achieve this, the instrumental indicator was linked to the analyte concentration beside calibration function [5]. The CQC (quality control coefficient) (CQC) and correlation coefficient were engaged for the investigation of the calibration curve linearity [5]. The calibration equation of the straight line for each element was measured using linear regression analysis [15], This was attained from the homogeneity of the difference (variance) of the calculated results divided by the mass concentration limits previously determined and confirmed by the value of F- statistic [5,16]. The results of the linear regression of all the selected elements are shown in Table 1.
|
 | (1) |
 | (2) |
 | (3) |
 | (4) |
 | (5) |
 | (6) |
|
4.3. Calibration Stability
- Assessing the calibration stability requires the utilization of the quality control standard (QCS) at the end of 5 samples for the measurement of the analytical instrument shift. To achieve this standard solution chosen from the list of the calibration solutions prepared from variety of stock solution was utilized [5,14]. The following QCSs were selected and used Zn (0.1 ppm); Mn and Ca (0.2 ppm); Cd and Fe (0.3 ppm); As and Al (0.4 ppm); Ni, Cr, Cu and Pb (0.5 ppm) and Co (0.6 ppm). The results for quality control standards (QCSs) are acceptable if the bias exhibited in percentages were not greater than ± 10% of the known value. In this case, the calculated relative error values were within the acceptable range.A re-assessment should be conducted when QCS values were not within the accepted range. After the re-assessment and if the quality control standard measurements are still not within the defined limits, ignore the old calibration and new calibration has to be set-out [2,5]. Fig. 1 shows the percentage relative errors of each of the QCS evaluations when analysing the sediments samples in AAS. The values received were within the acceptable range (± 10%), showing that there is a stability of calibration possibilities which exist in all computations.
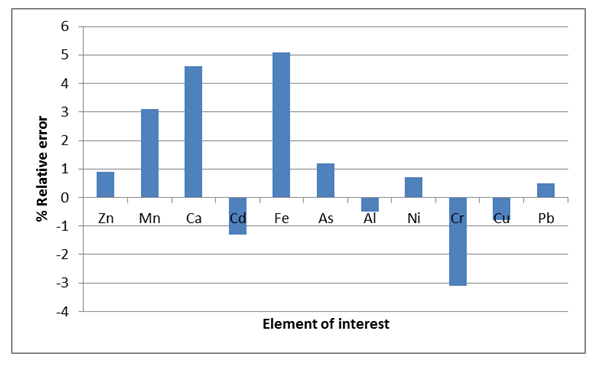 | Figure 1. Relative bias computed for QCS to check the stability of calibration for selected elements evaluated by AAS |
4.4. Matrix Effect
|
 | (7) |
 | (8) |
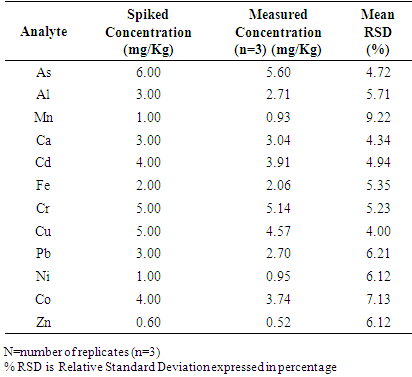
4.5. Precision Performance Studies
- The precision shows the closeness of understanding between links of computations established from two or more sampling of the same homogeneous sample in the preferred conditions and is mostly evaluated as relative standard deviation [18-24]. The analytical accuracy was performed by evaluating the repeatability of instrument response to analyte according to the commission regulation [18,23]. To assess repeatability, measurements and the analysis were performed with three replicates. The procedures were repeated on the rest of events. The spiked concentration of each of the elements evaluated, average concentration and relative standard deviation are briefed in Table 4. According to RSD Horwitch function the highest relative standard deviation values acceptable for the concentration of less than or equal to 1000 ppm is 10% [18-29]. Hence, the method developed showed reasonable repeatability accuracy because relative standard deviation values evaluated were within the acceptable range.
|
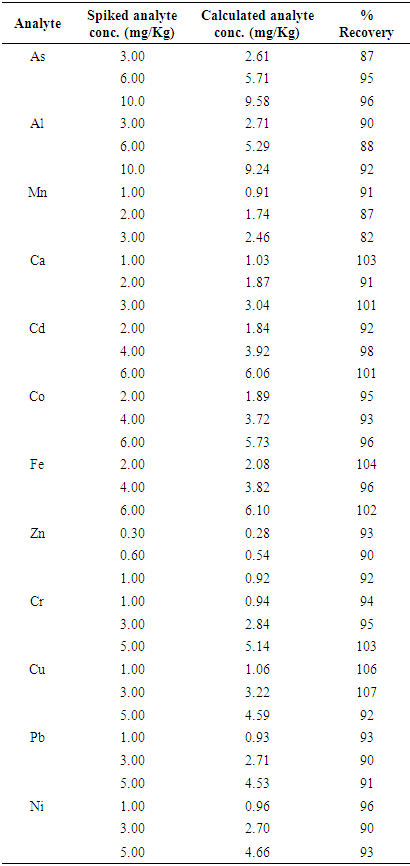
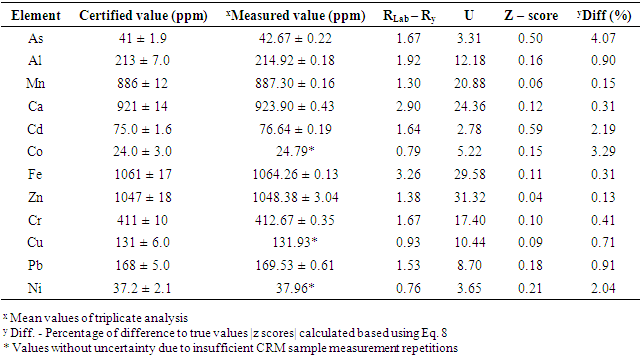
4.6. Accuracy
- The accuracy performance of computations shows how close a value or an outcome appears to the reference value. The test of accuracy can be performed in many ways, that’s by comparing values received by variety of methods (by considering one of them to be a reference), by using the results of different laboratories or by applying CRM (certified reference material), and therefore any suitable method available can be used. In this present study, the test of accuracy was evaluated by considering certified reference material (CRM) the reason was that the outcome received from certified reference material analysis was the suitable evaluations of the accuracy of the method, because it was easy to compare with international standards, i.e. Community Bureau of Reference (BCR). Perhaps, the regression line was used to trace the values using SPSS Statistics. The accuracy was assessed from the Z-score value [5,16,20,21,30] using Equation 9.
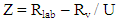 | (9) |
 | (10) |
|
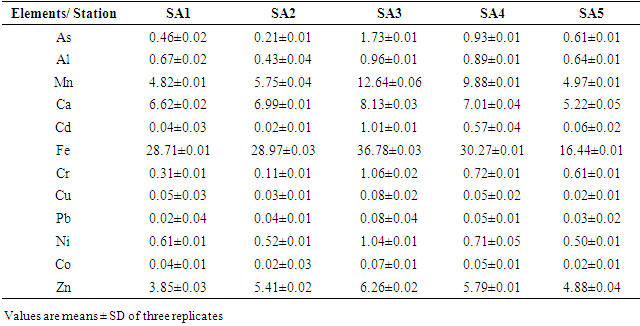
4.7. The Outline of Heavy Metals Concentrations and Morphology in Sediments
- Table 6 and Fig. 2 shows the differences in concentrations of interested trace elements in the examined sediment samples collected from the Sebangan River (estuary of Sadong river).
|
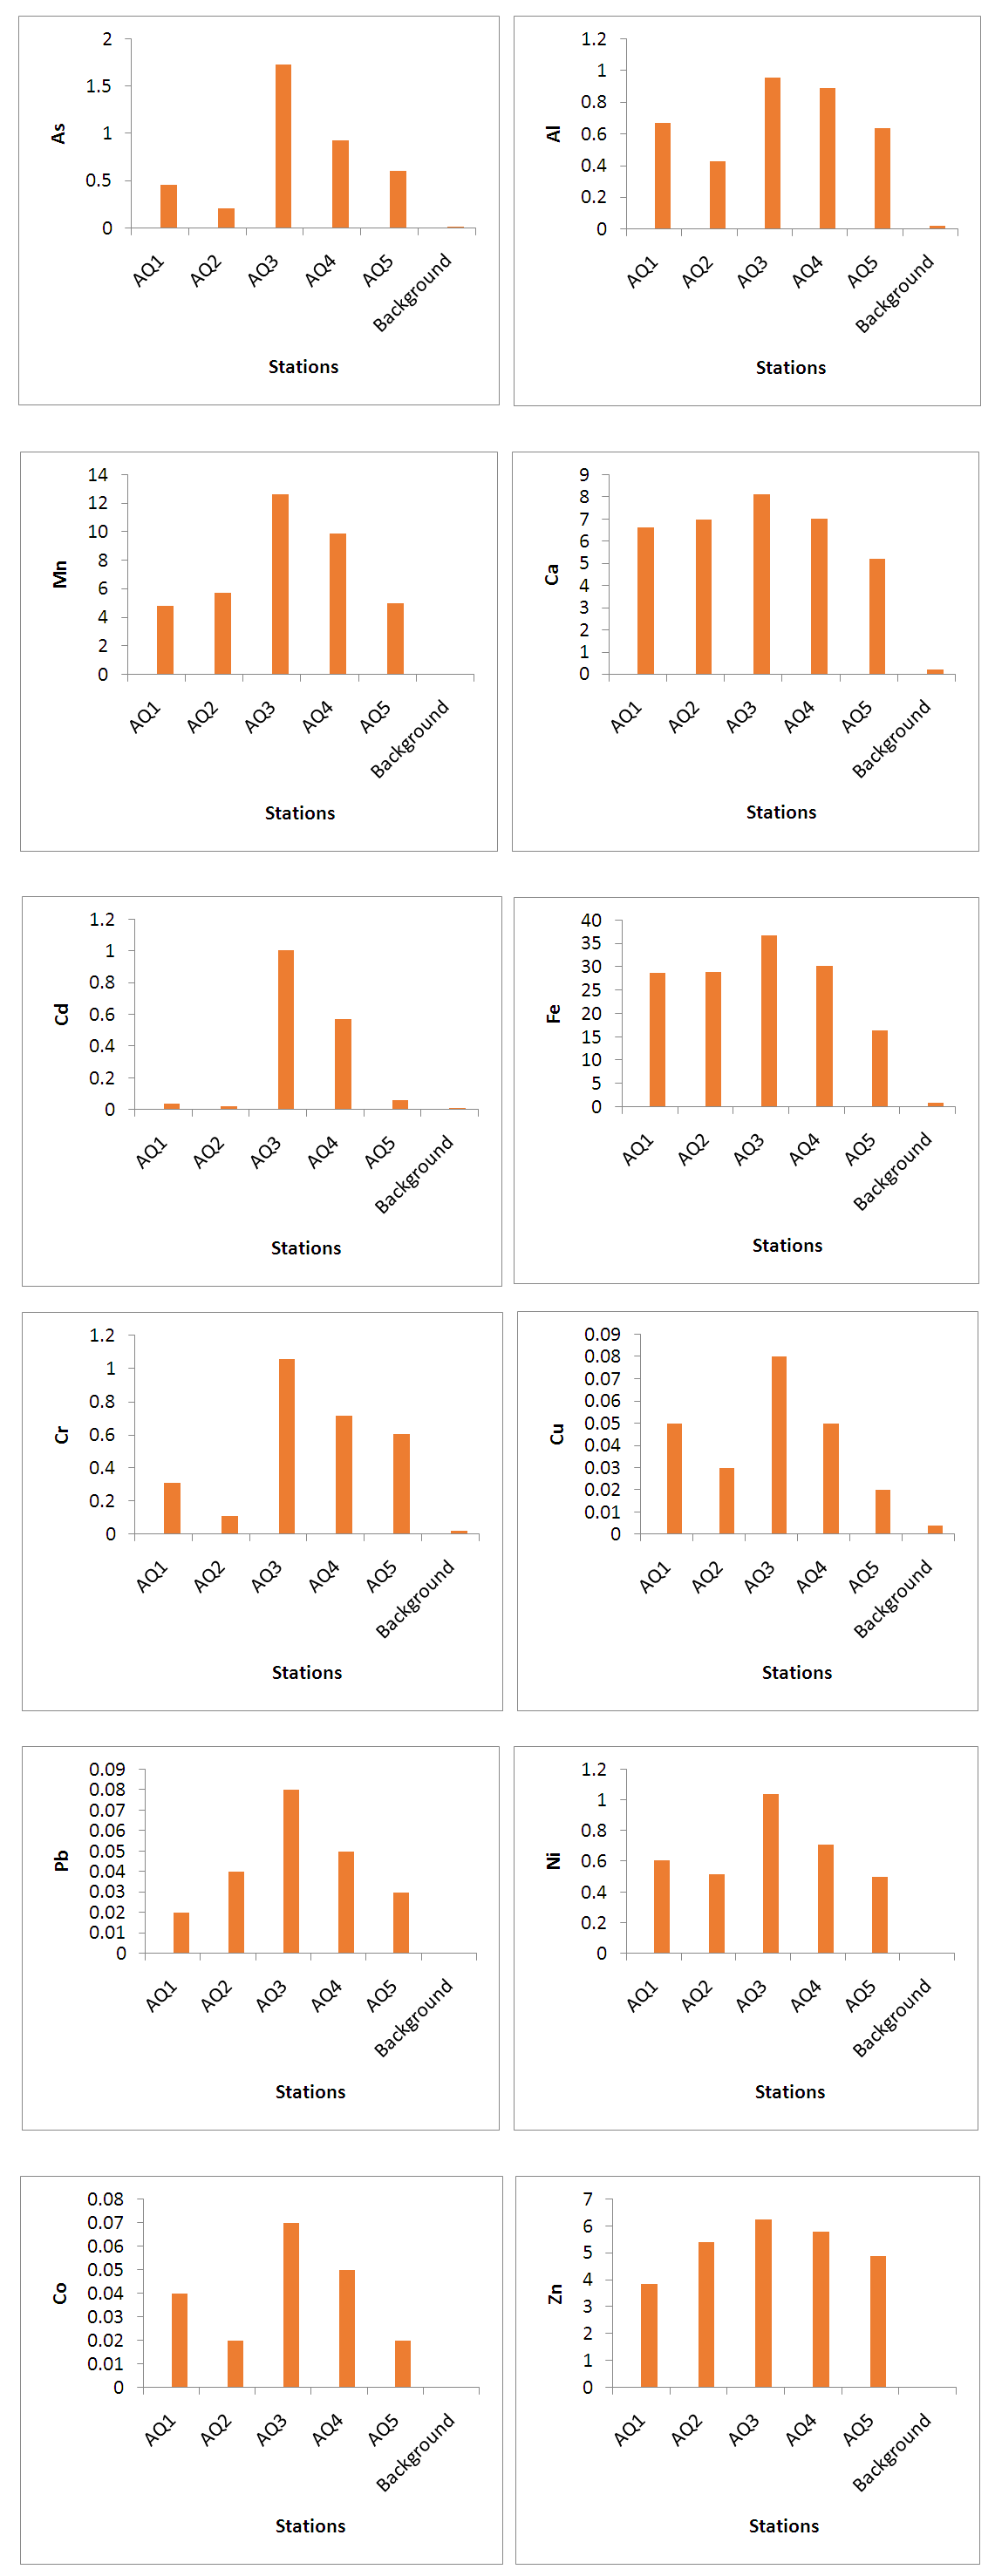 | Figure 2. Variations of analysed heavy metals contents in the sediments from the Sebagan River |
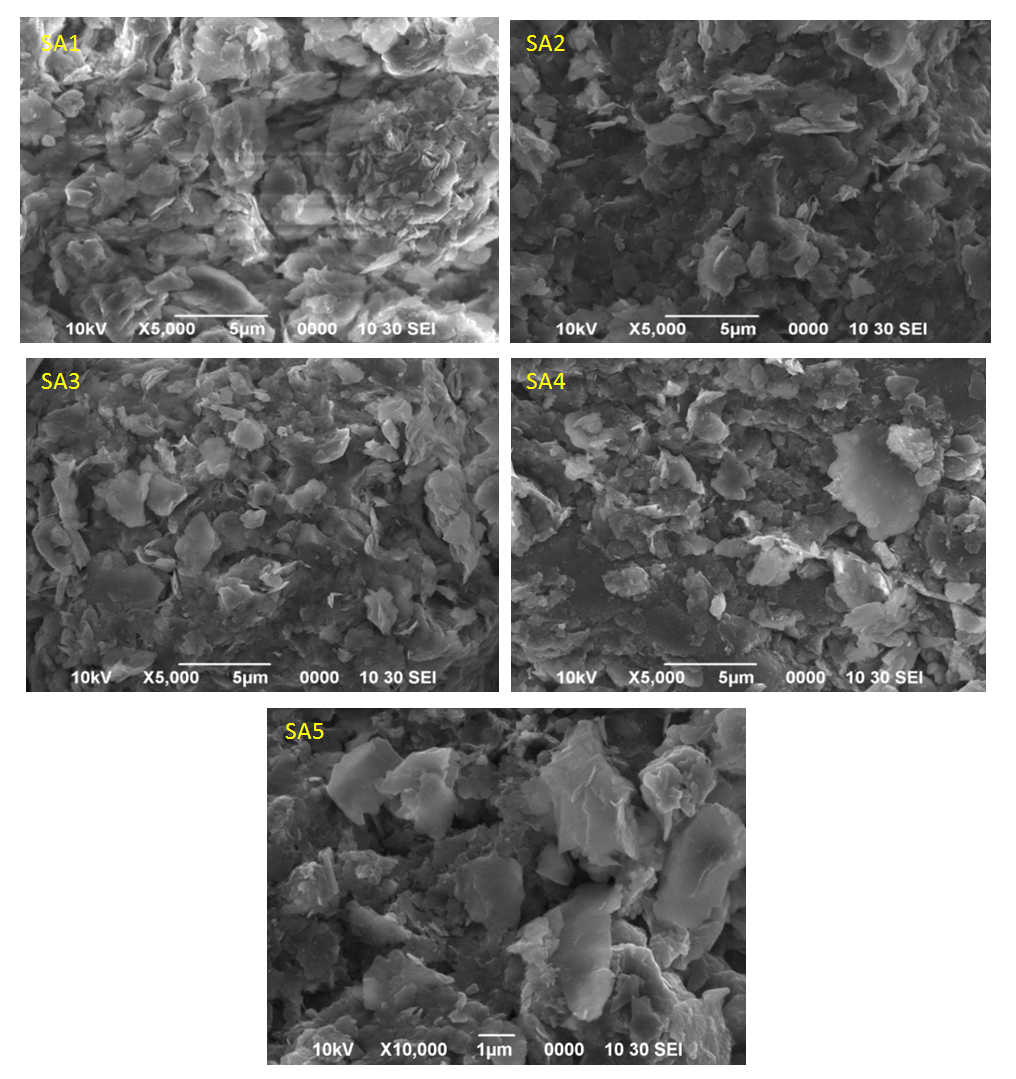 | Figure 3. Scanning electron microscope micrographs of five stations sampled from Sebagan River |
5. Discussion
- Table 6 and Fig. 2 explicated the results of contents of trace metals of interest in 5 sediment samples stations using AAS. The results obtained from the analytical assessment are based on expression of an oven-dry weight at a temperature of 105°C. Oven-dried sediment samples were used for the analytical work because losses might happen for some trace metals through the drying process at 105°C. Hence, the values obtained were corrected in relation to the level of moisture. The following observations were momentarily perceived: the maximum concentrations of heavy metals were detected in sample areas amassed immediately downstream of the Station 2 region where about 58% of the industrial activities are sited and also the lower portions of the Station 3 of the river. Consequently, lesser proportions of heavy metals were acquired from the samples gathered in the middle station. This was because of the decrease in content with the dislocation from the source of adulteration and, also as a result of reduction in concentrations (dilution) due to uncontaminated sediments collected from the riverbanks due to erosion (lateral and splash type) of the waterway. This was observed at the median segment of the Sebangan River, in which there are numerous undercut banks possessed of Pleistocene non-polluted sediments. Also, an extensive reduction in the concentration levels of heavy metals was noticed owing to their deepness and distance from the bottom of the river. The present – day sediments deposits accumulate at the bottom of the river including the riverbanks are distinguished by reduction in heavy metals contents, except natively the river wear away and gather its aged polluted sediment. Furthermore, it is imperative that mineralogical exploration is essential when evaluating the concentration levels of heavy metals and examining the source of pollution by trace elements in sediment samples. The geological form of the Kuching division, where river Sebangan (estuary of Sadong river) runs, is influenced by sediments of quaternary which consist of sands, silts and clays of sediment source, glacial tills, fluvio-glacial sands and gravels and different types of organic and organo-mineral sediments including humic acid, fluvic acid, peat and peaty muds (accumulated organic sediment obtained from the fungal and bacterial degradation of dead plants biopolymers). There is an incidence of typological variation of sediments constituents in the river of Sadong as a result of the geological properties and utilization of land (primarily agricultural operations emanating from high soil fertility and a unique texture. Considering the sediments from the Sebangan River (Estuary of Sadong River) from a mineralogical viewpoint indicates that they mainly consist of the igneous materials (granite and quartz grains) of various fragments, forming at least 63-91% of aggregate mass. About 13% is from other mineral particles including orthoclase feldspar and clay minerals (Kaolinite, illite and montmorillonite). The portion of dead remains of plants and animals (organic matter) consisted of scattered charcoals, humus as well as peat in the samples analysed was mainly 7-16%, an area where the humid is more the portion can extend to 18 to 56%.On Fig. 3, The SEM (scanning electron microscope) technique was adopted for the geochemical analysis of the components of samples. The scanning electron microscope micrographs represent samples from the Sebangan River (Estuary of Sadong River). Massive deposits of sharp teeth granite and quartz particles of distinct tetrahedral conformation with plus size were observed in the samples investigated. Fig. 3 indicated that the results from the SEM micrographs revealed that sediment samples were flakes or petal types. A small number of the sample particles were dispersed, confirming the availability of sand minerals, meanwhile a larger percentage of the particles were agglomerated which showed the presence of a greater portion of granite and quartz. There was an observation of clay minerals with the sandy particles of quartz isolated either as aggregates or groups. The scanned sediments were separated not only on the basis of shapes (tetrahedron), but also a portion of organic materials and its categorizations, including the carbonates and the presence of pH. The samples showed pH ranges from 6.2 - 8.3, while there was no indication of carbonates. The presence of igneous materials (granite and quartz grains) of several dimensions was confirmed as dominating components. As shown, the highest concentration levels of metalloids are linked to the groups of minerals comprising of clay minerals and organic materials which influence sorbing and bonding indicating a proportionate maximum concentration of heavy metals in the samples investigated. It is obvious that human activities within the area of study, such as farming and industrialization contribute immensely to the sorbing and bonding of trace elements in sediments from the Sebangan River.
6. Conclusions
- To conclude, it was evident that quality control processes and principles were adhered to in validation of the Atomic Absorption Spectroscopy (AAS), especially in relation to evaluations of metals of concern, as present in the samples collected from the Sebangan River. The analytical data secured were presented at a temperature of 105°C on a dry-mass basis as indicated in Table 6. The outcomes of the investigation attested to the fact that the technique validated was appropriate and less laborious for the evaluation of the 12 metals of interest namely Al, Mn, Ca, Cd, Cu, Fe, Cr, Ni, Co, Zn and Pb in the sediment. The calibration equations are satisfactory because of the well-established un-weighted least squares approach applied. The calibration stability in the process of sediments examination was confirmed via the relative error of the quality control computations and the results acquired were within the conventional boundaries, maintaining the stability of calibration in the entire calculations. The retrievals were congruent with the demarcated limit of 90.0 – 110.0%, thus the matrix effect is considered inconsequential. The accuracy test corroborated satisfactory z-score values for all the elements probed (i.e. |z| score values were less than 2). The experimental results attained equally substantiate that vertical profiles of these metals from the Sebangan River can present findings on anthropogenic operations. The results showed that sediments from locations subject to the effects of urbanization and industrialization documented maximum concentrations of the metals under consideration. Finally, it is imperative to note that the deposition of new sediments at the bottom of rivers and riverbanks contribute immeasurably to the extensive decline in the level of heavy metals in relation to the depth and distance from the bottom of the Sebangan River.