Maitera O. N.1, Louis H.2, 3, Emmanuel Y. Y.1, Akakuru O. U.3, 4, Nosike E. I.5
1Department of Chemistry, Modibbo Adama University of Technology, Yola, Nigeria
2CAS Key Laboratory for Nanosystem and Hierarchical Fabrication, CAS Centre For Excellence in Nanoscience, National Centre for Nanoscience and Technology, University of Chinese Academy of Sciences, Beijing, China
3Department of Pure and Applied Chemistry, University of Calabar, Nigeria
4Ningbo Institute of Materials Technology and Engineering, Chinese Academy of Sciences, Zhejiang, China
5Department of Chemistry, Federal University of Technology, Owerri, Nigeria
Correspondence to: Akakuru O. U., Department of Pure and Applied Chemistry, University of Calabar, Nigeria.
| Email: |  |
Copyright © 2018 Scientific & Academic Publishing. All Rights Reserved.
This work is licensed under the Creative Commons Attribution International License (CC BY).
http://creativecommons.org/licenses/by/4.0/

Abstract
This study was aimed at monitoring the ambient air quality along some busy locations within Jimeta/Yola Metropolis of Adamawa State, Nigeria. The study was conducted from July, 2015 to March, 2016. Crowcon Gasmann portable gas monitor model CE-89/336/EEC was used for the monitoring of CO and NO2, at ten different locations. The result indicate that the concentration of CO and NO2 were high during the dry season at all the locations especially at location 9 and 7 where the concentrations obtained are 19.41 and 15.00 ppm for CO and NO2 respectively. These values of CO and NO2 pollutants at some locations were found to be above the acceptable limit (10.00 ppm) for the air quality index AQI stipulated by the Federal Environmental Protection Agency FEPA and World Health Organization WHO. This indicates that, the atmospheres within Jimeta/Yola metropolis was poor, revealing that population is a threat to air pollution which may pose health risk. Hence, based on these findings, preventive measures and sustainable solutions such as effective vehicle inspection, enforcement of legislations, and supply of electricity (necessitating the use of electricity generating sets) should be enforced among others to ensure safe environment for the living systems to live as these practices increase the levels of CO and NO2 in Nigerian cities.
Keywords:
Gaseous pollutant, Air quality, Gas monitor, Pollution, Jimeta/Yola
Cite this paper: Maitera O. N., Louis H., Emmanuel Y. Y., Akakuru O. U., Nosike E. I., Air Quality Index of CO and NO2 in Ambient Air of Jemita/Yola Metropolis, Adamawa State, Nigeria, Advances in Analytical Chemistry, Vol. 8 No. 1, 2018, pp. 1-5. doi: 10.5923/j.aac.20180801.01.
1. Introduction
Despite the global advancement to address key environmental problems, much improvement has not been made in developing countries where the problems are pervasive. Outdoor air pollution continues to be one of the many environmental problems that need attention in many African countries [1]. Air pollutants are classified into two groups; primary and secondary air pollutants. The primary pollutants are commonly found air pollutants that can have adverse effect on health and the environment. They include particulate matter (PM), oxides of Nitrogen (NOx), Oxides of Sulphur (SOx), Carbon Monoxide (CO) and Lead [2]. These primary pollutants are toxic and very injurious to health. Apart from their natural presence in air, they have been introduced into the air by various types of anthropogenic activities such as combustion processes that occur in the engine of vehicles, bush-burning, electricity generating plants, decaying of accumulated organic plants and domestic wastes, and other industrial processes [3]. SO2 has been reported to be an indoor pollutant having resulting attendant negatives in Kano State Nigeria [4]. However, air quality has a strong link to human health and as has been shown in many epidemiological studies [5, 6]. Due to this, the World Health Organization (WHO) has continued to publish and update air quality guidelines of some common air pollutants like particulate matter, ozone, hydrogen sulphide, nitrogen dioxide, sulphur dioxide and carbon monoxide, to provide information on monitoring and reducing the health impact of these air pollutants [7].Carbon monoxide is a colourless, odourless, highly toxic and non-irritating poisonous gas which is produced by incomplete combustion processes of natural gas, coal, wood, used of vehicles, industrial generators and households appliances for cooking activities. CO displaces oxygen inhuman blood, causing oxygen deprivation [8, 9]. Oxide of Nitrogen refers to the mixture of nitric oxide (NO) and nitrogen dioxide (NO2) formed by the oxidation of nitrogen during the combustion of air. The majority of NOx is produced in motor vehicle emissions, although other sources include atmospheric lighting discharged and biogenic oxidation of nitrogen compound present in soil [10]. NO2 is a respiratory irritant that can also corrodes metals at high concentrations [1].Jimeta-Yola is the capital of Adamawa State located in the North-Eastern Nigeria and commercialized urban city with some industrial processes and accompanying high human activities and vehicular movements at all times resulting into emissions that might increase the levels of these pollutants that may ultimately have adverse effects on both living systems and the environment. This study therefore, seeks to determine and establish baseline data on the quality of ambient air in Jimeta-Yola metropolis by monitoring the levels of CO and NO2 in the ambient air of the metropolis.
2. Materials and Methods
MaterialsA portable gas monitor (model CE-89/336/EEC by Crown Instrument Ltd Oxon, United Kingdom) for each gas and sound level out-door thermometers (model DPM300PP by General Tools and Instruments LLC, United States of America) were used. Study Area Yola is the capital city and administrative center of Adamawa State. The city is located on the Benue River between 9.2°N and 12.48°E, it has a population of 3,737,233. However, Yola has an annual low temperature of 21.7°C and a high temperature of 34.1°C, which gives the total average of 28.1°C and an annual precipitation of 917 mm. Ten locations were selected for the study along the major roads in Jimata/Yola metropolis, as shown in Figure 1. It shows the major roads and sampling areas in Yola metropolis. These locations includes; Yola town Market (location 1), Jippu-Jam Rounderbout (location 2), AA Lawan (location 3), Police Roundabout (location 4), Jimeta shopping Complex (location 5), Mubi Roundabout (location 6), Hayin Gada (location 7), Jimeta-main Market (location 8), Airport Roundabout (location 9) and Janbutu Market (location 10), farm center (Location C). A farmland located beside Federal Government Girls' College (FGGC) Jimeta/Yola was used as control site because FGGC is located where there are less human activities that can increase the levels of CO and NO2 in this terrain - neither close to houses nor any main road. Put differently, our location standard is a very isolated area which is almost in the out sketch of Jimeta/Yola.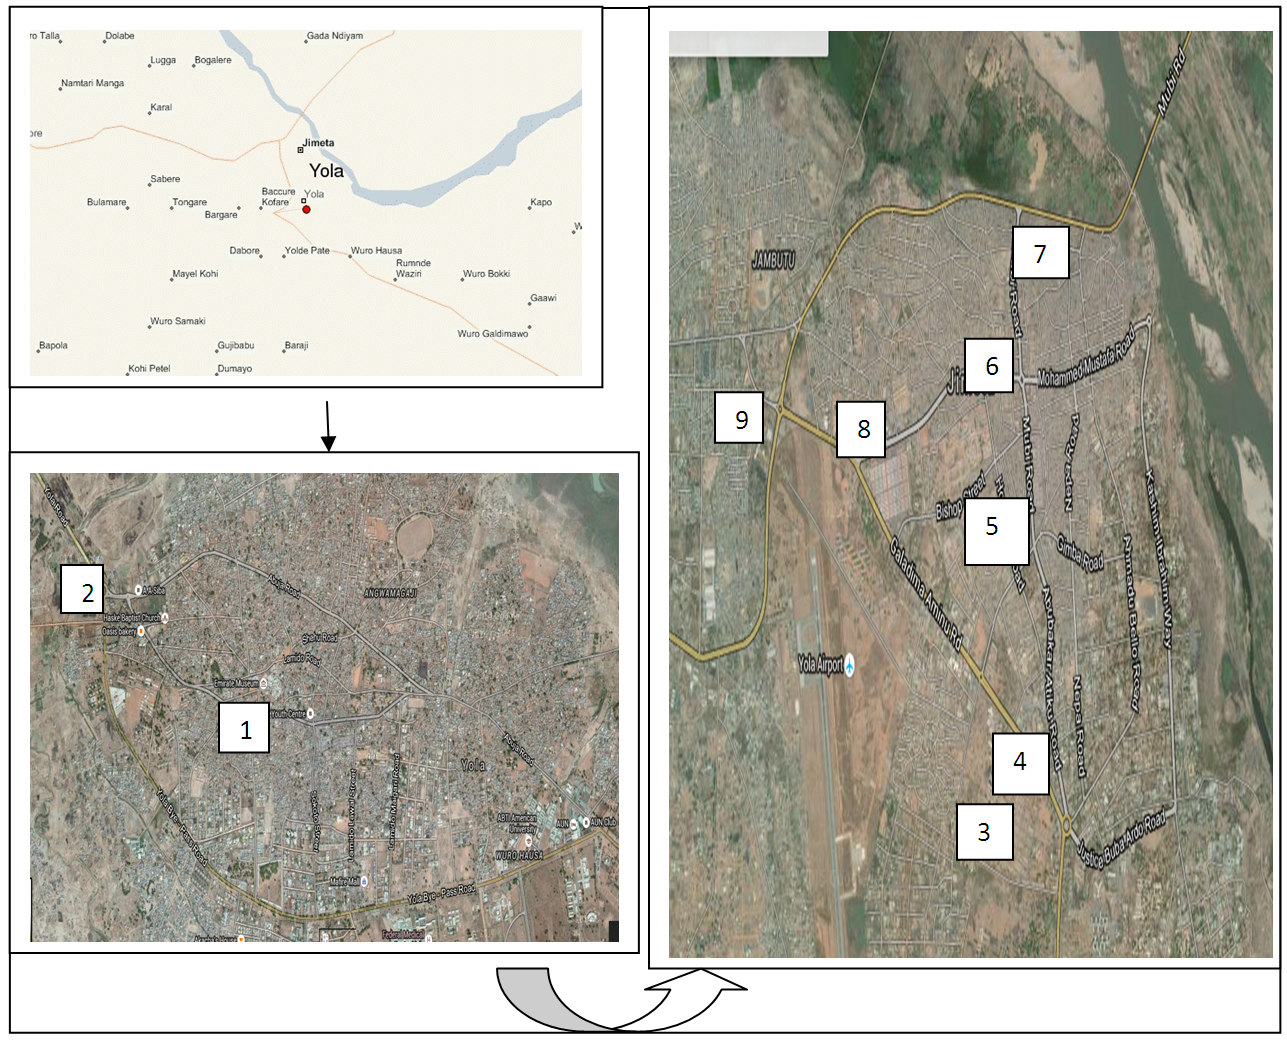 | Figure 1. Map of Jimeta/Yola showing the study areas |
Data Collection and AnalysisAir quality data were collected directly from the sampling location through a manual control monitoring gas detector, which automatically measure and record ambient air quality of that location. The operational principle is based on thermal conductivity which measures the gas sample ability to transmit heat by comparing it with a reference gas (usually air). Two sensors (detecting sensor and compensating sensor) are built into a Wheatstone bridge. The detecting sensor is exposed to the gas of interest; the compensating sensor is enclosed in a sealed compartment filled with clean air. Exposure to the gas sample causes the detecting sensor to cool, changing the electrical resistance. This change is proportional to the gas concentration. The compensating sensor is used to verify that the temperature change is caused by the gas of interest and not ambient temperature or other factors. As discussed above, the collections were done during the dry and wet seasons. Dry season is a period where there is little or no rainfall while wet season is characterized by rainfall.
3. Results and Discussion
The mean seasonal variations of CO and NO2 concentrations across the locations were as shown in Figures 2 and 3 respectively. The results showed highest concentration of CO and NO2 in dry season.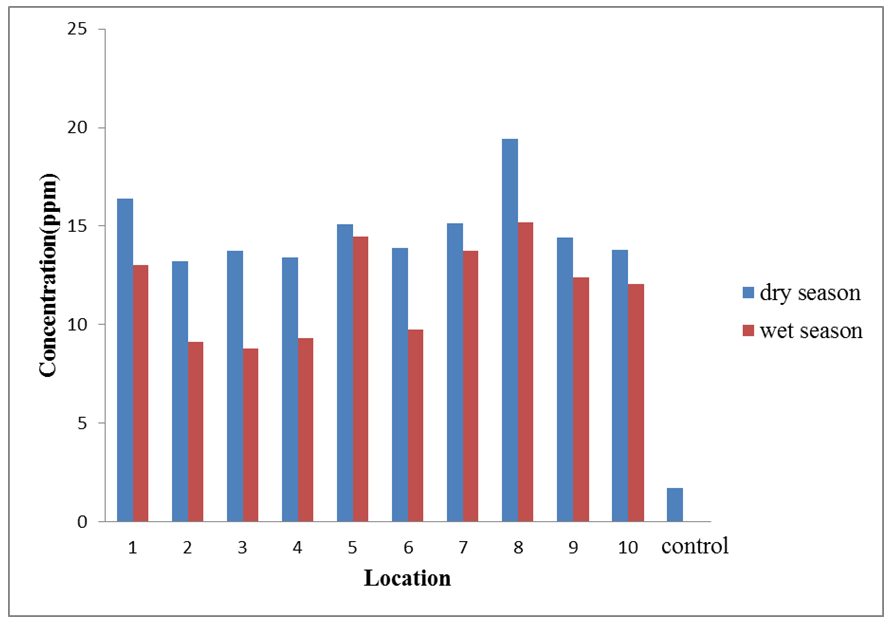 | Figure 2. Mean Seasonal Variation of CO across the sampling locations |
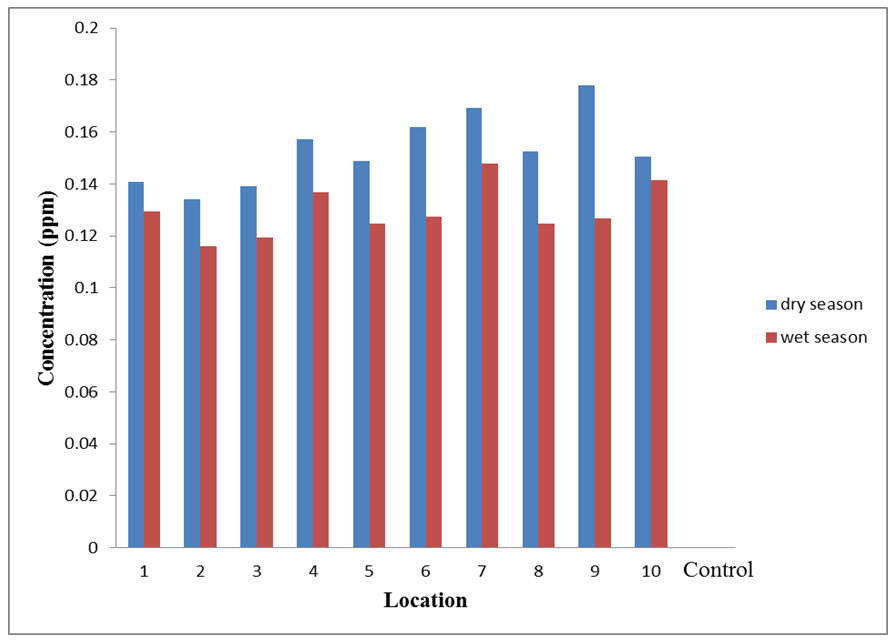 | Figure 3. Mean seasonal variation of NO2 across the sampling locations |
Figure 2 shows a result of CO, seasonal average ranged from 13.0 – 16.4 ppm for location 1, 9.13 – 13.73 ppm for location 2, 8.82 – 13.73 ppm for location 3, 9.4 – 13.4 ppm for location 4, 14.60 – 15.06 ppm for location 5, 9.73 – 13.86 ppm for location 6, 13.73 – 15.13 ppm for location 7, 15.2 – 19.41 ppm for location 8, 12.4 – 14.4 ppm for location 9, 12.0 – 13.80 ppm for location 10 and 0.01 – 1.70 ppm for control location. Highest concentration of CO (19.41 ppm) was observed at location 8 during the dry season. While that of wet season was 15.00 ppm.Figure 3 shows the result of NO2, whose seasonal average ranged between 0.129 – 0.140 ppm for location 1, 0.116 – 0.134 ppm for location 2, 0.119 – 0.139 ppm for location 3, 0.136 – 0.156 ppm for location 4, 0.124 – 0.148 ppm for location 5, 0.127 – 0.172 ppm for location 6, 0.147 – 0.179 ppm for location 7, 0.124 – 0.182 ppm for location 8, 0.126 – 0.158 ppm for location 9, 0.141 – 0.150 ppm for location 10, Similar to H2S and SO2, NO2 was not detected at the control location. The highest concentration of NO2 (0.158 ppm) was observed during dry season at location 9, while that of wet season (0.179 ppm) was at location 7.From the results obtained, the concentrations of gaseous pollutants in the dry season were found to be higher than the concentrations in the wet season. The high values in the dry season may be attributed to the temperature inversion, wind speed, wind direction, heat and low relative humidity. Temperature inversion limits the vertical circulation of air which result in air stagnation and trapping of gaseous pollutant in those locations. The low water content of air which is the humidity is also responsible for the high level of pollutant in dry season. However slow wind condition in the dry season give rise to build up high concentration of pollutant.The t-test for difference in mean (pair wise comparison) between the wet and dry season showed that the level of CO, between them was statistically significant p < 0.05. That is collaborated by the CO mean level of 11.79 ± 2.37 ppm for wet season, as against 14.84 ± 1.87 ppm for dry season which be due to less wind, and air ventilation in the North-East. Traffic emissions may have a higher impact (contribution) to CO. Also heavy rainfalls scavenge the atmospheric pollutants, emitted from natural and anthropogenic sources [11]. From the result obtained for carbon monoxide, highest concentrations of CO were recorded in dry season at all location, with the highest of 19.4 ± 0.50 ppm at location 8. This may be due to high traffic congestion since it is located at the main town market serving as a last bus stop for buses, tricycles “kekenapep” and taxies leading to every streets within the city, there by experiencing high traffic especially during the morning and evening hours. The mean atmospheric CO, when compared with values reported in literature were found, to be lower than range of 233–317 ppm reported in three cities of Nigeria: Lagos, Ibadan and Ado-Ekiti [12]. Also, the values reported in this study were lower than a report of atmospheric concentration of urban air pollutants in Kano, Nigeria [13]. However the values in this report were higher than the limit value of 10 ppm set by FEPA for carbon monoxide. The amounts CO showed that locations 2, 3, 4, 6 and 10 were unhealthy (above 150 < 200), while locations 1, 5, 7, 8, and 9 were very unhealthy (above 200 < 250) during the dry season. But in wet season, locations 2, 3, 4, and 5 are in moderate condition (above 51 < 100). This may be due to less activities, which may not enhance air pollutant, while in locations 1,7,9 and 10 are in unhealthy condition (above 101 <150). However location, 5 and 8 are in a very high unhealthy condition this may be due to higher activities, vehicle emission, and higher activities in those areas.Generally, condition of the air during morning and evening hours shows poor air quality. This indicates that exposure to high CO in the locations may form carboxyhaemoglobin (COHb) complex that may reduce the oxygen carrying capacity of the blood so that less oxygen may be distributed within the body organs, especially the brain, leading to various physical disabilities [4]. Meanwhile, from the results, highest levels of NO2 were obtained in all the locations during dry season without an exception, highest level of NO2 with 0.178 ± 0.007 ppm was observed at location 9 and the lowest of 0.11 ± 0.005 ppm at location 2. The highest, level of NO2 recorded at location 9 may be due to high fluxes of heavy trucks (diesel engine vehicles) aviation emission, industrial processes from industries located at Kofare industrial estate such as Adamawa beverages. Generally, the levels of NO2 were maximal in the afternoon-evening hours. This is most likely due to high vehicular density, traffic congestion and stationary combustion emission from running of generator as observed during the sampling. This is very common within the Metropolis due to erratic power supply. Never the less when the levels of NO2 were compared with values reported in literatures, NO2 was found lower than 0.2 – 1.08 ppm reported in Kano, Nigeria [14], and 0.20 – 0.52 ppm reported for Calabar Metropolis, Nigeria [15] but quite high when compared with 0.043 –0.078 ppm reported for Aba metropolis Nigeria [16]. This may be due to higher population activities, higher emission by trucks around those locations. However the level of NO2 was significantly higher than the limits set by FEPA (1991) and WHO of 0.04 – 0.06 ppm respectively [17]. Also, the level of NO2 we have observed in this study shows that, in both dry and wet seasons, all locations were in moderate condition except for locations 6, 7, 8, and 9 where it was unhealthy (above 100 < 150). The reason may be due to high heavy trucks emissions, air flight, and gasoline engine around those areas.Nitrogen dioxide is one of the most active photochemical species and is an essential participant in the smog formation process. The levels of nitrogen dioxide obtained in this study can combine with oxygen and water vapour to form acid rain. In combination with hydrocarbon in the atmosphere, oxide of nitrogen may form photochemical oxidants, which irritate the eyes and respiratory tracts and effect human health [18]. Higher temperature as observed in Yola during the dry season (typical of a tropical region), may be due to the presence of River Benue located within the metropolitan, where by land and sea breeze bring about the emission of excessive heat, thereby making the environment very hot. Also Yola is in a basement (valley), where by covering confluence of the air before it reaches the habitats.
4. Conclusions
The results indicate that the concentrations of CO and NO2 at some locations were above Air quality index (AQI) limits set by Federal Environmental Protection Agency (1991). This implies that, ambient air quality within Jimeta/Yola metropolis was poor. Humans, animals and plants are expose to high level of these pollutants which may be of potential health risk. In order to improve the current air quality of Jimeta/Yola Metropolis, the existing air quality monitoring programmes should be re-examined and new ones should be introduced to determine the most effective means of improving the air quality.
References
| [1] | Satoshi, N. and Eldred, T.T. (2012). Monitoring the levels of toxic air pollutants in the ambient air of Freetown, Sierra Leone. African Journal of Environmental Science and Technology, 6(7): 283-292. |
| [2] | USEPA (2016). Air Quality Index status: A guide to air quality and your health. United States Environmental Protection Agency. http://www.epa.gov/airtrends/sulphur/html. 1-16. |
| [3] | Dara, S.S. (2000). Textbook of Environmental Chemistry and Pollution Control, S. Chad Co. Ltd, New Delhi. |
| [4] | Ayodele, J. T. and Abubakar, F. (2010). “Sulphur dioxide as indoor pollutant in Kano Municipality Kano-Nigeria”, Journal of Environmental Chemistry and Ecotoxicology, 2(1): 9–13. |
| [5] | Zhao, Y., Duan, L., Xing, J., Larssen, T., Nielsen, C. P., and Hao, M. (2009). Soil acidification in China: Is controlling SO2 emissions enough. Environmental Science Technology. 43: 8021–8026. |
| [6] | Oguntoke, O. and Yusuf, A. S. (2008). Air pollution arising from vehicular emissions and the associated human health problems in Abeokuta metropolis. Nigeria Assessment Series, 8(2): 119-13. |
| [7] | WHO (2006). WHO Air Quality and hearth, fact sheet No. 313, WHO Media Center. |
| [8] | Han, X. and Naeher, L. P. (2006). A review of traffic-related air pollution exposure assessment studies in the developing world. Environmental International. 32: 106 – 120. |
| [9] | Varon, J., Marik, E., Fromm, E., Gueler, A. (1999). Carbon monoxide poisoning: a review for clinicians. The Journal of Emergency Medicine. 17: 87-93. |
| [10] | Hazardous Substances Data Bank (HSDB) (2005). Nitrogen Dioxide, Toxnet, National Library of Medicine, National Institutes of health, available at http://toxnet.nlm.nih.gov/cgibin/sis/htmlgen2005. Accessed online on 26th October, 2017. |
| [11] | NADP (1992). National Annual Data Summary of Precipitation Chemistry in the United States: 1-20. |
| [12] | Koku, C.A. and B.A. Osuntogun (1999). Environmental impacts of Road Transportation in South-Western States of Nigeria. Journal Applied of Science, 7(16): 2353–2360. |
| [13] | Okunola, O. J., Uzairu, A., Gimba, C. E. and Kagbu, J. A. (2011). Metals in roadside soils of different grain size from high traffic roads in Kano metropolis, Nigeria, Toxicology and Environmental Chemistry, 93(8): 1572 – 1590. |
| [14] | Okunola, O.J., Uzairu, A., Gimba C.E. and Ndukwe, G.I. (2012). Assessment of gaseous pollutants along high traffic roads in Kano, Nigeria. International Journal of Environment and Sustainability, 1(1): 7-11. |
| [15] | Okafor, P.C., Ekpe, U.I., Ibok, U.J., Ekpo, B.O., Ebenso, E.E, and Obadimu, C.O. (2009). Atmospheric Corrosion of mild Steel in the Niger Delta Region of Nigeria. Part 1; characterization of the Calabar, Cross River State Environment. Global Journal of Environmental Science, 8(1): 9-18. |
| [16] | Ideriah, T.J.K., Braide, S.A, Fekarurhobo, G. Oruambo, I. (2001). Determination of suspended particulate matter in Sourth-Eastern Nigeria. Ghana Journal of Science, 41: 23-27. |
| [17] | FEPA (1991). Guidelines and standards for environmental pollution control in Nigeria. Federal Environmental Protection, Agency Press, Lagos, Nigeria. |
| [18] | Gobo, A. E. (2012). Assessment of air quality and noise around Okrika communities, Rivers State, Nigeria. Journals of Applied Science Environmental Management.16: 75-83. |

 Abstract
 Reference
 Full-Text PDF
 Full-text HTML