Daekyoum Kim
Kwongmyoung-si Neobudae-ro, 32 Beon-kil, South Korea
Correspondence to: Daekyoum Kim, Kwongmyoung-si Neobudae-ro, 32 Beon-kil, South Korea.
| Email: |  |
Copyright © 2017 Scientific & Academic Publishing. All Rights Reserved.
This work is licensed under the Creative Commons Attribution International License (CC BY).
http://creativecommons.org/licenses/by/4.0/

Abstract
During studying the heat capacity of metals and brightening more than the original Lena’s image, we realize that the temperature increasing term obtained binomial expansion is used in the adsorption increasing term  and we could derive the total adsorption isotherm equation with it. In the first layer the quantization does not occur and from
  to
to  layer the quantization occurs. So as to get the total adsorption isotherm equation we add the quantized terms of the second to
  layers to the non-quantized term of the first layer. All terms are based on the unit surface sites. Hence the adsorption equations are derived much better than BET equation. The surface area is calculated through the integration of the adsorption isotherm equation from the inflection point to the wanted relative pressure.
Keywords:
Refined BET, Binomial, Transforming, Adsorption Increasing Term, Surface Area, Inflection Point
Cite this paper: Daekyoum Kim, Better Refined Adsorption Isotherm than BET Equation, Advances in Analytical Chemistry, Vol. 7 No. 1, 2017, pp. 13-21. doi: 10.5923/j.aac.20170701.03.
1. Introduction
We derived the heat capacity equations of metals and then used consistent step multiplication of the appropriate binomial equations [1]. They are fitted to experimental data well [2]. The heat capacity equation (type V) and the adsorption equation (type II) draw sigmoid (S character) lines all together. And they are symmetry each other. The measurement gas of heat capacity is hydrogen or helium. The adsorption gases are water or nitrogen. The movements of their measurement gases are different. The former is expansion and the later contraction. The most important term in the derivation of heat capacity equation was the temperature increasing term,  . In case of adsorption it becomes
  of the same form. Here
  and
and  are the total molecules at the layers of
  and
and  . Let us put
  which is unit
  in data fitting as the constant. It is a testing constant. If
  is transformed into
  power of
  in every derivation of adsorption such as
 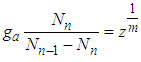 [3], the more advanced adsorption equation than BET eq. comes out.
2. Statistical Modeling of Adsorption Isotherm
Suppose each level has one binomial equation for excitation and non-excitation. And suppose  molecules are excited on
  localized sites of the unit surface layer and
 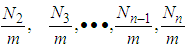 molecules on
  to
to  sites of the layers in sequence. Here m means quantization. The first adsorption layer has
  adsorption energy and. the second to
  layer
layer  . Hence the adsorption probability over the first layer is
 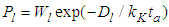 and the non-adsorption probability
 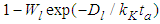 . In the above
  is the adsorption constant of the first adsorption layer.
  is similar to
  in heat capacity equation. The adsorption constant,
  is calculable quantity. It is the expression to combine the rotation and vibration energy of the adsorbed molecules in the first layer.
  [2] is similar to
  (Boltzmann’s constant). In the combination calculation of the first layer
  can take the values of from 0 to
  as variables in sequence. Then the binomial equation of the first layer becomes [1]
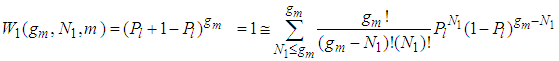 | (1) |
Next the adsorption probability of  to
to  layers is
 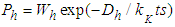 and then the non-adsorption probability
 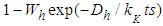 . The constants of these are the same as those of
  layer in the above. The binomial expansion equations for
  to
to  layers are
 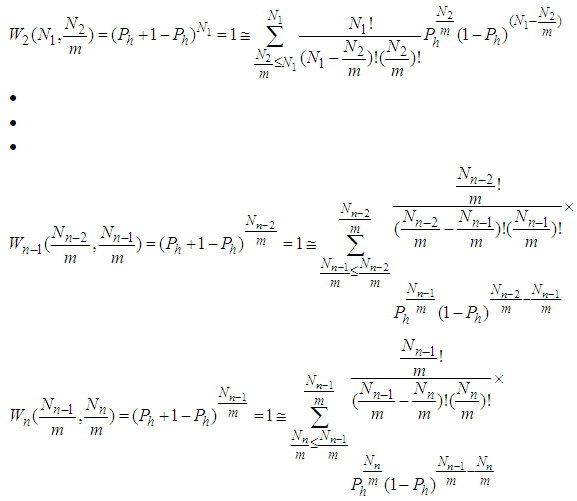 | (2) |
Let us multiply (1) and (2) side by side. Then for 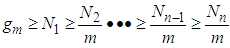
 | (3) |
In the above 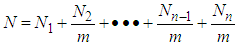 | (3.1) |
In Eq. (3) the largest term dominates the equation. So the total differential of Eq. (3) becomes the zero which requires that the coefficients of all terms should be zero. Hence by using Stirling’s approximation we solve the equation,  . The first differential equation of Eq (3) becomes
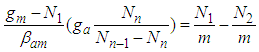 | (4) |
In the above equations m is quantization constant. In the reference [4] m value should be corrected as those in the present figure [Fig. 1]. The constants have three parts of 
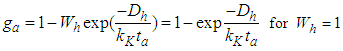
 As we see in Fig. 1, bonding constant mean quantization. If
  bonding occurs in many directions. If
  no quantization occur and if
  the adsorptions are interrupted in many directions. In Eq. (4)
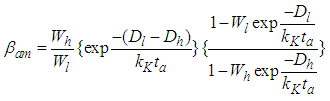 | (4.1) |
 | (4.2) |
It is possible that  is put as unit.The next equations are
 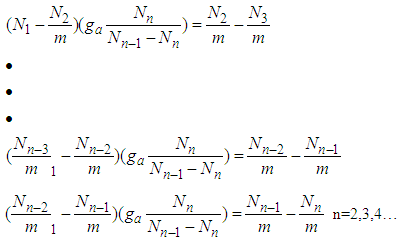 | (5) |
In Eqs (4) and (5) let us put 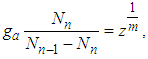 then
then  which is same as Eq. (9) of the reference [5] solved by using the chemical potential
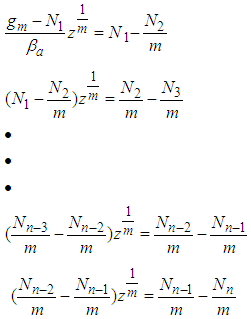 | (6) |
In Eq. (6) add side by side and rearrange 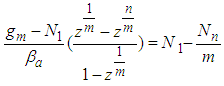 | (7) |
In Eq. (6) multiple side by side and rearrange 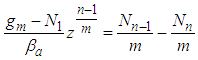 | (8) |
We solve Eq. (8) with 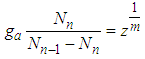 in order to eliminate
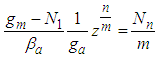 | (9) |
We solve Eq. (7) with Eq. (9) in order to eliminate 
 | (10) |
Eq. (10) represents the adsorption amount of the first layer. It is Langmuir equation. The quantization values (m) and the numbers of the adsorption layer (n) are influential on the determination of  . All values of the parameters
  directly participate in the determination of
  and following
  . The value of
  is much influential on the determination of the last term (
 ). But it does not much increase or decrease of
  since it exists in the denominator and nominator. At
  it becomes
 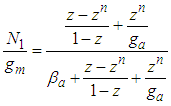 | (11) |
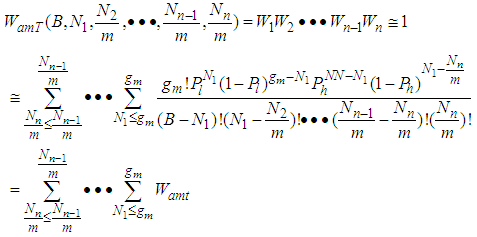
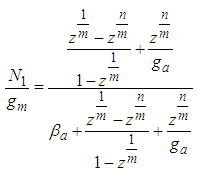
Therefore the total adsorption amount per unit surface  that is, the adsorption isotherm for from first layer to the last (n) layer becomes by using Eqs (6) and (10) as follows
 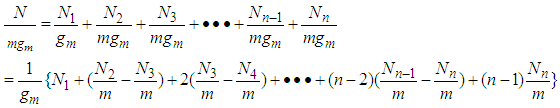 | (12) |
If  is eliminated in Eq (12)
  becomes as follows
 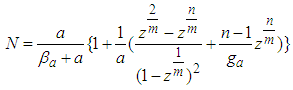 | (12.1) |
If  is a linear function of four variables. In the above
 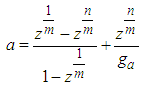 | (12.2) |
And the total adsorption rate is a linear function of z made of four constants 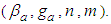 The equation draws BET-like lines and fits BET type experimental data well. At
  it becomes
  | (13) |
In the above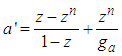 | (13.1) |
If the measurement gas is nitrogen, the general empirical formulae, 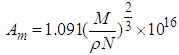 is introduced into.
 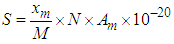 to get the specific surface area of the adsorbent,
  [6]. Then
  is the molecular weight of nitrogen and
  density of nitrogen and
  Avogadro number, Hence from empirical formulae
 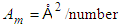 is used. The monolayer capacity,
  should also be substituted by the value of the integration of Eq. (12) subtracted by the surface adsorption isotherm
3. Result and Discussion
The base of Eq. (10) and Eq. (12) is  So we may use the word, the rate without the dimensionless analysis. It affects the equation totally. Fig. 2 shows the total adsorption rate according to the values of
  . In accordance with the values of z approaching units, the total adsorption rates approach closely with one another. This seems to mean that the adsorption heat of the first layer is same as those of
  layers. We call m the quantization values. It seems to have same notion as the quantization appears in quantum mechanism. We are dealing statistical quantization which should exist in statistics. We can differentiate them, three cases.
  and
and  The cases of
  explain bonding and
  explains existence of the interruptions for bonding. Fig 3 explains the increase of the adsorption rate according to m values. Less m than unit seem to interrupt the bonding. Fig. 4 represents the total adsorption rates according to n values. At less z than 0.5 the isotherms show the same adsorption rates. The constant
  showed in Fig 5 should be positive. When
  the constants draw the type II isotherm. At
  the same types of the isotherm appear.
  can include greater values than or equal unit.
  seems to be best. Fig. 6 shows
  with respect to the relative pressure like Langmuir’s lines which can’t become unit even if a is very large or
  much smaller. The parameter values of Fig. 2 come from the following Fig. 7 and Fig. 8. According to the above variations we optimized two kinds of the experimental adsorption data showed in Figs. 7 [6] and 8 [7] using trial and error method. The experimental data of Fig. 7 are obtained from the Figure 2-10 of the reference [6]. The experimental data are fitted to Eq. (12) well. As we see in Figs 7 and 8, BET isotherm can’t imitate the experimental data except for beginning. What is the catalyst? As we see Fig. 9 in the above, 1, 2, 3, 4, 5, 6 and 7 molecules can function as the catalyst. That is, the molecules of the surface adsorption layer can’t function like the catalyst. Because they use much energy in order to hold the surface. So they are not active. The molecules which lie on the surface layer adsorption molecules which hold the surface, can function as the real catalyst. Therefore in Eq. (12),
  part must work in the catalytic reaction. Hence the real adsorption equation becomes
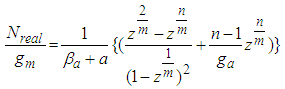 | (14) |
If this equation is integrated from the inflection point  to each optional relative pressure
  we get the mono-area capacity
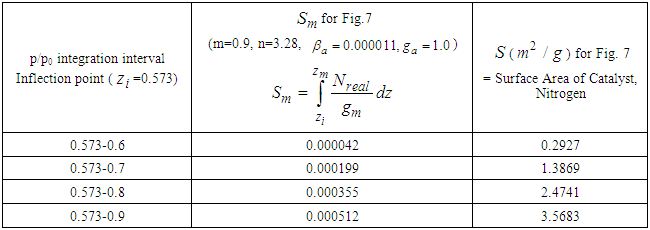
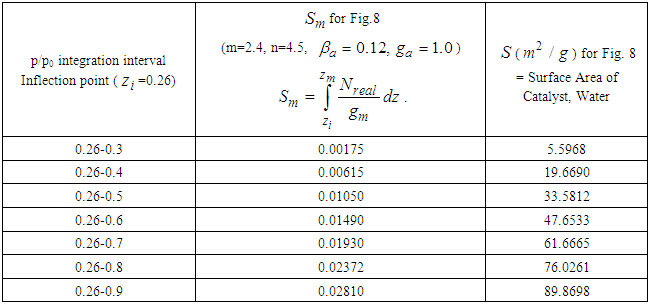
  with respect to the relative pressure (p/p0). Tables 1 and 2 include those. Then the surface area for the catalyst obtained from the equation becomes
 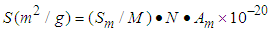 with
with  per number for nitrogen and
  per number for water (Table 2) [6] by substituting
  . in the equation of (2.60) of the reference [6] by
 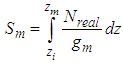 in which
  =inflection point and
  =optional z value after the inflection point. In the above equation
  is the molecular weight (g) per g-mole and
  Avogadro number per g-mole.
Table 1. Sm (mono-area capacity) and S (surface area) for Fig. 7
 |
| |
|
Table 2. Sm (mono-area capacity) and S (surface area) for Fig. 8
 |
| |
|
Then the inflection points are obtained by Secant method [8] through the program showed in Appendix 1. Specific surface areas are changed according to the optional relative pressures. These are showed in Tables 1 and 2 precisely. The integrations with respect to z surface values give the total adsorption site numbers of the adsorbate. Before the inflection point the specific surface area of the adsorbent is not counted as a catalyst since it makes the strong surface film [9]. The adsorption rate increases consistently after the inflection point. The values of n of Fig. 7 and Fig. 8 match the range of the reference of BET [10]. The completion of  to unit goes with the completion of N to the end as we see in Fig. 6 and its equation. But from the inflection point the pilling up of
  may begin characteristically. Eq. (13) can be used in the data fitting with
  and
and  . Its quality is poor.Our study have realized the saying that “After considerable work on the theory, Hill (1946) formed the opinion that any future improvement on it must be in the form of refinement rather than a modification on the basic theory” [11, 12].
4. Conclusions
The total adsorption rate equations closely related with the past references are derived correctly and the figures according to four constants  are also considered to describe BET-like figures (II) well. The quantization constants are useful in deriving the adsorption equations. In order to calculate the surface area of the catalysts the total adsorption equations excluding the first layer adsorption equation and their inflection points obtained are used appropriately. They fit the experimental data well.
ACKNOWLEDGEMENTS
The author thanks for the challenging encouragements of Yongduk Kim, an emeritus professor of Sogang University. And the author thanks for helping the manuscript arrangement of Jones Cathy (http://www.sapub.org/), USA.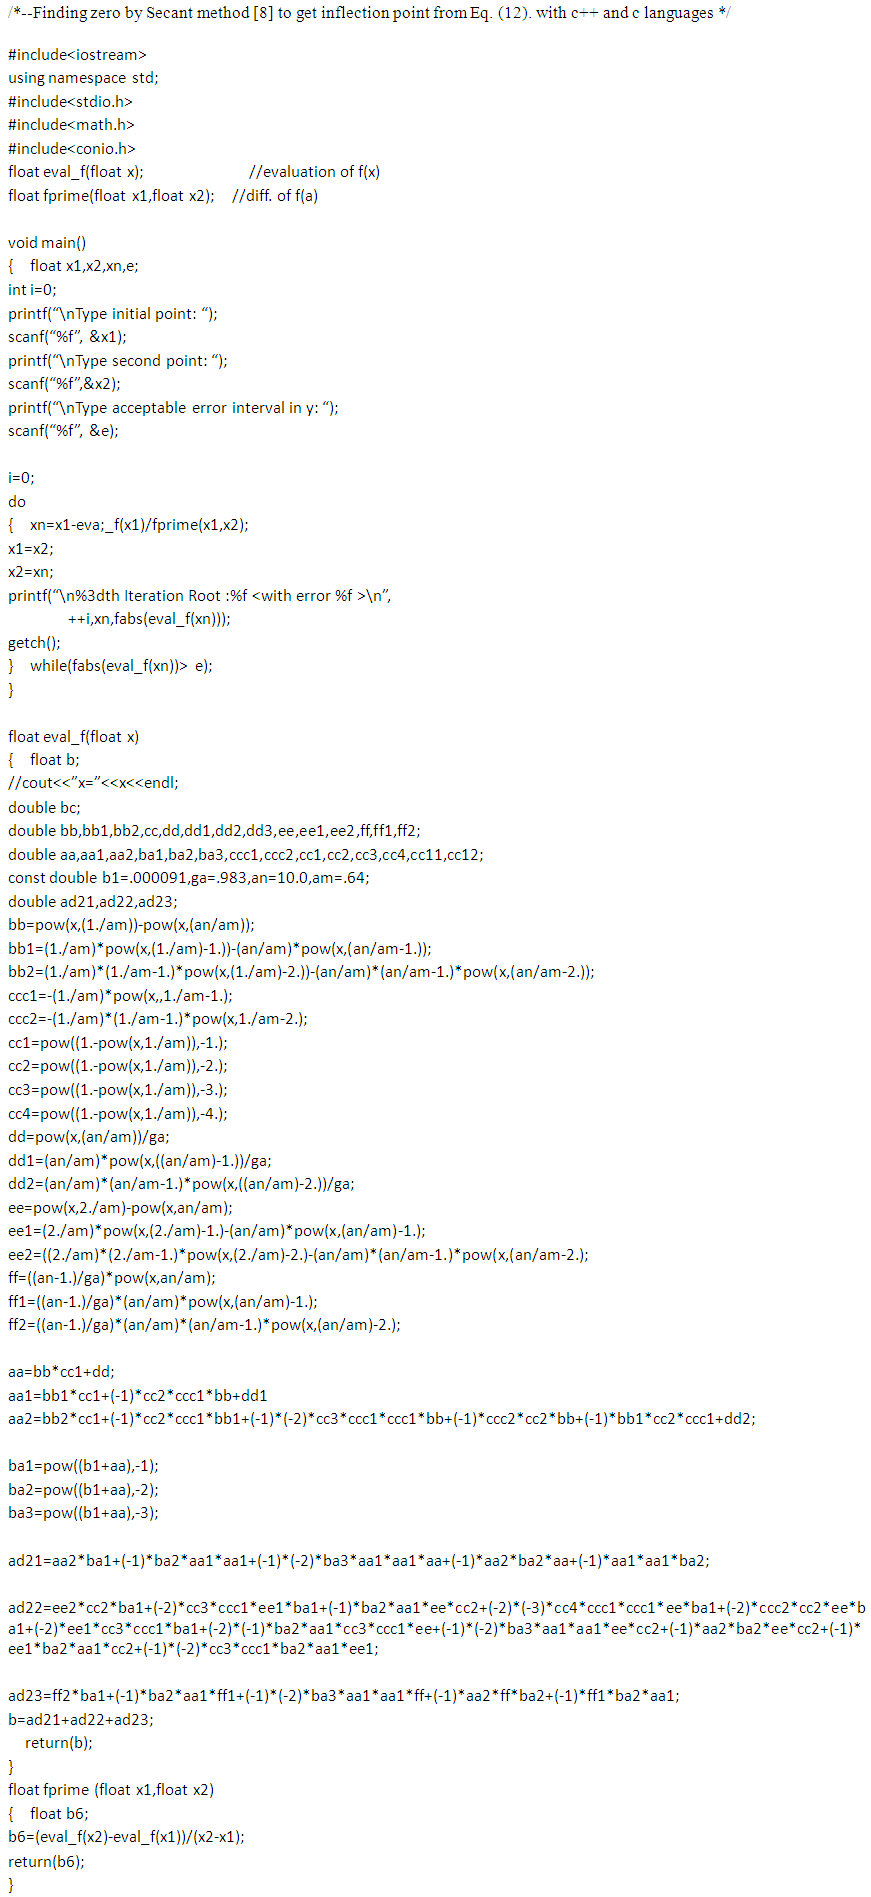 | Appendix 1 |
References
| [1] | F. Reif, Fundamentals of statistical and thermal physics, (McGraw-Hill Inc Ed. 1965), Chapter 1. pp. 10-46 (2015). |
| [2] | Kim D. et. al, New Physics: Sae Mulli (The Korean Physical Society), Volume 60, Number 7, pp 729(2010). |
| [3] | John H. Mathews and Russell W. Howell, Complex Analysis for Mathematics and Engineering, 4th ed., Jones and Bartlett Publishers, Inc., pp 62 (2001). |
| [4] | Kim D., Korean J. of Chem. Eng. 17(5), pp 600 (2000). |
| [5] | Kim D. and Choi Y. S. New Physics: Sae Mulli (The Korean Physical Society), Volume 61, Number 3, pp 248 (2011). |
| [6] | Gregg, S. J. and Sing, K. S. W., Adorption, Surface area and Porosity, Academic Press Inc.(Ltd.), Chapter 2, pp 53 (1969). |
| [7] | Benson R. Sundheim, M onroe H. Waxman and Harry P. Gregor, J Phys Chem. Vol. 57, pp 974 (1953). |
| [8] | C-ro- guhyouhan Numerical Analysis(Korean Language), Ji, Youngjun, Kim, Hoajun, and Heo Jeongguin, Nopi-gipi publishing Company pp. 24 (2002). |
| [9] | George Jura and William D. Harkins, J. Amer. Chem. Soc. 67, 1356(1944). |
| [10] | Stephen Brunauer, P. H. Emmett and Edward Teller, J. of Amer. Chem. Soc., Vol > 90, pp. 309 (1938). |
| [11] | Caurie, M., J. Food Sci (The Year after 1979). |
| [12] | Caurie, M., J. Food Sci. (the year after 1979), 63. |

 Abstract
 Reference
 Full-Text PDF
 Full-text HTML