Isam Eldin Hussein Elgailani, Mohammed M. Alsakka
Department of Chemistry, Faculty of Sciences and Arts at Baljurashi, Albaha University, Albaha, Saudi Arabia
Correspondence to: Isam Eldin Hussein Elgailani, Department of Chemistry, Faculty of Sciences and Arts at Baljurashi, Albaha University, Albaha, Saudi Arabia.
| Email: |  |
Copyright © 2016 Scientific & Academic Publishing. All Rights Reserved.
This work is licensed under the Creative Commons Attribution International License (CC BY).
http://creativecommons.org/licenses/by/4.0/

Abstract
A validated, simple, accurate and precise spectrophotometric method has been proposed for the determination of iron in hemoglobin in human blood. The method is based on the reaction of iron with ammonium thiocyanate after the wet digestion of the blood samples with HNO3 and H2O2. The optimum experimental conditions have been studied carefully. The absorption maxima was occurred at 475 nm and molar absorptivity of 0.03602 L mol-1cm-1. The linear regression line was obtained in the range of 0.5 - 60 μg/mL for iron content in hemoglobin. The detection limit and the limit of quantification were found to be 0.0583 and 0.1768 μg/mL respectively for the iron, and with R2 value of 0.998. And recovery in range of 98.42 - 99.72%. Effects of pH, temperature, standing time and thiocyanate concentration on the determination of iron in human hemoglobin have been examined.
Keywords:
Iron, Hemoglobin, Determination, UV spectrophotometer
Cite this paper: Isam Eldin Hussein Elgailani, Mohammed M. Alsakka, Determination of Iron Content in Different Hemoglobin Samples from Some Patients by UV-Visible Spectrophotometer, Advances in Analytical Chemistry, Vol. 6 No. 2, 2016, pp. 35-40. doi: 10.5923/j.aac.20160602.01.
1. Introduction
Iron is a fundamental element for human and animals. Iron exists in the living body as ferritin and hemosiderin which are considered to be proteins containing iron [1]. Iron participates in a wide variety of metabolic processes, including oxygen transport, DNA synthesis, and electron transport. About 70% of the body's iron is bound to hemoglobin in red blood cells [2]. Iron deficiency is one of the leading risk factors for disability and death worldwide, affecting an estimate of two billion people [3]. Anemia and iron deficiency anemia must always be taken into consideration for they have a clear impact on the patient’s quality of life and they can be the consequence of severe diseases [4]. The literature shows various methods for determination of iron in blood and hemoglobin. Among these methods are colorimetric determination of iron and hemoglobin in blood which based on the comparison of the color of iron reacted with sulfocyanate [5] or using o-phenanthroline [6], spectrophotometric by the use of sodium hypochlorite solution [7]. Body iron can be quantitatively estimated by the method based on the ratio of the serum transferrin receptor to serum ferritin [8]. Atomic-absorption-spectrophotometric was used for iron determination in whole blood for the measurement of hemoglobin content by Lötterle [9]. Iron in hemoglobin also was determined by using atomic absorption spectroscopy [10]. In this work, a reliable and reproducible spectrophotometric method for the assay of iron content in hemoglobin in human blood, using thiocyanate as derivatizing agents after the samples were wet digested by nitric acid and hydrogen peroxide was reported.
2. Materials and Methods
2.1. Sampling and Area of the Study
15 blood samples of different hemoglobin content from some patients were brought from Baljurashi General Hospital, Saudi Arabia.
2.2. Chemicals and Apparatus
Chemicals reagents used in this work were of high analytical grade, and deionized water was used to prepare all solutions. All absorbance measurements were made with a double beam UV-VIS Spectrophotometer (SP- 3000 Plus model, Optima, Tokyo, Japan) ultraviolet-visible spectrophotometer provided with matched 1-cm quartz cells. A pH meter (model 3305, Jenway Ltd., United Kingdom) was used. Digital water bath (Model LWB-122D, Daihan Labtech Co. Ltd., Indonesia) was also used.
2.3. Preparation of Buffers and Standard Solutions
2.3.1. Preparation of Buffer Solutions
A series of different buffer solutions of pH ranged from 3 to 11 were prepared. A buffer solutions of pH 3.0 and 4.0 was prepared by mixing 0.2 M Acetic acid with 0.2 M sodium acetate, solutions of pH 5.0, 9.0, 10.0 and 11.0 were prepared by mixing 0.10 M Na2CO3 solution with 0.10 M NaHCO3 solution and solutions of pH 6.0, 7.0 and 8.0 were prepared by mixing 0.20 M NaH2PO4 solution with 0.20 M NaOH solution, each buffer solution was prepared in 100 mL volumetric flask and adjusted by a pH meter.
2.3.2. Preparation of Standard Ammonium Thioyanate Solution
It was prepared by dissolving an accurately weighed 40.0 g of NH4SCN in deionized water, then transferred into a 100 ml standard flask and diluted to the mark and thoroughly mixed to get 40% (w/v). Then a series of dilutions of this solution from 0.5 to 40% (w/v) were prepared in order to assign the best concentration for analysis.
2.3.3. Preparation of Stock and Standard Solutions of Iron
A stock solution of iron of concentration of 1000 μg/mL was prepared by dissolving an accurately 2.9045 g of FeCl3 in deionized water transferred into a 1000 mL volumetric flask and completed to the mark and thoroughly mixed. Then a series of standard solutions iron were prepared by dilution to get different concentrations ranged from 0.5- 75 μg/mL.
2.4. Job's Method for the Reaction of Iron and Thiocyanate
The Job’s method of continuous variation [11] was applied by taking equal concentration of each of prepared standard iron solution and NH4SCN and prepared in complementary attributions (10:0, 9:1, 8:2, 7:3, 6:4, 5:5, 4:6, 3:7, 2:8, 1:9, 0:10), and heated at temperature of 40°C to for 10 minutes.
2.5. Preparation of Standard Calibration Curve of Iron
Standard calibration curve of iron was established by graphing concentrations versus absorbance of iron standard solutions by taking 2 mL of each of standard solutions and put in a test tube, then 2 mL of buffer solution of pH 3.0 and 1 mL of 8.0% NH4SCN were added. This solution was heated at temperature of 40°C to for 10 minutes. The absorbance of this standard solutions were read at 475 nm against blank.
2.6. Digestion of Blood Samples for Analysis
Each of the 15 of blood samples were accurately taken as 1.0 mL for each sample (equivalent to 1.07 g), and then were digested by transferring them into a 100 mL calibrated beaker, and dissolved in about 6.0 mL of concentrated HNO3 and 2.0 ml of H2O2 and covered by watch glass. The contents of the beakers were heated 110°C in a hotplate for 30 minutes and then transferred to 25 mL volumetric flasks, and then completed to volume with deionized water. The contents were mixed well and filtered. The prepared solution was used to obtain a suitable concentration for the analysis.
3. Results and Discussion
3.1. Determination of the Absorption Spectra
The maximum absorption wavelength (λmax) for the products which obtained by the reaction of iron of prepared blood samples and (NH4SCN) occurred at 475 nm against the blank as in Figure 1.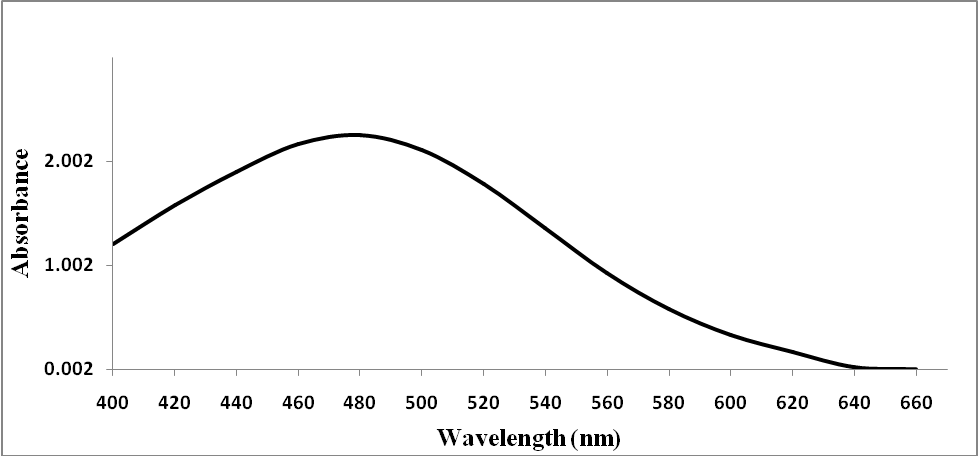 | Figure 1. The λmax of reaction of prepared blood sample (10 µg/mL) with (NH4SCN, 8.0% w/v) |
3.2. Determination of the Ideal Conditions of the Reaction Parameters of the Method
The ideal conditions for this method were determined by varying the reaction parameters and recording the influence on the absorbance. The reaction parameters studied were the effects of pH, volume of buffer, temperature, reaction time and SCN- concentration as shown in Figures 2-5. The ideal conditions for the reaction of prepared blood sample with NH4SCN with respect to pH, volume of buffer, temperature, reaction time and SCN- concentration were found to be 3.0, 2 ml, 40°C, 10 minutes and 8.0% respectively.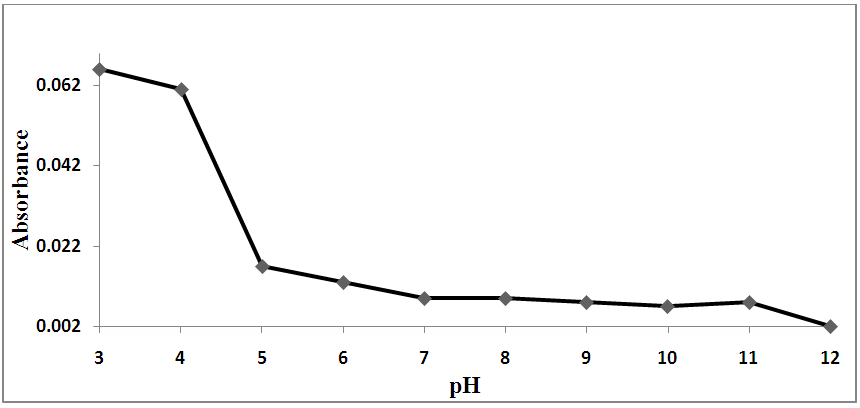 | Figure 2. Effect of pH on the reaction of standard iron solution with (NH4SCN) |
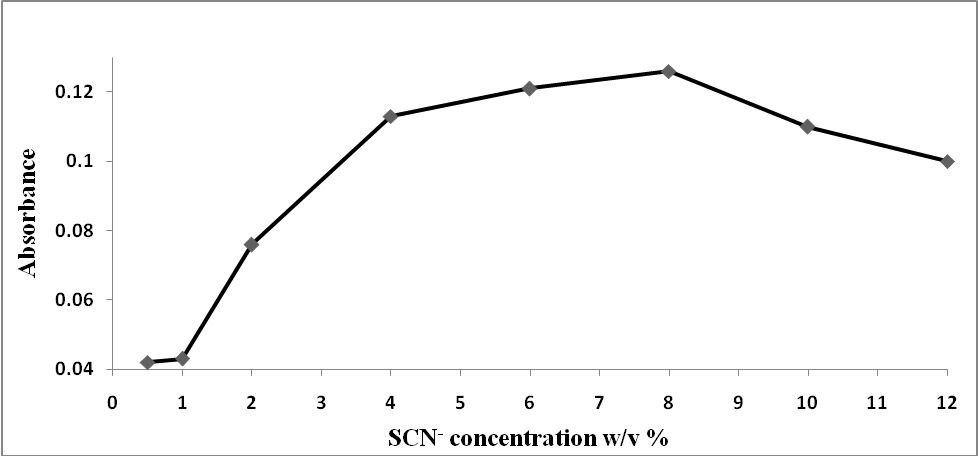 | Figure 3. Effect of (NH4SCN) concentrations on the reaction of prepared blood sample with (NH4SCN) |
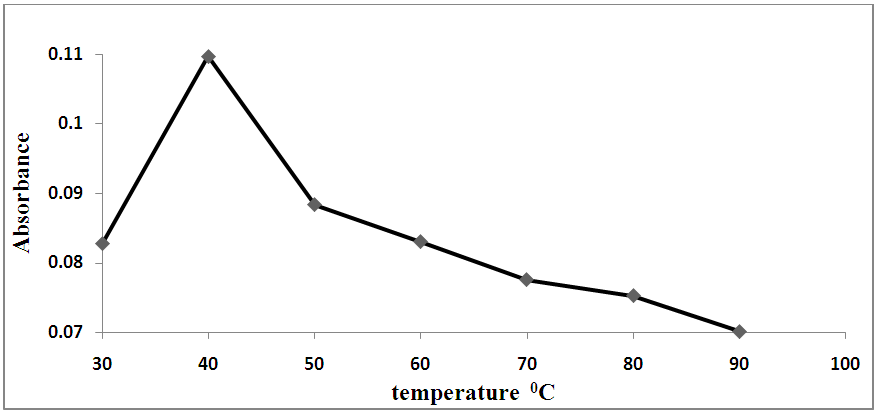 | Figure 4. Effect of temperature on the reaction of prepared blood sample with (NH4SCN) |
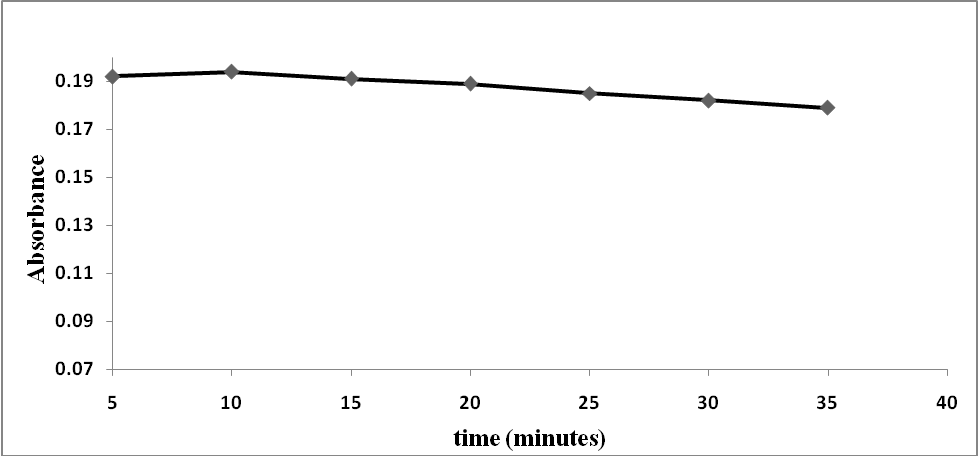 | Figure 5. Effect of the reaction time on the reaction of prepared blood sample with (NH4SCN) |
3.3. Determination of the Complexation of the Reaction by Job’s Method
The Job’s method of for the reaction under study was applied [11] as previously described. The shape of Job’s plot was obtained which indicate the complexation of the reaction of NH4SCN with iron of the prepared blood sample as seen in Figure 6 forming a red-brown complex product.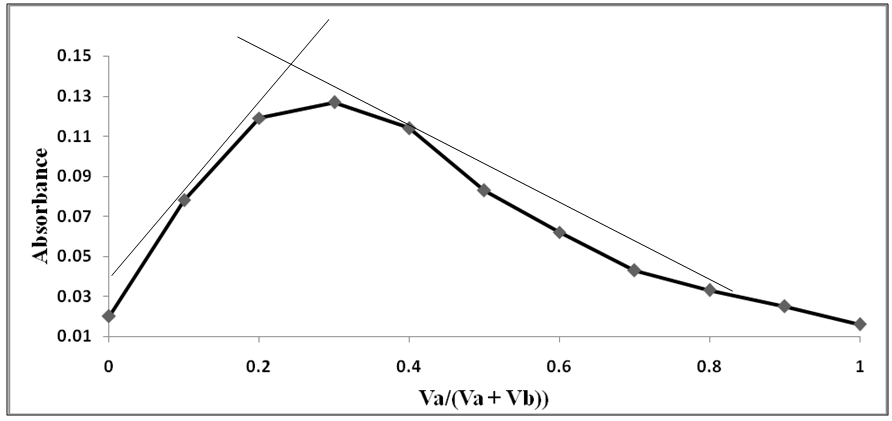 | Figure 6. Stoichiometry by Job’s method for (SCN-) with prepared blood samples: Va: (SCN-) and Vb: (iron of blood samples) |
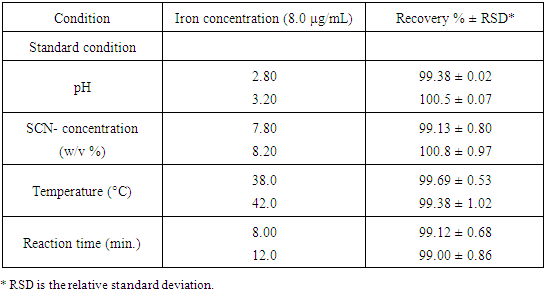
3.4. Method Validation
The validation parameters for this study were determined according to validation of analytical procedures guidelines described by International Conference of Harmonization [12]. Calibration curve for the determination of prepared blood sample and NH4SCN was established by graphing concentrations against absorbance as in Figure 7. Robustness of the method was carried out and it was seen that small differences in the method parameters did not significantly influence the procedures; the percent recoveries were seen in Table 1.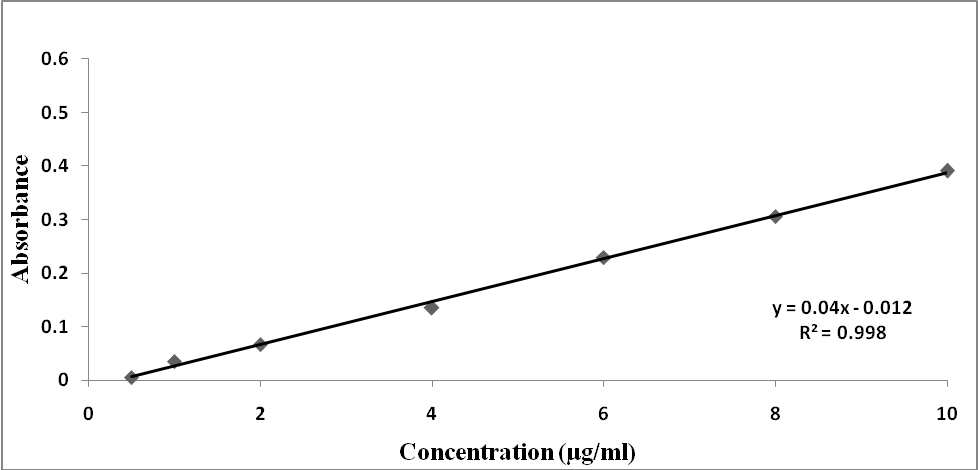 | Figure 7. Calibration curve for the determination of iron |
Table 1. Robustness of the spectrophotometric method for iron of Hemoglobin sample
 |
| |
|
The linear plots with R2 were obtained in the 0.5-60 μg/mL. The detection and quantification limits were calculated based on the standard deviation of the (n = 5, standard deviation = 0.000707) and the slope of the calibration curve. Results were summarized in Table 2.Table 2. The quantitative parameters and statistical data of the method
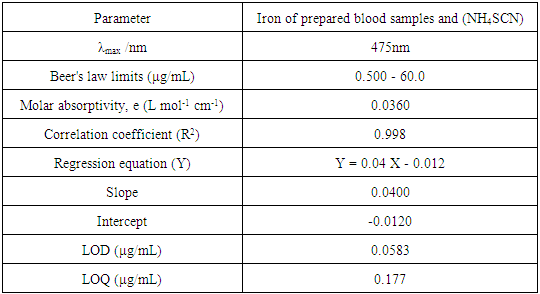 |
| |
|
Regarding the accuracy and precision of the method were evaluated by performing three replicate analyses on standard iron solutions at three different concentrations. The relative error (%) was 0.53- 1.45, and intraday precision expressed in relative standard deviation (RSD) (%) did not exceed 2% for the investigated samples, revealing the good accuracy and precision of the studied method. The results of this study are compiled in Table 3 and 4 reflecting the usefulness of this method in analysis of the 15 investigated blood samples in the laboratories as seen in Table 5. The good correlation between iron determination by this method and the amount of hemoglobin determined by Cell-Dyn instrument provides an accurate determination of the concentrations of hemoglobin in blood samples as shown in Table 5.Table 3. Determination of the accuracy and precision of the method
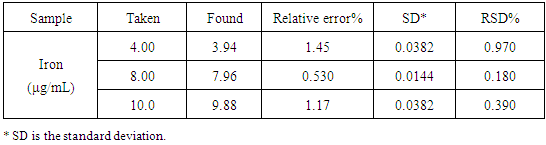 |
| |
|
Table 4. Determination of Interday and Intraday Accuracy
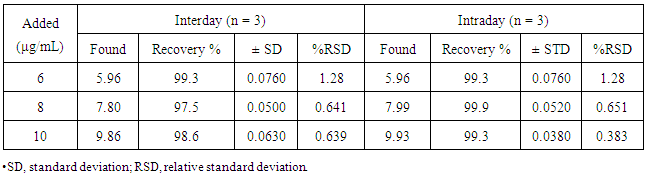 |
| |
|
Table 5. Determination of Iron of Hemoglobin samples
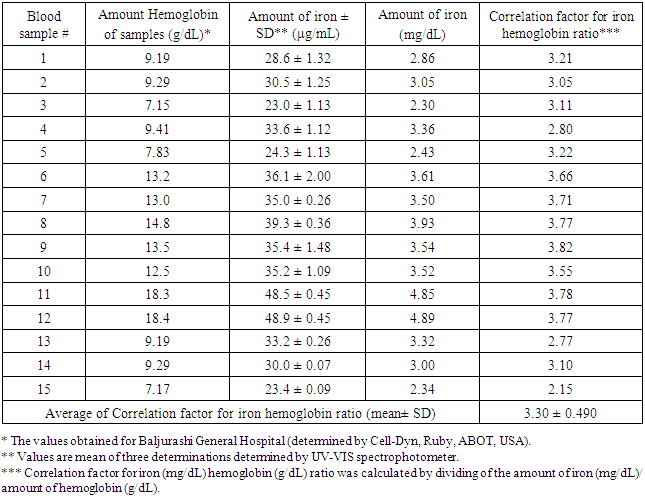 |
| |
|
The percent recoveries (n=3) were found to be in the range of 98.42 to 99.72% for the iron in Hemoglobin as in Table 6 which revealing good accuracies and non-interference chemical species.Table 6. Recovery of the method
 |
| |
|
4. Conclusions
The present study described the successful evaluation of ammonium thiocyanate reagent in the development of simple, sensitive, selective, accurate and reproducible spectrophotometric method for the accurately determination of iron in hemoglobin. The validated method is simple. Moreover, all the chemical reagents used are cheap and available in any chemical laboratory. The method involve the measurement of stable colored compound in a shorter times of the reaction. Therefore, the method is practical and useful for application in the laboratories for analysis of iron and hemoglobin in blood sample. Suggestions that could made for this study is that further investigations is necessary particularly for the strong correlation between the amount of iron content and the concentration of hemoglobin in blood sample which is very clearly in this work.
ACKNOWLEDGMENTS
Special thanks to the Department of Chemistry, Faculty of Science and Arts at Baljurashi, Albaha University where this evaluation and investigation have been carried out, for laboratory facilities and valuable assistance in the use of various equipments. Also thanks are extended to Baljurashi General Hospital, Saudi Arabia for their valuable assistance in providing blood sample.
References
| [1] | Saito, H. (2014). Metabolism of Iron Stores. Nagoya J. Med. Sci.76, 235-254. |
| [2] | Gupta, C. P. (2014). Role of Iron (Fe) in Body. IOSR Journal of Applied Chemistry 7, 38-46. |
| [3] | WHO. (2001). Iron Deficiency Anemia Assessment, Prevention and Control. A guide for programme managers. Geneva: Switzerland: World Health Organization WHO/ UNICEF/ UNU, p.114. |
| [4] | Tawfik, A. A., Hanna, E. T., and Abdel-Maksoud, A. M. (2015). Anemia and Iron Deficiency Anemia in Egypt. IOSR Journal Of Pharmacy 5, 30-34. |
| [5] | Wong, S. Y. (1923). Colorimetric determination of iron and hemoglobin in blood. J. Biol. Chem. 55, 421-425. |
| [6] | Katsumata, Y., Sato, K., Aoki, M., Suzuki, O., Oya, M., and Yada, S. (1982). A simple and accurate method for measurement of the hemoglobin content in blood by colorimetric iron determination. Z Rechtsmed 88, 27-30. |
| [7] | Connerty, H. V., and Briggs, A. R. (1962). New Method for the determination of whole-blood iron and hemoglobin. Clinical Chemistry 8, 151-157. |
| [8] | Cook, J. D., Flowers, C. H., and Skikne, B. S. (2003). The quantitative assessment of body iron. Blood 101, 3359-3364. |
| [9] | Lötterle, J. (1980). Measurement of the hemoglobin content of fresh blood by atomic-absorption- spectrophotometric iron determination. Z Rechtsmed 85, 283-288. |
| [10] | Zettner, A., and Mensch, A. H. (1967). The use of atomic absorption spectroscopy in hemoglobinometry. The American Journal of Clinical Pathology 48, 225-228. |
| [11] | Job P. (1928). Formation and stability of inorganic complexes in solution. Annali di Chimica Applicata 9, 113–203. |
| [12] | ICH Guideline (2005). Validation of Analytical Procedures: Text and Methodology, London, Q2 (R1). |

 Abstract
 Reference
 Full-Text PDF
 Full-text HTML