Abdullahi Usman1, 2, Vera Thoss2, Godfred Darko3, Adams Udoji Itodo4
1School of Chemistry, Bangor University, United Kingdom
2Department of Chemistry, Nasarawa State University, Keffi, Nigeria
3Department of Chemistry, Kwame Nkruma University of Science and Technology, Ghana
4Department of Chemistry, University of Agriculture, Makurdi, Nigeria
Correspondence to: Abdullahi Usman, School of Chemistry, Bangor University, United Kingdom.
| Email: |  |
Copyright © 2016 Scientific & Academic Publishing. All Rights Reserved.
This work is licensed under the Creative Commons Attribution International License (CC BY).
http://creativecommons.org/licenses/by/4.0/

Abstract
Trichilia emetica seed oil was analysed for fatty acid profiles using GC-MS and proton nuclear magnetic resonance spectroscopy (1H-NMR). The percentage triacylglycerol conversion to its corresponding methyl esters was determined by 1H NMR and was calculated to be 94%. A total of six FAMEs were identified in the seed oil by the NIST library match software and the fragmentation pattern data of GC/MS. The results obtained from the two methods were 55% saturated (C14:0, C16:0, C18:0), 35% monounsaturated (C18:1) and 10 % polyunsaturated (C18:2 and C18:3). Generally, the 1H-NMR results were in good agreement with gas chromatographic (GC) analyses. In conclusion, the 1H-NMR-based procedures is fast as it does not require the oil to be derivatized and can be applied to neat T. emetica seed oil.
Keywords:
Triacylglycerol, Transesterification, Fatty acid methyl esters, Saturated fatty acid
Cite this paper: Abdullahi Usman, Vera Thoss, Godfred Darko, Adams Udoji Itodo, Determination of Triacylglycerol Composition of Trichilia emetica Seed Oil Using GC-MS and 1H-NMR Spectroscopy, Advances in Analytical Chemistry, Vol. 6 No. 1, 2016, pp. 10-16. doi: 10.5923/j.aac.20160601.02.
1. Introduction
Fatty acids are the main constituent of vegetable oils, animal fats and their derivatives. The fatty acid profiles of oils and fats determined their application for physiological and industrial uses [1]. Hence, different techniques have been developed to analyze these profiles.Gas chromatography (GC) is the common method used for determining the fatty acid composition of vegetable oils, animal fats and their derivatives. This technique normally involved the conversion of oils or fats into their corresponding methyl esters before the analysis. And the method has been used by several authors to report the fatty acid composition of T. emetica seed oil [2, 3, 4, 5]. The nuclear magnetic resonance (NMR) Spectroscopic methods, on the other hand, allows the determination of a large number of components with very little or without the need to derivatized or manipulate the oil samples [1, 6]. The NMR spectra are obtained within a short time and it contained great amount of information that can be employed as a substitute to many classical analytical procedures. The different signals present in the NMR spectra provide two kind of information: the chemical shifts, which is of qualitative value and the relative intensities which are quantitative in nature [6, 7], the combination of this information, easily result in oil or fat been characterised. In fact, by using quantitative conditions, the results obtained by NMR are similar to GC [8]. NMR has been used for structural characterisation, as well as for authentication and quality assessment [9, 10]. 1H NMR is one of the spectroscopic techniques that have emerged as a valuable alternative for the qualitative and quantitative determination of food quality. Johnson and Shoolery in 1962, were the first to use this techniques to determine the degree of unsaturation and the average molecular weight in fat, and it has since expanded to include determination of iodine value [12], identification of vegetable oils as well as identifying individual vegetable oils in a mixture [13, 14]. The use of 1H NMR to quantitate individual fatty acid in lipids is difficult, due to the strong overlapping peaks in aliphatic region, but quantitating the degree of saturation and unsaturation can be achieved using appropriate peaks in the spectrum [15, 16]. This study describes the use of 1H-NMR spectroscopy to quantified saturated and unsaturated fatty acid composition in T. emetica seed oil. The result obtained, was verified using GC-MS of fatty acid methyl esters.
2. Experimental
2.1. Preparation of Sample
T. emetica seeds used in this study were collected from Kumasi-Ghana. The seeds were manually removed from the husks, spread out to dry at ambient temperature and stored in plastic container at room temperature until the beginning of the experiment.
2.2. Extraction of Seed Oil
T. emetica seeds (100 g) were flaked two times using Eschenfelder Seed and Grain Flaker 1200. The flaked seeds were stirred in hexane (7 × 200 cm3) at room temperature for 1 hour each. The extracts were combined, dried over MgSO4 and then filtered under gravity. The hexane was removed by rotary evaporator at 40°C to give golden yellow brown oil. The oil obtained was stored at room temperature until further analysis.
2.3. Trans-Esterification of the Oils
The method of Thoss et al., 2012 was used with modification. Trichilia emetica seeds oil (5g) was dissolved in sodium methoxide (0.5M, 40 ml) and heated under reflux for 30 minutes to produce fatty acid methyl esters (FAMEs). Deionised water (100 ml) was then added, and the solution extracted with hexane (100 ml × 3). The hexane fractions were combined, dried over MgSO4, filtered under gravity and the solvent removed using rotary evaporator at 40°C. The trans-esterified samples were diluted (1:1000) with hexane and analysed by gas chromatography-mass spectrometry (GC- MS).
2.4. GC-MS Method
The method of Thoss et al., 2012 was used with modification. The fatty acid methyl esters (FAMEs) contents of T. emetica seed oil were determined using Thermoquest Finnigan Trace GC 2000, with a Chrompack silica fused DB-5 column (L 25 m × ID 0.32 mm × DF 0.25µm). The carrier gas was nitrogen with a flow rate of 1.5 ml/min. The initial oven temperature was 150°C (held for 2 min), ramped at 5°C min-1 up to 250°C (held for 10 min). The phase transfer line temperature was held at 250°C. A sample volume of 1µl in hexane was injected using a split mode, with the split ratio of 1:10. The mass spectrum was collected on a Thermoquest Voyager Qp MS. Electron impact (70 eV) ionisation was used for fragmentation with a rate of 1 scan per second. Processing was carried out on Xcallibur v1.2, and each FAMEs contents of the oil sample was identified from the NIST library match software.
2.5. 1H-NMR Method
1H NMR spectrum was recorded on a Bruker BioSpin 400 MHz spectrometer at 400.13 MHz, equipped with 5 mm PABBO gradient probehead and using CDCl3 as solvent. The chemical shift (δ) is given in part per million (ppm) relative to tetramethylsilane (TMS) as an internal reference. Sample (10 mg) was run in CDCl3 at 294.7 K, with a relaxation time of 2.0 seconds. The spectra were processed and analysed using MestRestNova version 6.0.
2.6. 1H-NMR of T. emetica Seed Oil
The saturated fatty acid (SFA), monounsaturated fatty acid (MUFA) and polyunsaturated fatty acids (PUFA) content of T. emetica seed oil was calculated, using the integrals of different proton (X, Y or Z) environment (Fig. 1) [16].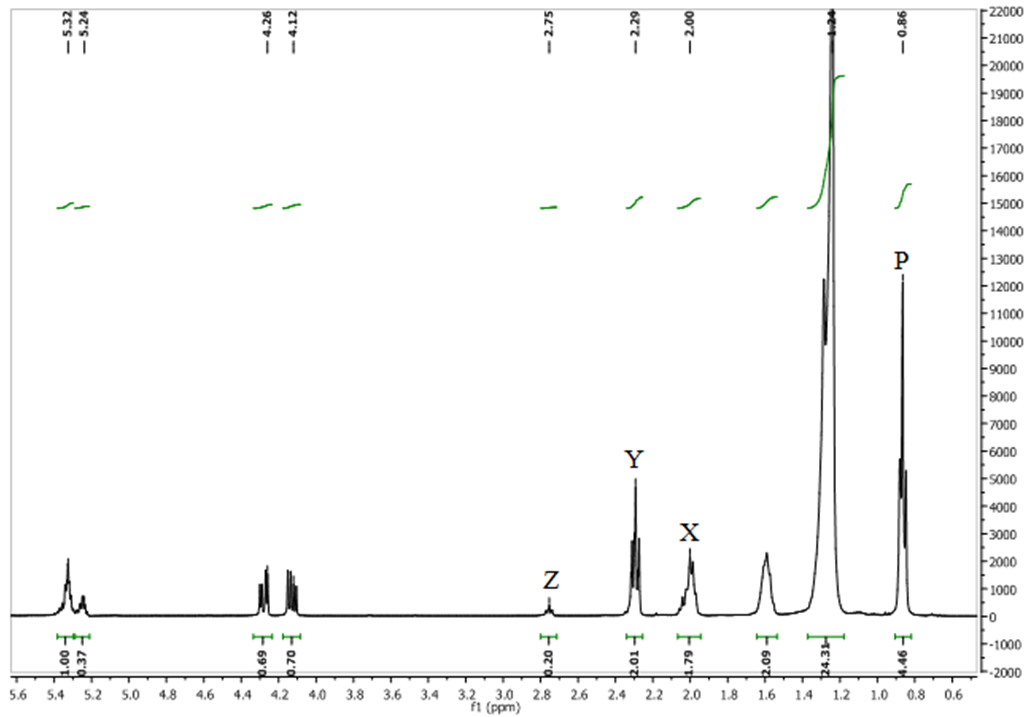 | Figure 1. The  spectrum of crude T. emetica seed oil spectrum of crude T. emetica seed oil |
The terminal methyl group (P) is a triplet occurred as a broad superposition of triplet at 0.86 ppm. The relative amount of PUFA was calculated by using the integrations of the acyl group at δH 2.29 ppm (Y) and protons attached to bis-allylic carbons (Z) at δH 2.75 ppm. The acyl group is equivalent to one methylene group and it occur in all the fatty acid present, while the bis-allylic protons contains two protons and are only present in diunsaturated fatty acid present within the T. emetica seed oil. The relative amount of PUFA was calculated by using the area of the selected signals; | (1) |
The relative amount of MUFA was calculated by the integration of the acyl group (Y) and protons attached to allylic carbon at δH 2.00 ppm (X). The allylic proton is present in all unsaturated fatty acid in the seed oil sample and it contributes a methylene group each to PUFA and MUFA. The fraction (X/2Y) describes the relative amount of the total unsaturation in all seed oil. Hence, relative MUFA content was calculated by; | (2) |
Finally, the relative percentage of saturated fatty acid (SFA) was determined by subtracting the relative amount of the total unsaturation from the total amount of fatty acid as shown below:  | (3) |
2.7. H-NMR of Transesterified T. emetica Seed Oil
The 1H NMR spectrum (Fig. 2) of transesterified oil sample showed two characteristic peaks, a singlet peak observed at B (δH 3.63 ppm) which is due to methoxy groups and a triplet of α- carbonyl methylene protons in the methyl esters at A (δH 2.27 ppm). The presence of these distinct peaks at position A and B was use to confirm the presence of methyl esters present in the oil sample [17].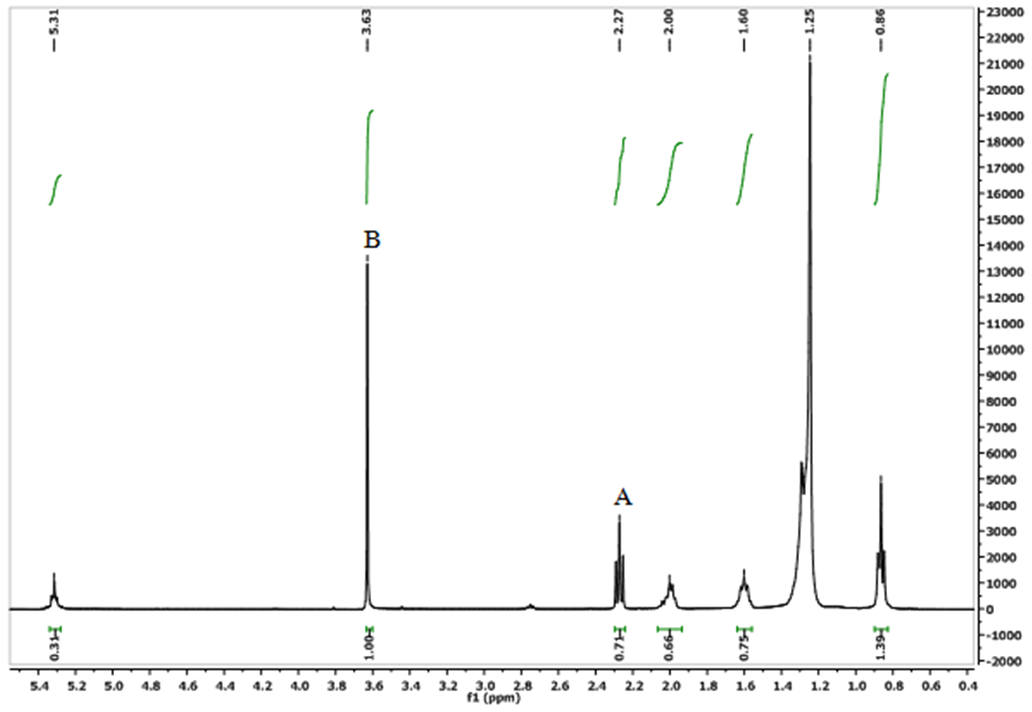 | Figure 2. The  spectrum of transesterified T. emetica seed oil spectrum of transesterified T. emetica seed oil |
And the integration of these peaks was used to quantify the yield of transesterification reaction. In the spectrum, the glyceryl-related signals found at δH 4.10-4.28 and 5.25 ppm were absent, while the remaining signals are similar to those in the crude sample (Fig. 1). The yield of transesterification reaction was quantified using the equation below:  | (4) |
Where:H = Percentage conversion of triacylglyceride to methyl esters.A= Integration value of α-methylene protons.B = Integration value of the methoxy protons of the methyl esters.
3. Result and Discussion
3.1. Extraction of T. emetica Seed Oil
The T. emetica seed oil extracted with hexane was golden yellow brown. The yield was 58% by mass for dry seeds. This result is similar to 55-68% reported by other researchers [3, 21, 22] but higher than 22.90% [24].
3.2. 1H-NMR Analysis
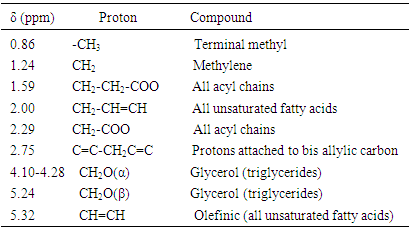
The characteristic resonances in the 1H NMR of crude T. emetica seed oil is similar to those reported for other seed oil (Table 1, Fig. 1) [16, 18].Table 1. Chemical shifts and assignments of the characteristic resonance in the 1H NMR spectrum of crude T. emetica seed oil
 |
| |
|
The relative percentage of SFA, MUFA and PUFA calculated from the integration of the acyl group at (δH 2.29), proton attached to allylic and bis-allylic carbons located at position (δH 2.00) and (δH 2.75) is shown in Table 2. And it indicated that the dominant fatty acid is SFA, followed by MUFA and then PUFA. Table 2. Relative percentage of PUFA, MUFA, and SFA for T. emetica seed oil using 1H NMR
 |
| |
|
Other resonances in the spectrum, are those appearing between δH 4.10 - 4.28 ppm and 5.24 ppm were assigned for glycerol, which is one of the main components of the triacylglycerol fraction and it serve as a backbone to which fatty acid chains are attached (Fig. 3). Protons on sn-1, 2, and 3 on the glycerol have different environments depending on the nature of the fatty acid composition of the oil (Fig. 3). The 2 protons of the sn-1 and 3, assigned α-position are each split by a single proton of sn-2 assigned β-position thus creating a multiplet at δH 4.10 and 4.25. The single proton of the sn-2, was split by four protons of the sn-1 and 3 yielding a multiplet at δH 5.24. The spectrum showed signals at δH 0.86 which is assigned to the terminal methyl group of the fatty acid chain. The absence of methyl signals at δH 0.93, indicated the absence of linolenic acid [6]. The signals of the CH2n chain resonate at δH 1.22. Other significant resonance is that found at δH 5.32 which is attributed to CH=CH found within all unsaturated fatty acids such as oleic and linoleic acid.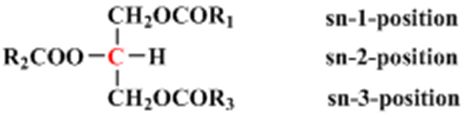 | Figure 3. The structure of the model triacylglycerols |
In the 1H NMR spectrum of transesterified oil (Fig. 2), the percentage conversion of triacylglycerides to its corresponding methyl esters was calculated using the integration values of α-methylene protons at δH 2.27 and that of methoxy protons of the methyl esters at δH 3.63. The percentage conversion is 94%.
3.3. GC-MS Analysis
GC–MS was used to analyse the fatty acid methyl ester composition of Trichilia emetica seed oils (Table 3). Six peaks were observed in the total ion chromatogram of the seed oil samples (Fig 4). Each of this peaks correspond to FAMEs content of the oil samples and was identified from the NIST library match software.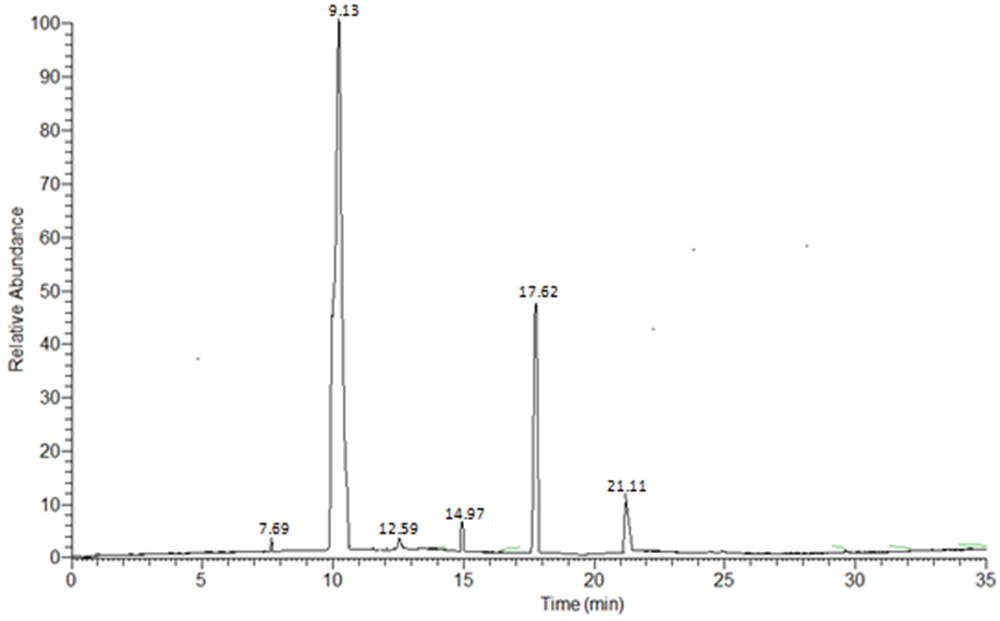 | Figure 4. Total ion chromatogram of T. emetica seed oil showing composition of FAMEs (Rt 7 – 21.11) |
FAMEs have characteristic fragmentation patterns due to the specific way in which the fatty acid breaks down, and also how it undergoes McLafferty rearrangement to produce new ions. The parent ion is the molecular ion, which is equal to the molecular mass and this peak is used as a reference to further characterize other peaks (Fig. 5) [17].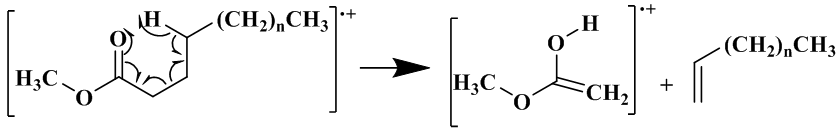 | Figure 5. McLafferty Rearrangement of a Fatty Acid |
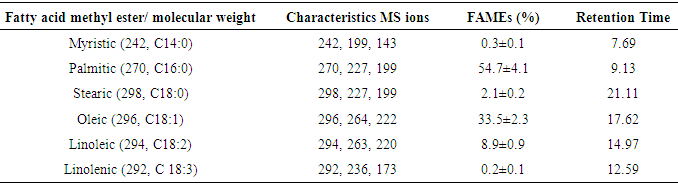
The mass spectra of all saturated FAMEs have a base peak at m/z 74 which is due to a McLerffaty rearrangement [Fig. 5]. Other peaks are those observed at m/z 227 which is due to a loss of hydrogen atom and a propyl radical [M – 43]+, and also m/z 239, occurring as a result of α-cleavage of methoxy group [M –31]+ [17, 19, 20]. The other distinct peaks observed for saturated fatty acid were those at m/z 87, 101, 115, 129, 143, 157, 171, 199, 213 and 227, with each having a difference of 14 amu. These ions were formed due to β-cleavage of carbomethoxy ion [17]. Similarly, palmitic acid methyl ester could be identified with peaks at m/z 270, 227 and 199 (Table 3, Fig. 6).Table 3. Relative percentage (%) of FAMEs in T. emetica seed oil determined by GC-MS analysis
 |
| |
|
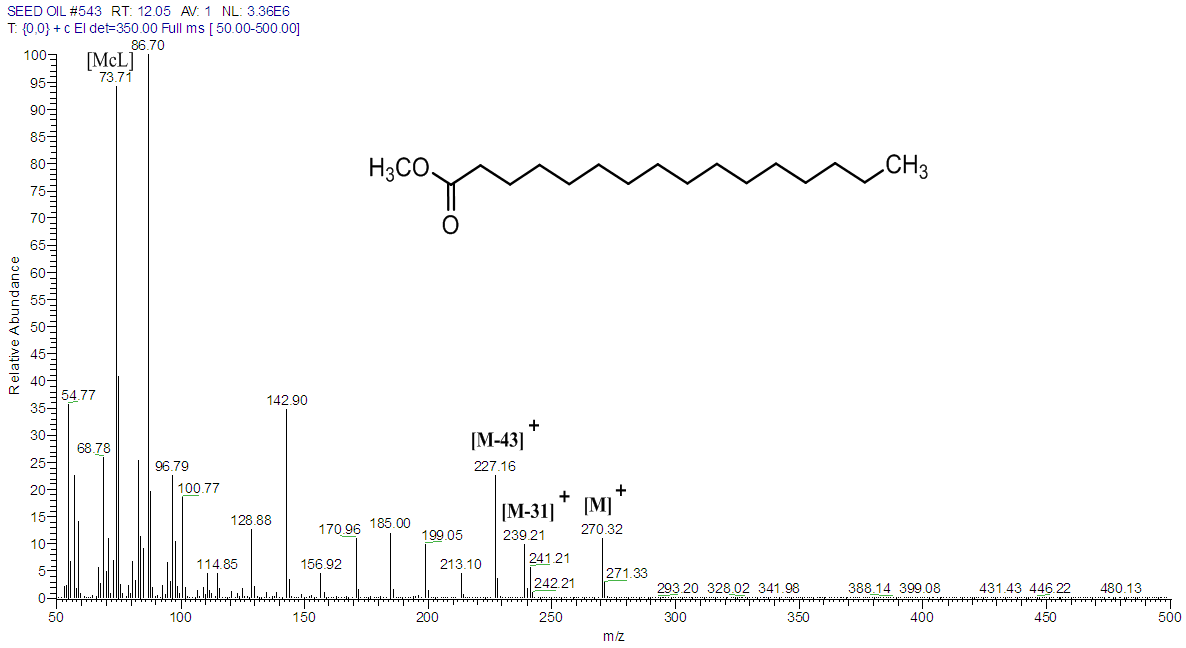 | Figure 6. Mass spectrum of palmitic acid in T. emetica seed oil |
The monounsaturated FAME identified in these oil samples is oleic acid (C18:1) with a relative percentage of 33.5%. The base peak for this FAMEs is at m/z 55, other peaks are those observed at m/z 222 and 264 occurring due to loss of McLafferty ion [M – 74] and a methoxy group [M – 32]+ plus hydrogen ion [20]. These three distinct peaks also help to identify oleic acid methyl esters in the oil. The polyunsaturated fatty acid found to be present in the oil samples are linoleic [C18:2] and linolenic acid [C18:3] with relative proportion of 8.9 and 0.2% respectively. This is confirmed by the characteristics base peak at m/z 67 with other prominent peaks at m/z 263 [M – 31]+ and 220 [M – 74]+ which is due to loss of methoxy group and McLafferty ion. At the lower mass range, peaks were also observed at m/z 67, 81, 95, 109 [17, 20]. From this analysis, the presence of fatty acids containing 14, 16 and 18 carbon chain length in the seed oil was confirmed (Table 3). The saturated fatty acids found to be present were C14:0, C16:0 and C18:0, the only monounsaturated fatty acid was C18:1 while polyunsaturated fatty acid were C18:2 and C18:3, respectively. Palmitic acid methyl ester (C16:0) was the most abundant FAME with a relative percentage of 54.7 %, followed by oleic acid methyl ester with relative percentage of 33.5 % in the oil samples. The result obtained in this study differs from that reported by [3, 5], but similar to those reported by other researchers [2, 4]. This justifying the use T. emetica seed oil as a raw material in soap, candle and cosmetic industries, and also as wood oil use in upholstery [3, 21, 22, 23]. In addition, the oil is also used as a starting material in cocoa butter production (Vermaak et al., 2011). The relative percentage of SFA, MUFA and PUFA determined in the oil samples using 1H NMR agrees with that obtained using GC-MS.
4. Conclusions
The fatty acid profiles of T. emetica seed oil was characterised using different analytical techniques. The result obtained from 1H-NMR of crude T. emetica seed oil and GC-MS analysis of FAMEs agrees with each other, and it indicated that the oil is highly saturated (>55%). It also contained more than 30% of oleic acid methyl esters (C18:1) and had high proportion of fatty acids with 18 carbon atoms. The 1H-NMR-based procedures is fast and does not require the oil to be derivatized or manipulated and can be a powerful tool in the assessment oil quality and authenticity.
ACKNOWLEDGEMENTS
Abdullahi Usman is thankful to the Nigerian Tertiary Education Trust Fund (TETFUND) for the sponsorship.
References
| [1] | Knothe G. and Kenar J.A. (2004). Determination of fatty acid profile by 1H NMR spectroscopy. European Journal of Lipid Science and Technology. 106, 88-99. |
| [2] | Vermaak, I., Kamatou P.P.G., Komane-Mofokeng B. Viljoen A.M. and Beckett K. (2011). African seed oils of commercial importance - Cosmetic applications. South African J. Bot. 77, 920– 933. |
| [3] | Grundy M.I. and Campbell B.M. (1993). Potential production and utilisation of oil from Trichilia SPP. (Meliaceae). Econ. Bot. 47, 148–153. |
| [4] | Khumalo L.W., Majoko L., Read J.S. and Ncube I. (2002). Characterisation of some underutilised vegetable oils and their evaluation as starting materials for lipase-catalysed production of cocoa butter equivalents. Ind. Crops Prod. 16, 237–244. |
| [5] | Engelter C. And Wehmeyer S.A. (1957). Fatty acid composition of oils of some edible seeds of wild plants. J. Agric. Food Chem. 18, 25–26. |
| [6] | Hidalgo J.F. and Zamora R. (2003). Edible oil analysis by high-resolution nuclear magnetic resonance spectroscopy: recent advances and future perspectives. Trends Food Sci. Technol. 14, 499–506. |
| [7] | Vlahov G. (1999). Application of NMR to the study of olive oils. Progress in Nuclear Magnetic Resonance Spectroscopy, 35, 341-357. |
| [8] | Wollenberg F.K. (1990). Quantitative high resolution 13C nuclear magnetic resonance of the olefinic and Carbonyl carbons of edible vegetable oils. Journal of the American Oil Chemist’ Society, 67, 487-494. |
| [9] | Lie Ken Jie M.S.F. and Mustafa J. (1997). High resolution nuclear magnetic resonance spectroscopy- application to fatty acids and triacylglycerols. Lipids 32, 1019-1034. |
| [10] | Vlahov, G., Schiavone C. and Simone N. (2001). Quantitative 13 C NMR method using the DEPT pulse sequence for the determination of the geographical origin ( DOP ) of olive oils 35, 689–695. |
| [11] | Johnson F.L. and Shoolery N.J. (1962). Determination of unsaturation and average molecular weight of natural fats by nuclear magnetic resonance. Analytical Chemistry, 34, 1136-1139. |
| [12] | Miyake N., Yokomizo K., Matsuzaki N. (1998). Rapid determination of Iodine value by 1H- nuclear magnetic resonance spectros-copy. J. Am. Oil Chem. Soc.75, 15–19. |
| [13] | Fauhl C., Reniero F., Guillou C. (2000). 1H-NMR as a tool for the analysis of mixtures of virgin olive oil with oils of different botanical origin. Magn. Reson. Chem.38, 436–443. |
| [14] | Guillén M.D. and Ruiz A. (2003). Edible oils: discrimination by 1H-nuclear magnetic resonance. J. Sci. Food Agric. 83, 338–346. |
| [15] | Lie Ken Jie M.S.F. and Lam C.C. (1995a). 13C-NMR studies of polyunsaturated triacylglycerols of type AAA and mixed triacylglycerols containing saturated, acetylenic and ethylenic acyl groups. Chem. Phys. Lipids 78, 1-13. |
| [16] | Thoss V., Murphy P.J., Marriott R., Wilson T. (2012). Triacylglycerol composition of British bluebell (Hyacinthoides non-scripta) seed oil. RSC Adv. 2, 5314. |
| [17] | Tariq M., Ali S., Ahmad F., Ahmad M., Zafar M., Khalid N., Khan M.A. (2011). Identification, FT-IR, NMR (1H and 13C) and GC/MS studies of fatty acid methyl esters in biodiesel from rocket seed oil. Fuel Process. Technol. 92, 336–341. |
| [18] | Mannina L., Luchinat C., Emanuele M.C., Segre A. (1999). Acyl positional distribution of glycerol tri-esters in vegetable oils: A 13C NMR study. Chem. Phys. Lipids 103, 47–55. |
| [19] | McLerffaty W.F, 1959. Mass spectrometric analysis, molecular rearrangements. Anal. Chem. 31, 82–87. |
| [20] | Gunawan S., Darmawan R., Nanda M., Setiawan A.D, Fansuri H., 2013. Proximate composition of Xylocarpus moluccensis seeds and their oils. Ind. Crops Prod. 41, 107–112. |
| [21] | Fupi, P.C. and Mork, W.K., 1982. Mafura Nut Oil and Meal: Processing and Purification. JAOCS 59, 94–98. |
| [22] | Orwa, C., Mutua, A., Kindt, R., J., R., Simons, A., 2009. Trichilia emetica. Agroforestree database: a tree reference and selection guide version 4.0. Available at http://www.worldagroforestry.org/af/treedb/. [Accessed: January 19, 2013]. |
| [23] | Van der Vossen, H.A. and Mkamilo, G.S., 2007. Vegetable oils of tropical Africa, conclusion and recommendations based on PROTA 14: “Vegetable oils”. Available on: PROTA (Plant Resources of Tropical Africa/Resources vegetales de I’Afrique tropicale), Wageningen, Netherlands http://www.prota.co.ke/en/p. PROTA. |
| [24] | Saka, J.D.., Msonthi, J.D., 1994. Nutritional value of edible fruits of indigenous wild trees in Malawi. For. Ecol. Manage. 64, 245–248. |

 Abstract
 Reference
 Full-Text PDF
 Full-text HTML