-
Paper Information
- Paper Submission
-
Journal Information
- About This Journal
- Editorial Board
- Current Issue
- Archive
- Author Guidelines
- Contact Us
Advances in Analytical Chemistry
p-ISSN: 2163-2839 e-ISSN: 2163-2847
2015; 5(3): 51-55
doi:10.5923/j.aac.20150503.01
Solid State Compatibility Studies of Miconazole Using Thermal and Spectroscopic Methods
 Abstract
 Reference
 Full-Text PDF
 Full-text HTML
Alka Gupta 1, Hemanta Kumar Kar 2
1University School of Medicine and Para Medical Health Sciences, Guru Gobind Singh Indraprastha University, New Delhi, India
2NDMC Medical College, Former Director, Post Graduate Institute of Medical Education and Research, New Delhi, India
Correspondence to: Alka Gupta , University School of Medicine and Para Medical Health Sciences, Guru Gobind Singh Indraprastha University, New Delhi, India.
| Email: |  |
Copyright © 2015 Scientific & Academic Publishing. All Rights Reserved.
Drug excipient physicochemical characterization is a systematic approach towards design of therapeutically active and stable dosage forms. The rapid advancements in novel drug delivery systems have led to an interest by formulation scientists in the role and functionality of the excipients. Fourier transform infrared spectroscopy (FTIR), Differential scanning calorimetry (DSC), and Powder X-ray diffractometry (XRD) analytical techniques of high resolution were used to get an insight on solid state properties of the drug and evaluate drug-excipient compatibility. Preformulation studies which were performed using thermal and spectroscopic techniques implied compatibility of phospholipon 90, cholesterol and carbapol 934 excipients with the drug miconazole nitrate.
Keywords: Preformulation, Incompatibility, Excipient, Thermal analysis, X ray Diffraction
Cite this paper: Alka Gupta , Hemanta Kumar Kar , Solid State Compatibility Studies of Miconazole Using Thermal and Spectroscopic Methods, Advances in Analytical Chemistry, Vol. 5 No. 3, 2015, pp. 51-55. doi: 10.5923/j.aac.20150503.01.
Article Outline
1. Introduction
- Estimation of drug-excipient interactions is a pivotal step in preformulation studies of drug development to achieve consistent stability, bioavailability and manufacturability of vesicular dosage forms. The advent of analytical methods like FTIR spectroscopy, DSC and X ray diffraction into pre-formulation studies have contributed significantly to early prediction and characterization of pharmaceutical excipients’ incompatibility with active pharmaceutical ingredient(API) to avoid expensive material wastage and considerably reduce the time required to arrive at an appropriate formulation [1, 2]. The present research article focuses on the analytical techniques for compatibility screening of miconazole nitrate with cholesterol (CHL), phosphatidylcholine (P90) and carbopol (C 934) using DSC, nonthermal FTIR and XRD techniques for development of targeted nano drug delivery systems. Miconazole Nitrate: Chemistry and Action Miconazole nitrate (MN) has a broad spectrum and inhibits the growth of dermatophytes, namely, species of Trichophyton, Microsporum, Epidermophyton, pathogenic and nonpathogenic yeasts, and gram positive bacteria. Miconazole nitrate([1-2(2,4-dichlorophenyl)-2-(2,4-dichlorophenyl) methoxylethyl imidazole) contains a five membered ring imidazole containing 2 nitrogen atoms (Figure 1).
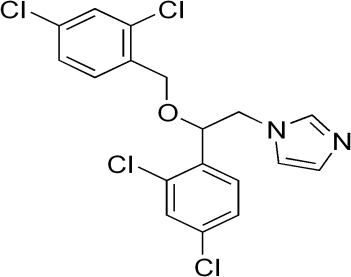 | Figure 1. Chemical Structure of Miconazole |
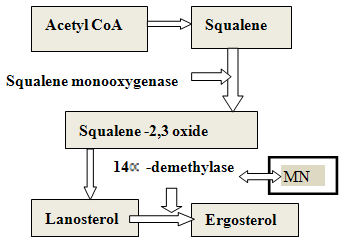 | Figure 2. Inhibition of Ergosterol Synthesis by Miconazole Nitrate |
2. Materials and Methods
- The drug miconazole nitrate was obtained as a gift sample from GlaxoSmithKline Pharma Ltd., Mumbai. Cholesterol (Lobachemie), Polymer-Carbapol 934 (HPL Chemicals) were used in the study. Phospholipon 90 (phosphatidylcholine) was obtained as a kind gift from Lipoid GmbH, Ludwigshafen, Germany. All the chemicals and solvents used in the study were of analytical grade.
2.1. Differential Scanning Calorimetry
- DSC analyses of pure drug MN and excipients - CHL, P90 and C934 were performed on a DSC-25 Mettler (Perkin-Elmer Pyris 1). Samples were weighed accurately (~3-5 mg) in aluminum pans and heated at a predefined rate of 10ºC/min over the temperature range from 20 to 300ºC in nitrogen atmosphere. Nitrogen gas was introduced at 2 bars and flow rate of 20 mL min-1. On the other side of calorimeter, an empty crimped aluminium pan was placed as a reference standard. The scans were recorded and plots between heat flow and temperature (ºC) were obtained [4, 5].
2.2. Infrared Spectroscopy (FTIR)
- FTIR spectra of pure drug MN, carbopol 934 polymer, lipid phosphatidylcholine and cholesterol (CHL) were recorded using KBr pellet technique (2 mg sample in 180 mg KBr) on an IR spectrophotometer (Perkin Elmer, Japan) over a range 400-4000 cm-1 [6].
2.3. X-ray Diffraction Study (XRD)
- XRD solid state analysis of the pure drug was done using X-Ray Diffractometer (X’PERT Pro Holland).The powder was fixed on to X-ray diffraction slide and fitted into a sample holder on X-ray diffraction machine. The diffractogram were recorded on X’PERT Pro PANalytical 3040/60 Diffractometer (Netherland, Holland) using Cu-Kα line as a source of radiation which was operated at the voltage 40 kV and the 30 mA [7]. All samples were measured in the 2ɵ angle range between 5-40º with scanning rate 2º min-1.
2.4. Drug–Excipient Compatibility Study
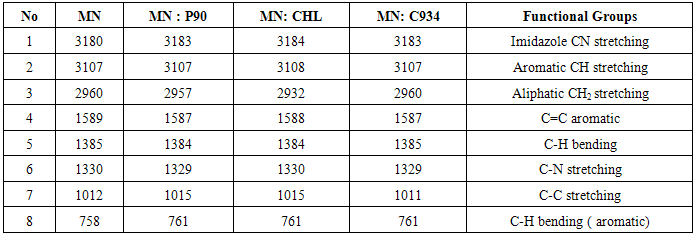
- As a part of pre- formulation study, a compatibility study of MN with the other excipients was carried out using physical blends in IR spectroscopy and DSC thermal analysis as mentioned above [8]. In IR spectroscopy, 1:1 proportion of solid state drug with excipients was checked for by observing the functional peaks of drug (characteristic wave numbers) in physical mixtures. DSC studies were done to evaluate drug excipient interaction and change in position of endothermic peak in drug blend. X ray diffraction spectra of drug polymer mixture was obtained for investigating the crystallinity of the drug in polymer mixture.
3. Results and Discussion
- The rapid evolution of delivery systems, advancements in biopharmaceutics and drug development, scientific, regulatory and economic factors have led to a new interest in characterization of excipients. More than hundreds of excipients with varying simple to complex chemical structures are available from a multitude of sources and are used today in the pharmaceutical industry [9]. Excipients when added in drug delivery system perform a variety of functions to guarantee bioavailability of the drug substance from the drug product, stability of delivery system and its manufacturability on a production scale [10]. For the development of targeted release formulations of miconazole nitrate, various analytical techniques were used to assess the compatibility of miconazole nitrate with selected excipients [11, 12]. Differential Scanning Calorimetry (DSC) studies were carried out using DSC-25 Mettler which is a very useful thermoanalytical tool to evaluate purity and physicochemical state of compounds using melting point and enthalpy changes of physical blend for drug excipient interaction [13]. This analytical technique measures the heat flow rate to or from a sample specimen as it is subjected to a controlled temperature program in a controlled atmosphere. In heat flow curves, peak transitions are associated with melting, crystallization, and curing. The main benefit of DSC, rather than stressed storage methods, is its ability to quickly screen potential recipients for incompatibilities derived from the appearance, shifts or disappearances of peaks and/or variations in the corresponding enthalpy of transition. Also other features like low sample usage also makes it an attractive method [14]. The thermograms of MN, CHL, P90 and C934 were obtained in which Y-axis represented heat flow in milliWatts (mW) and the X-axis displayed temperature (T) (Figure 3 a, b, c, d). When DSC scan of the drug was performed; a peak was obtained at 135.3ºC that confirms the melting point of MN. CHL showed a sharp endothermic peak at 150.3 ºC which corresponds to its melting point. Carbapol 934 showed two broad endothermic peaks, one at 76.26°C, and the other one at 238.9°C. The thermogram of PL90 showed slightly sharp peak at 120.5°C. This study further was aimed to evaluate physical mixture of drug with cholesterol and phospholipon 90 (1:1 w/w) for any evidence of interaction. The thermogram of physical mixture showed peaks at122.4°C (corresponding to PL 90), at 135.3°C (corresponding to MN) with enthalpy changes and at 150.6 °C and 160.8 °C (corresponding to CHL) (Figure 3e) As position of endothermic principal peak of drug is observed at 135.3C in solid state thermal screening, drug was found to be compatible with excipients and there was no appreciable change observed in melting endotherm of physical mixture corresponding to pure pharmaceutical ingredients.
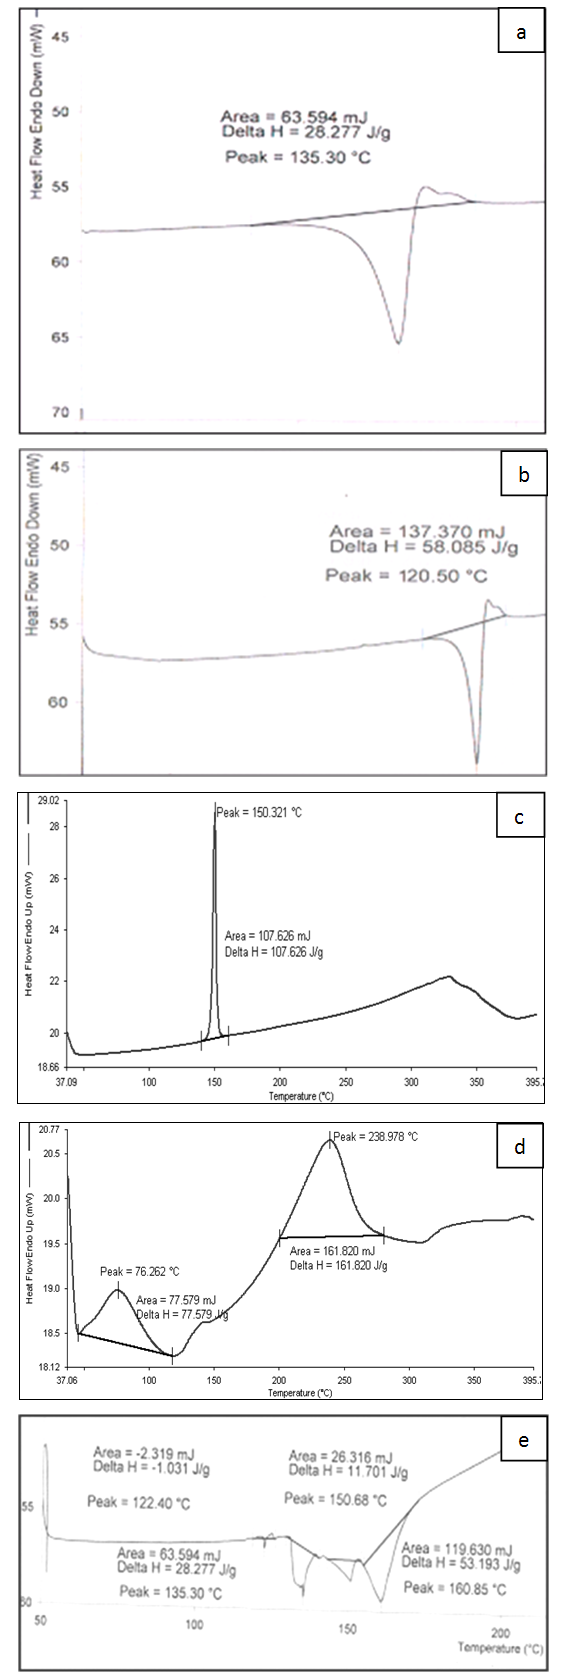 | Figure 3. Differential Scanning Calorimetry Thermograph of a.MN b .P 90 c. CHL d. C 934 e. Drug: P90: CHL Physical Blend |
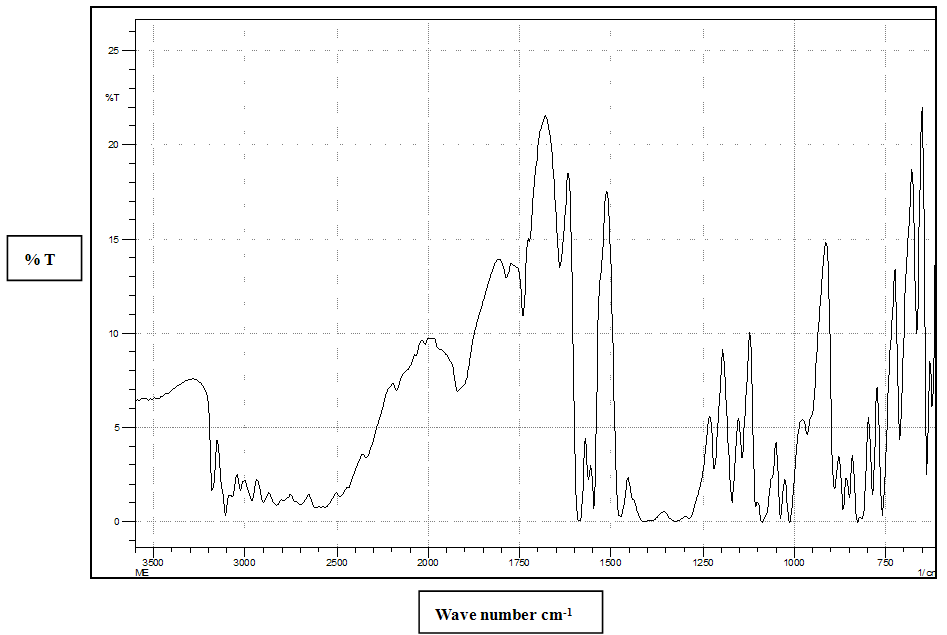 | Figure 4. FTIR of MN (Principal peaks at 3180, 3107, 2960,2900,1919,1589, 1012,758  ) ) |
|
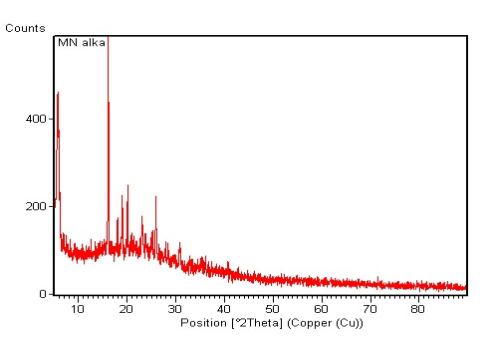 | Figure 5. X Ray Diffractogram of Miconazole Nitrate |
4. Conclusions
- In order to prepare a physically and chemically stable formulation, it is necessary that the drug should be compatible with the excipients that are intended to be used in the formulation. Differential calorimetric analytical studies have shown that miconazole nitrate is very much compatible with selected additives-lipid, polymer and membrane stabilizer. The complementary techniques-XRD, FTIR further confirmed the findings of thermal analysis. Thus, promising results of solid state compatibility screening analysis of drug and no excipient interaction indicate suitability of pharmaceutical ingredients for development of targeted nano drug delivery systems.
ACKNOWLEDGEMENTS
- The authors extend their gratitude to Advanced Instrumentation Lab, Jawaharlal Nehru University, New Delhi for providing X ray diffraction facility to conduct this analytical work.