Khalid Abu-Shandi 1, Albara Al-Rawashdeh 1, Gassab Al-Mazaideh 1, Eyad Abu-Nameh 2, Ahmed Al-Amro 1, HakemAl-Soufi 2, Aal'a Al-Ma'abreh 1, Asma Al-Dawdeyah 1
1Department of Chemistry and Chemical Technology, Tafila Technical University, Tafila, Jordan
2Department of Chemistry, Faculty of Science, Al-Balqa Applied University, Al-Salt, Jordan
Correspondence to: Khalid Abu-Shandi , Department of Chemistry and Chemical Technology, Tafila Technical University, Tafila, Jordan.
| Email: |  |
Copyright © 2015 Scientific & Academic Publishing. All Rights Reserved.
Abstract
A systematic method for the extraction and identification of the natural products in Rubus Fruticosus plant was developed. Leaves, stems and roots were treated separately and the results were compared. The identification of the natural products was obtained by using GC/MS method. Six major compounds are found in the leaves extract and four major compounds are found in each of the stems and the roots extracts. The conjoint compounds that found in these extracts are: Vitamin E, phthalic acid diisoctyl ester, 9,12,15-octadecantrienoic acid methyl ester, Hexadecandienoic acid methyl ester and 2-Furancarboxaldehyde. Different percent compositions for the major components were observed in the three extracts. Accordingly, it is notable that the components are naturally distributed between the leaves, stems and the roots. The major and minor compounds in the extracts include terpenes, acyclic diterpene alcohol, triazoles, furans, saturated and unsaturated fatty acids methyl esters, α-Tocopherol and others. The GC/MS method was supported by HPLC/PDA method. Both instrumental methods produce sharp, resolved and accurately quantified peaks. However, strong assumptions were built from the GC/MS method due to the ability for data comparison between the collected results and the documented library adapted with the instrument.
Keywords:
Rubus Fruticosus plant, GC/MS, HPLC/PDA, Natural compounds, Extraction
Cite this paper: Khalid Abu-Shandi , Albara Al-Rawashdeh , Gassab Al-Mazaideh , Eyad Abu-Nameh , Ahmed Al-Amro , HakemAl-Soufi , Aal'a Al-Ma'abreh , Asma Al-Dawdeyah , A Novel Strategy for the Identification of the Medicinal Natural Products in Rubus Fruticosus Plant by Using GC/MS Technique: A Study on Leaves, Stems and Roots of the Plant, Advances in Analytical Chemistry, Vol. 5 No. 2, 2015, pp. 31-41. doi: 10.5923/j.aac.20150502.02.
1. Introduction
Wild grown Rubus Fruticosus plants are widespread in different countries around the world (Gomar et al 2014; Antonius & Nybom 1994). In Jordan, there are many types of these plants. This work includes the plant which is shown in Figure 1.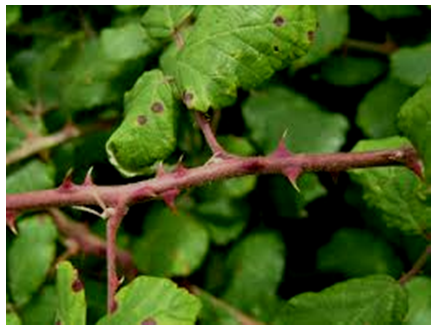 | Figure 1. A picture of the Rubus Fruticosus plant under study collected from Al-Karak city in Jordan |
The plant components; leaves, stems, and roots have important applications in herbal medicine (Tobyn et al 2011). For example, Rubus Fruticosus are known for their anticancer properties (Lee et al 2012; Sauter & Wolfensberger 1989). As they contain high levels of antioxidants, they are known to destroy the free radicals that harm cells and can lead to cancer (Elisia et al 2007; Wang & Lin 2000). They also help protect and strengthen the immunity, which lowers the risk of cancer (Hassimotto et al 2009). They are especially helpful when it comes to reduce the risk of esophageal, cervical, and breast cancer (liveandfeel.com 2014). Moreover, Rubus Fruticosus leaves have been traditionally used as an antimicrobial agent and for their healthful antioxidant properties (Martini et al 2009). Rubus Fruticosus has been used in Europe to treat diabetes. An extract of the leaves showed a hypoglycemic effect on diabetic rats (Bailey & Day 1989). Leaves and roots of the plant are long-standing home remedy for anemia, regulates menses, diarrhea, and dysentery (Gairola et al 2014). The fruit and juice are taken for anemia (herbsrainbear.com 2013). They are used to treat sore throats, mouth ulcers, and gum inflammations (altnature.com 2013). Recently, good results are obtained in testing learning and memory impairment (Gomar et al 2014) and a hyaluronidase inhibitory activity was obtained from aqueous extract of the fruits Rubus Fruticosus (Marquina et al 2002). Antioxidant (vitamin C, ellagic acid, anthocyanins and total phenolics) levels can be influenced by pre-harvest climate conditions and post-harvest storage time with Rubus Fruticosus (Ali et al 2011). Proteins solubilized from plasma membrane enriched fractions isolated from Rubus Fruticosus protoplasts were tested for their ability to bind the side chain of XXFG, using a digoxigenin- or biotin-conjugated neoglycoprotein specific for 2′-fucosyl-lactose in blots and k-ELISA tests (Dunand et al 2000). Antimicrobial activities of Rubus Fruticosus juice against foodborne pathogens including Listeria monocytogenes, Salmonella Typhimurium and Escherichia coli O157: H7 were investigated. Inhibition of growth of these foodborne pathogens was observed (Yang et al 2014). A study on a European Rubus Fruticosus plant was performed to investigate the use of the plant as a herbal medicine and to identify some active components (Verma et al 2014). Phenolic extracts of Rubus Fruticosus were Microencapsulated by lyophilization in matrixes of β-cyclodextrin (β-CDS), chitosan (C), xanthan (X) and hydrogel (H). The encapsulation was confirmed by Scanning Electron Microscopy (SEM) and Thermogravimetric Analysis (TGA); their antioxidant activity, controlled release of phenolics and efficiency of encapsulation were determined (Rosa et al 2014).In literature, several trials were performed to identify the components of the Rubus Fruticosus plants. For example, plants were assayed for total phenol content by enzymatic method using immobilized horseradish peroxidase (HRP) (Isik et al 2011). A new triterpene acid, rubitic acid was isolated from the alcoholic extract of the whole plant of Rubus Fruticosus. The structure of rubitic acid was shown to be 7α-hydroxy ursolic acid (Sarkar & Ganguly 1978). Here in, we are motivated by all of the previous applications to study this type of plants from chemical point view. The natural products in the Leaves, stems and roots of Rubus Fruticosus plant were extracted and identified by GC/MS method.
2. Experimental Part
2.1. Collection and Preparation of the Plant Material
The plant samples were harvested from Al-Karak city in Jordan. All parts of the plant were separated and used immediately after collection without further treatment.
2.2. Reagents
Methanol and acetonitrile (HPLC grade) and Potassium phosphate were purchased from Aldrich and used without further purification. Water was distilled by using a distillator type GLF-2012.
2.3. Method of Extraction
Leaves, stems and roots (10.0 g each) are accurately weighed and soaked separately in three 50 mL volumetric flasks and covered to the mark with methanol. The flasks containing the three materials were manually shaken, and left to stand for 24 h in dark at room temperature. The methanolic extracts were filtered, collected in new clean volumetric flasks and stored in refrigerator under a temperature of 5º ± 1 until use.
2.4. Spectrophotometric Measurements
All absorbance measurements were performed by a spectrophotometer type Shimadzu UV-1800.
2.5. High Performance Liquid Chromatography
An HPLC system consisting of a pump type Shimadzu LC-20AT with a photo diode array (PDA) detector type Shimadzu SPD-M20A was used. The wavelength was monitored at 240, 263, 271, 324 and 363 nm. The mobile phase was a mixture of acetonitrile and potassium phosphate buffer with a ratio of 25% to 75% at a pH of 3.15. The separation was performed by using a Waters associated microbonapack C18 column, 5μm (4.6 x250mm) at a flow rate of 0.5 mL/min.
2.6. Gas Chromatography/Mass Spectroscopy
An Agelent Technology gas chromatograph system type 7890 GC equipped with a mass spectrometer type Agelent Technology 5975C Inert MSD triple axes detector was used. A highly pure Helium gas (99.999%) was employed as the carrier gas. The inlet pressure was 18.3 psi and the makeup gas for the mass spectrometer was highly pure argon (99.999%), at a flow rate of 19 mL/min. A column of 5% divinyl 95% dimethyl siloxane, 30 m, 0.25 μm was used. The column oven temperature was programmed as follows: start temperature at 80ºC; increased to 295ºC with a ramp of 15ºC/min, the temperature was held at 295ºC for 5 min until elution was complete. After 15 s the split valves were opened for 3 min to purge the injector. All injections (2 μL) were made with a 10 μL Hamilton syringe.
3. Results and Discussion
3.1. Motivations
After extraction in methanol, the spectrophotometric measurements were performed. Scanning (Absorbance vs. wavelength λ) and linearity measurements were accomplished. The resulted observations were significant, which have motivated us to expand the study by using separation techniques such as HPLC/PDA and GC/MS that lead to the separation and identification of components. Here in, we have discussed the method and the results deeply for each step.
3.2. Spectrophotometric Measurements
Methanol was found to be a suitable solvent for the extraction of the active constituents of the plant. The absorption spectrum for each extract was obtained and λmax for absorption bands were monitored (Figure 2). Separate scans for leaves and stems extracts indicated that there were six absorption bands with maximum absorbance at 665, 468, 437, 360, 263 and 213 nm. For roots, two absorption bands were observed at 263 and 225 nm.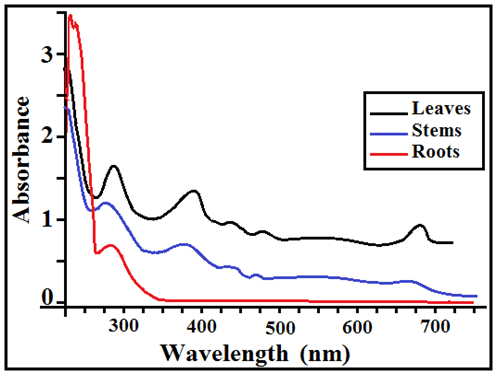 | Figure 2. The UV/Vis scans (Absorbance vs. λ) for the extracts of leaves, stems and roots |
The band at 263 nm has the highest intensity and was selected to test the linearity of the three extracts. The test was performed by taking volume aliquots from the extracts, diluted with methanol followed by measuring the absorbance. After generating a plot, it was found that the absorbance against volume aliquots is linear for the three extracts with the following straight line equations: leaves (y = 6.6214x + 0.1089, R = 0.9989), stems (y = 4.0025x + 0.0225, R = 0.9997) and roots (y = 1.5235x - 0.0109, R = 0.9997). From the slope values, it can be concluded that the concentration of the components in leaves is larger than those in stems which is larger than those in roots, figure 3.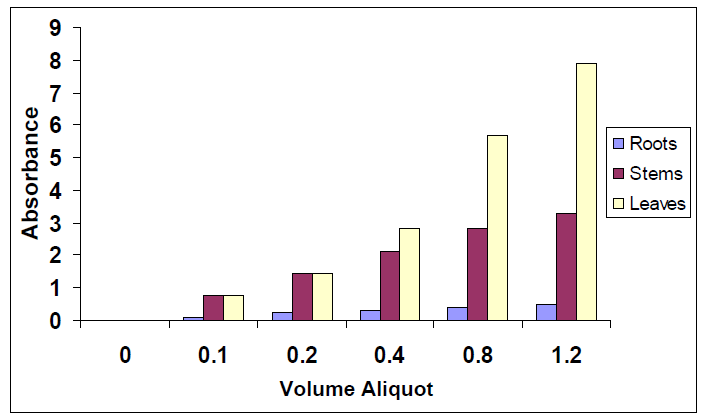 | Figure 3. Histogram (volume aliquot vs. Absorbance) of the extracts shows the distribution of natural products in leaves, stems and roots at 263 nm |
3.3. HPLC/PDA Measurements
According to the spectrophotometric measurements, the separation processes were depicted. HPLC/PDA was used to investigate the composition of the extracts clearly. The wavelengths of the PDA detector were set at 240, 263, 271, 324 and 363 nm. Complete separation of the constituents on the chromatogram was carried out after several mobile phase changes. First, 50%:50% methanol/water was used at pH 3.15. Second, 50%:50% acetonitrile/water at deferent pH values was used. Disappointingly, the obtained results were unacceptable. However, the optimized mobile phase which showed an acceptable separation with good resolution was 25%:75% acetonitrile/buffer solution at pH 3.15. Figure 4 shows the HPLC chromatograms of the three extracts at 263 nm. The chromatograms at 240 and 271 nm are similar to those at 263 nm with minor differences in the intensity. The chromatogram peaks at 324 and 363 nm have shown low intensities. Poor results were obtained at the two wavelengths.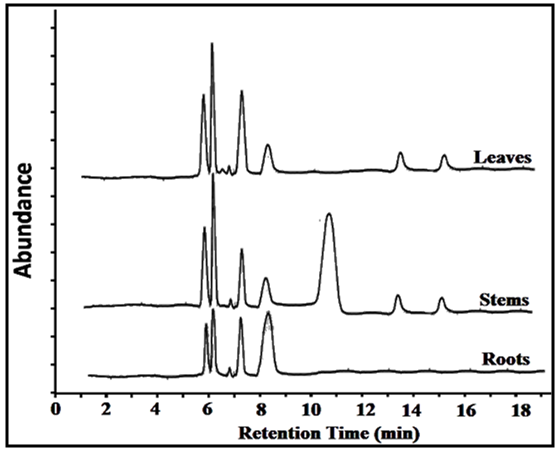 | Figure 4. The HPLC chromatograms of the leaves, stems and roots extracts at 263 nm (the abundance scale is uniform in all cases) |
Eight peaks were observed in the chromatogram of the extract of the leaves and the stems and five peaks for the extract of the roots, at the corresponding retention times as shown in Figure 4. A notable difference between the chromatograms was observed. For example, the significant peak at retention time of 10.8 min in the chromatogram of stems extract is not observed the chromatograms of leaves and the roots extracts. The peak at 7.2 min in leaves extract is larger than those in stems and roots extracts. The peaks at 13.5 and 15.5 min in the leaves and stems extracts are identical and not observed in the chromatogram of roots extract. Thus, the applied method was effective and resulted in sharp and quantified peaks. However, the identification of the natural components in the plant still not achieved. Accordingly, up to this point, it was found that adapting a new methodology for the components identifications beside the effective applied separation method would be great. Therefore, the components existing in each extract were identified by using GC/MS as shown in the next section.
3.4. Gas Chromatography/Mass Spectroscopy
Chromatographic separation of components is essential for identification. It was conducted by using a gas chromatograph connected to a mass spectrometer. Efficient separation of components was obtained by using a 5% divinyl 95% dimethyl siloxane, 30 m, 0.25 μm capillary column. The carrier gas was Helium at a flow rate of 18.3 psi. The temperature programming of the column oven was as follows: start temperature at 80ºC; increased to 295ºC with a ramp of 15ºC/min, the temperature was held at 295ºC for 5 min. For GC/MS, the used mass analyzer was the quadrupole mass filter. It facilitates the movement of ions using electrostatic focusing, and allows ions of a particular mass to charge ratio (m/z) to hit the detector at a given time, generating a signal. The mass spectrum is a plot of ion abundance versus mass to charge ratio (m/z). The mass spectrum of a compound typically shows number of signals. The peak at highest m/z (molecular ion) usually corresponds to the mass of the whole molecule. The signals with lower m/z are fragment ions and can provide some structural information and the base peak appears at 100% abundance. Considering the advantages of the use of capillary GC/MS with split and splitless modes, it was decided to use both techniques for the analysis of the Rubus Fruticosus extracts.
3.5. The Leaves Extract
Under the conditions described above, fifteen compounds were detected as individual, sharp, resolved and readily quantified peaks. Six peaks are major (>2% composition) and the other nine are minor. The results are summarized in Figures 5-7 and table 1.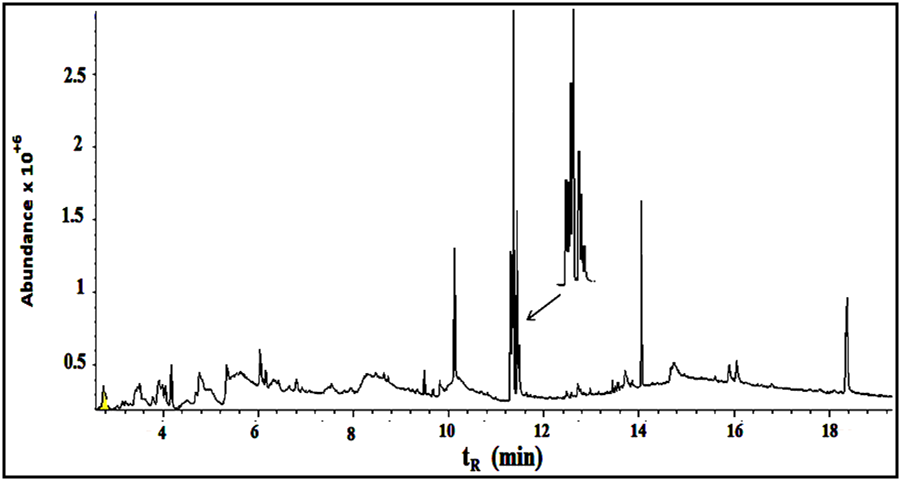 | Figure 5. The GC/MS chromatogram for the leaves extract, split ratio 5:1 |
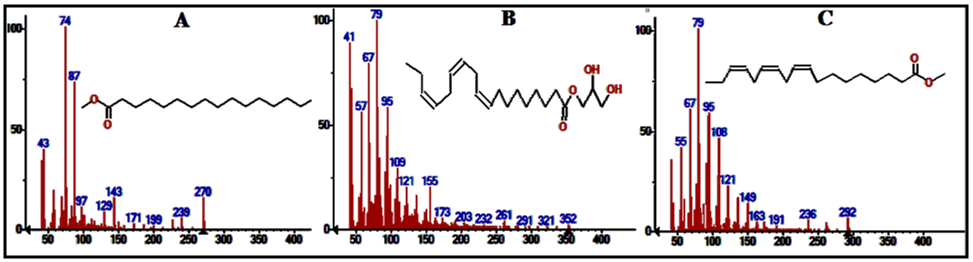 | Figure 6. Mass spectra of the major compounds in leaves extract at times (A): 10.202 min (B) 11.318min (C) 11.376 min |
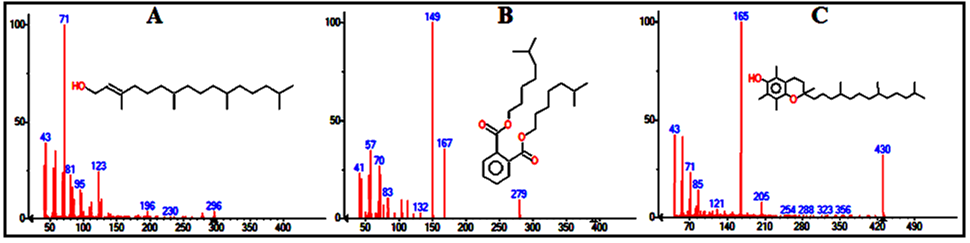 | Figure 7. Mass spectra of the major compounds in leaves extract at times: (A) 11.446 min (B) 14.115 min (C) 18.365 min |
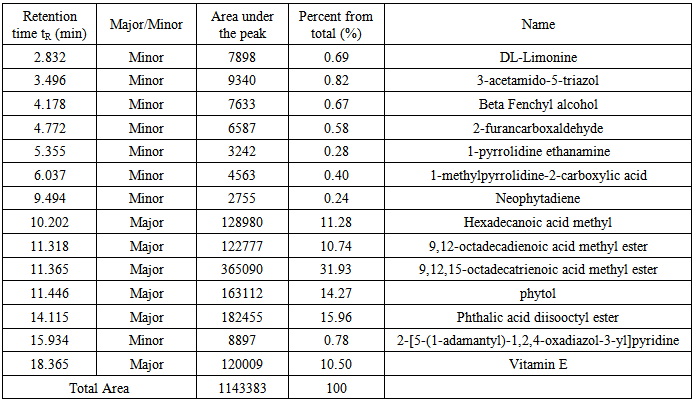
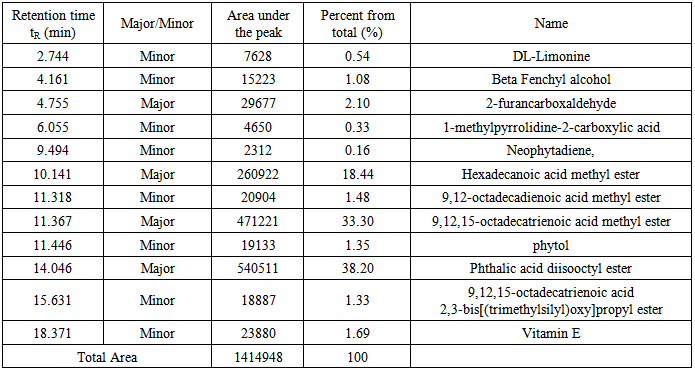
Table 1. Detail description of the components found in the leaves extract
 |
| |
|
Structural assay of the components which helps to identify the compounds that incorporated in the extract is required. In a traditional compounds discovery projects, researchers usually use the method of high-throughput screening (HTS) in libraries which is packed with instruments. The library may consist of thousands of compounds that are screened against the composition target. Such screening may assist to identify one or more compounds with the ability to introduce an idea about the composition of the extract mixture. In this study, by screening the mass spectra and fragmentation with the library, each spectrum matched with one structure with high probability >96%. Figures 6 and 7 show the mass spectra for the major compounds in the leaves extract.
3.6. Stems Extract
Stems were treated similarly as the leaves in all steps, starting from extraction up to injection in the GC mass spectrometer. Under the conditions described above, twelve compounds were detected as individual, sharp peaks, resolved from each other and readily quantified. Four peaks are major (>2% composition) and the other eight are minor, see table 2 for retention times, peak areas, percentages and assigned name of the component. Figure 8 shows the GC chromatogram for the stems extract. By screening the mass spectra and fragmentation with the library incorporated with the GC-mass spectrometer, each spectrum matched with one structure with high probability >96%.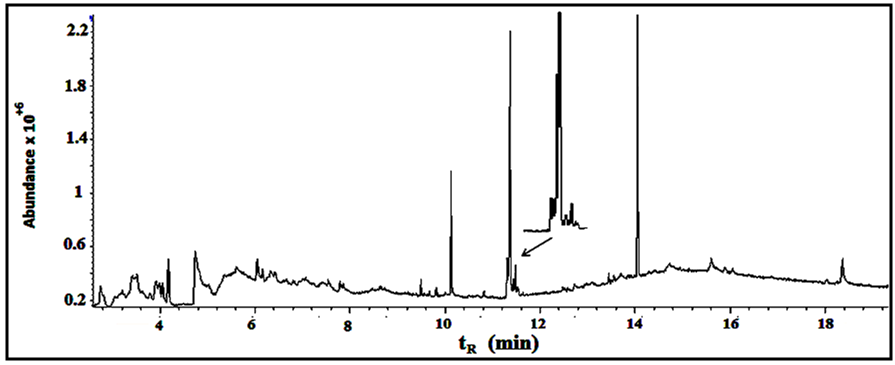 | Figure 8. The GC/MS chromatogram for the stems extract, split ratio 5:1 |
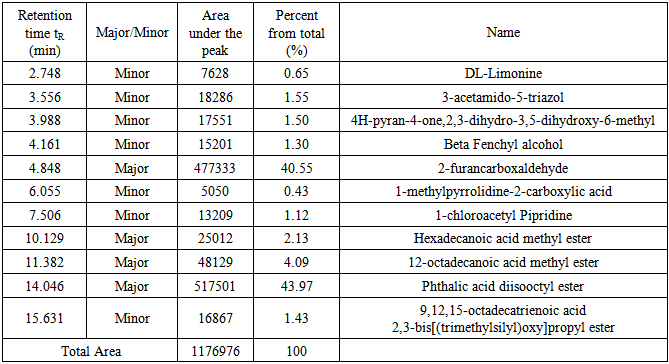
Table 2. Detail description of the components found in the stems extract
 |
| |
|
3.7. Roots Extract
Similarly, under the conditions described above eleven compounds were detected as individual, sharp peaks, resolved from each other and readily quantified. Four peaks are major (>2% composition) and the other seven are minor, see table 3 for retention times, peak areas, percentages and assigned name of the component. Figure 9 shows the GC chromatogram for the roots extract. By screening the mass spectra and fragmentation with the library incorporated with the GC-mass spectrometer, each spectrum matched with one structure with high probability >96%.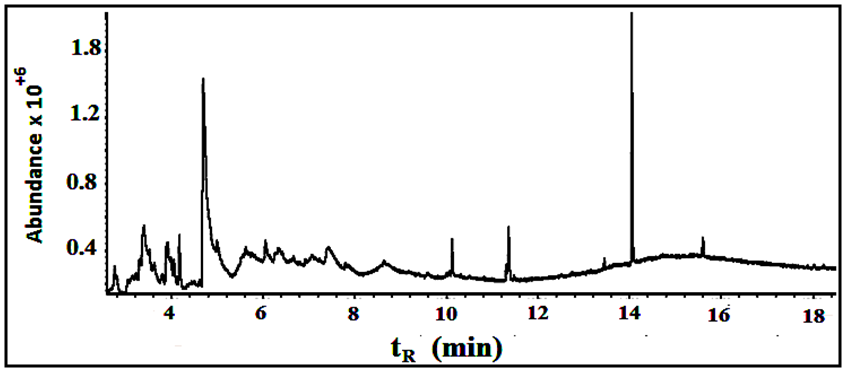 | Figure 9. The GC/MS chromatogram for the roots extract, split ratio 5:1 |
Table 3. Detail description of the components found in the roots extract
 |
| |
|
3.8. Synchronous Results and Comprehensive view
Fifteen peaks were observed in the chromatogram for the extract of the leaves. Six are major at retention times of 10.202, 11.318, 11.365, 11.446, 14.115 and 18.365 min. Twelve peaks were observed for the extract of the stems. Four are major at retention times of 4.755, 10.141, 11.367, 14.046 and 18.371 min. Eleven peaks were observed for the extract of the roots. Four are major at retention times of 4.848, 10.129, 11.382 and 15.631 min. Figure 10 shows the three chromatograms. Four major peaks in the stems extract are conjoint with those in the leaves extract. Three major peaks in the roots extract (tR=10.129, 11.382 and 15.631) are apparently consistent with those in the leaves and stems extracts. Accordingly, it is notable that the components are naturally distributed between the leaves, stems and the roots. Vitamin E, phthalic acid diisoctyl ester, 9,12,15- octadecantrienoic acid methyl ester, Hexadecandienoic acid methyl ester and 2-Furancarboxaldehyde are the major conjoint compounds in the three extracts. Different percent compositions for the major components were observed in the three extracts. The major and minor compounds in the extracts include terpenes, acyclic diterpene alcohol, triazoles, furans, saturated and unsaturated fatty acids methyl esters, α-Tocopherol and others.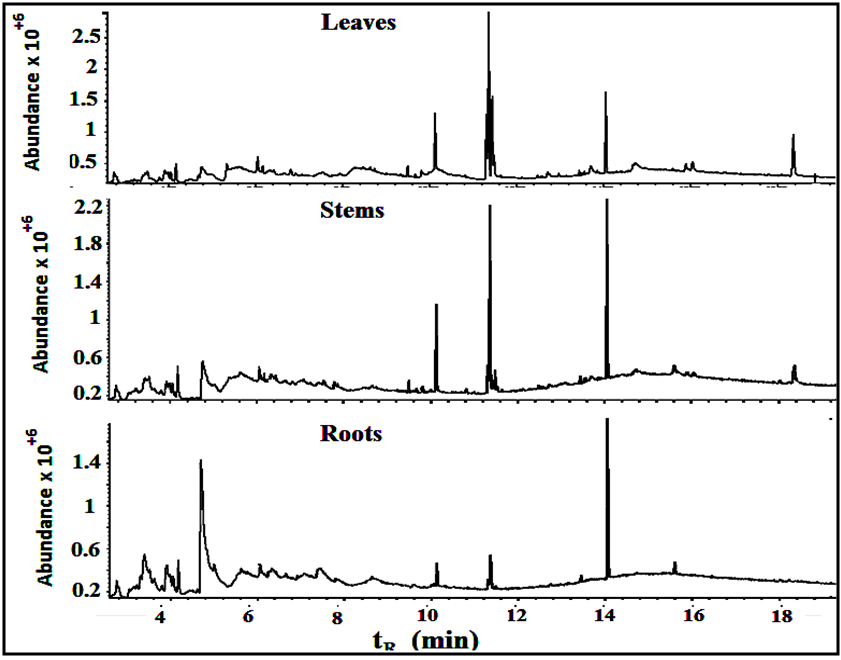 | Figure 10. The GC/MS chromatograms for leaves, stems and roots extracts, split ratio 5:1. The figure was built for comparison issue to get a clear vision about the conjoint peaks |
3.9. The Major Coumpounds
Vitamin E in Rubus Fruticosus (an α-Tocopherol) (Figure 11F) has a peak in the leaves and the stems extracts of Rubus Fruticosus chromatograms at a retention time around 18.3 min. Vitamin E was found to be a major component in the two extracts with a percent of 10.5 and 1.69%, respectively. It was observed that vitamin E is completely disappeared from the root extract. The mass spectrum of vitamin E is presented in figure 7C. This can support the traditional usage of this plant to reduce pain and cure some diseases [3-10]. Phthalic acid diisooctyl ester in Rubus Fruticosus (an aromatic dicarboxylate) (Figure 11 A) has a peak in the leaves, the stems and the roots extracts of Rubus Fruticosus chromatograms at a retention time around 14.1 min. Diisooctyl phthalate was found to be a major component in the three extracts with a percent of 15.96, 38.20 and 43.97%, respectively. The mass spectrum is presented in figure 7B. 9, 12, 15-octadecantrienoic acid methyl ester (Figure 11B) is an unsaturated fatty acid methyl ester that has a peak in the leaves, the stems and the roots extracts of Rubus Fruticosus chromatograms at retention time around 11.38 min. It was found to be a major component in the three extracts with a percent of 31.93, 33.30 and 4.09%, respectively. The mass spectrum is presented in figure 6C.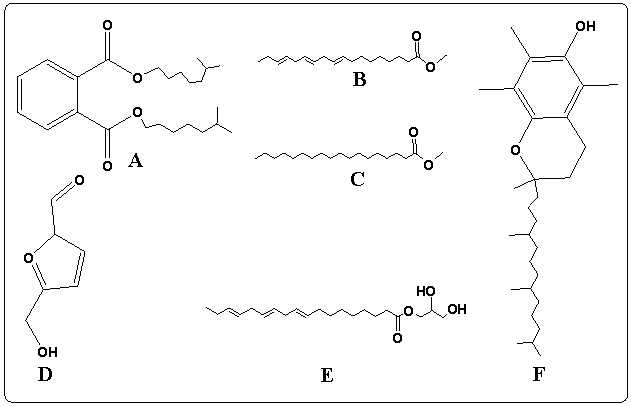 | Figure 11. The chemical structure of major compounds in the extracts of Rubus Fruticosus. A) Diisooctyl phthalate B) 9, 12, 15-octadecantrienoic acid methyl ester C) Hexadecandienoic acid methyl ester D) 2-Furancarboxaldehyde E) 9, 12, 15-octadecantrienoic acid propylene diol F) Vitamin E |
Hexadecandienoic acid methyl ester (Figure 11C) in Rubus Fruticosus is an unsaturated fatty acid methyl ester that has a peak in the leaves, the stems and the roots extracts of Rubus Fruticosus chromatograms at retention time around 10.2 min. It was found to be major in the three extracts with a percent of 11.28, 18.44 and 2.13 respectively from the total. The mass spectrum is presented in figure 6C.2-Furancarboxaldehyde has a peak in the root extracts of Rubus Fruticosus chromatogram at a retention time around 4.848 min. 2-Furancarboxaldehyde (Figure 11D) was found to be major in the extract with a percent of 40.55 from the total. It was observed that 2-Furancarboxaldehyde is completely absent from the leaves and the stems extract. The mass spectrum of 2-Furancarboxaldehyde is presented in figure 12.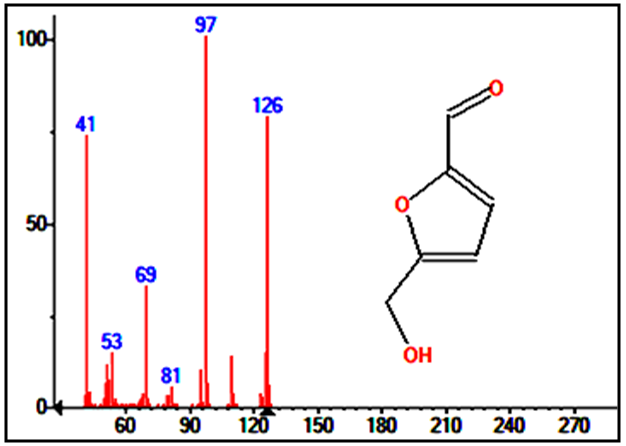 | Figure 12. Mass spectrum for the major peak (2-Furancarboxaldehyde) in the roots extract |
Splitless mode was employed in parallel to split mode and both injection modes were compared and found to produce fingerprint chromatograms with enlargement of peaks in the splitless mode, see figures 10 and 13. No new peaks were appeared in the chromatograms which assures the split mode results.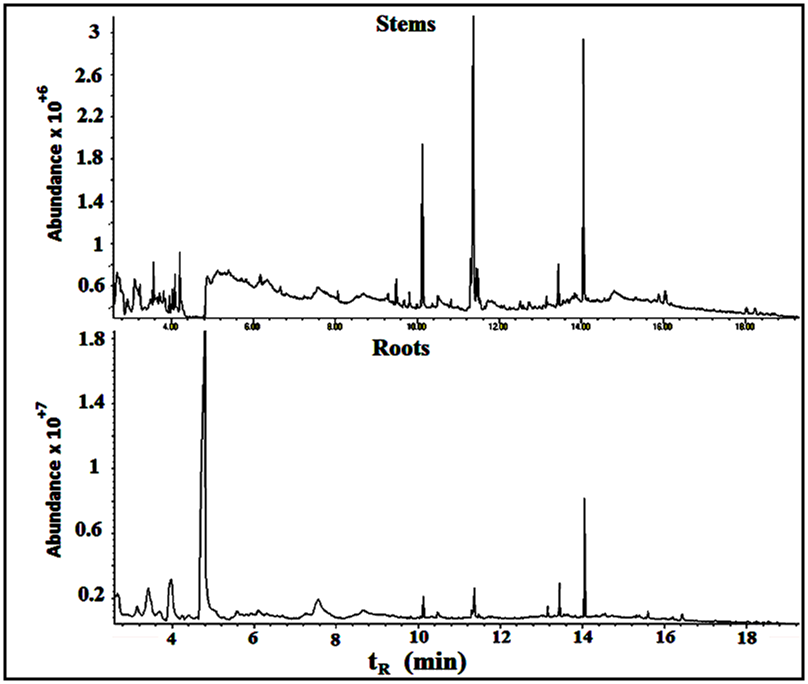 | Figure 13. The GC/MS chromatograms for splitless injections of stems and roots extracts |
3.10. Correlation between GC/MS and HPLC/PDA Results
It is interesting to track the chromatograms that resulted from a sample that measured with two different methods. Both chromatograms have separated peaks but are not identical. In this study, the HPLC results are compared to those in GC/MS result. For example, in leaves extract, eight peaks were observed in the HPLC chromatogram while fifteen peaks appeared in the GC/MS chromatogram. This is expected, as the GC/MS method depends on molar mass only and has lower limit of detections. The major compounds in both measurements can be easily observed.
4. Conclusions
The natural products in the leaves, stems and roots of Rubus Fruticosus plant were extracted and analyzed separately. Six major compounds are found in the leaves extract, four major compounds are found in the stems and the roots extracts. The major and minor compounds include terpenes, acyclic diterpene alcohol, triazoles, furans, saturated and unsaturated fatty acids methyl esters, α-Tocopherol and others. GC/MS method was used for the identification of the extracted compounds with help of the library that packed with the instrument. Split and splitless modes are applied to the gas chromatograph. Similar results were obtained with enlargement of the peaks in the splitless mode. HPLC/PDA method was used in parallel to the GC/MS method. The two instrumental methods produce sharp, resolved and accurately quantified peaks. Vitamin E, phthalic acid diisoctyl ester, 9,12,15-octadecantrienoic acid methyl ester, Hexadecandienoic acid methyl ester, 2-Furancarboxaldehyde are the conjoint compounds found in the extracts of leaves, stems and roots. Different percent compositions for the major components were observed in the three extracts. The components are naturally distributed between the leaves, stems and roots. The presence of the constituents was also found to be similar to those reported for most medicinal plants. The plant is traditional used in medicines for the treatment of different forms of pains and as a natural cure.
ACKNOWLEDGMENTS
The authors would like to thank Tafila Technical University for financial support. Thanks are also extended to Mr. Ayed khlaf Al-Amro for his valuable idea to use the plant to cure leg joints pain that motivated the group to perform this work.
References
| [1] | Ali, L.; Svensson, B.; Alsanius, B.W. and M.E. Olsson. 2011. Cassia oil for controlling plant and human pathogens on fresh strawberries. Sci Horticult 129(3):376-381. |
| [2] | Altnature.com 2013. Blackberry Herbal Use and Medicinal Properties. Available from:http://www.altnature.com/gallery/Blackberry.htm [Last accessed on 2013 Sep 06]. |
| [3] | Antonius, K. and H. Nybom. 1994. DNA fingerprinting reveals significant amounts of genetic variation in a wild raspberry Rubus idaeus population. Molec Ecol 3:177-180. |
| [4] | Bailey, C.J. and C. Day. 1989. Traditional plant medicines as treatments for diabetes. Diab Care 12:553-64. |
| [5] | Dunand, C.; Gautier, C.; Chambat, G. and Y. Liénart. 2000. Characterization of the binding of α-l-Fuc (1→2)-β-d-Gal (1→), a xyloglucan signal, in blackberry protoplasts. Plant Sci 151(2):183-192. |
| [6] | Elisia, I.; Hu, C.; Popovich, D.G. and D.D. Kitts. 2007. Antioxidant assessment of an anthocyanin-enriched blackberry extract. Food Chem 101(3):1052-1058. |
| [7] | Gairola, S.; Sharma, J. and Y.S. Bedi. 2014. A cross-cultural analysis of Jammu, Kashmir and Ladakh (India) medicinal plant use. J Ethnopharm 155(2):925-986. |
| [8] | Gomar, A.; Hosseini, A. and N. Mirazi. 2014. Preventive effect of Rubus fruticosus on learning and memory impairment in an experimental model of diabetic neuropathy in male rats. Pharm Nutr 2(4):155-160. |
| [9] | Hassimotto, N.M.; Genovese, M.I. and F.M. Lajolo. 2009. Antioxidant capacity of Brazilian fruit, vegetables and commercially-frozen fruit pulps. J Food Comp Anal 22(5):394-396. |
| [10] | herbsrainbear.com 2013. Alternatives from nature by rainbear, Inc.; 1995-10. Available from:http://herbsrainbear.com/encylopedia/blackberry.htm [Last accessed on 2013 Sep 04]. |
| [11] | Işik, E.; Şahin, S.; Demir, C. and C. Türkben. 2011. Determination of total phenolic content of raspberry and blackberry cultivars by immobilized horseradish peroxidase bioreactor. J Food Comp Anal 24(7):944-949. |
| [12] | Lee, J.; Dossett, M. and C.E. Finn. 2012. Rubus fruit phenolic research: The good, the bad, and the confusing. Food Chem 130(4):785-796. |
| [13] | liveandfeel.com 2014. Live and Feel, Inc.c2014. Available from: http://www.liveandfeel.com/vegetables/blackberry.htm [Last accessed on 2013 Aug 28]. |
| [14] | Marquina, M.A.; Corao, G.M.; Araujo, L.; Buitrago, D. and M. Sosa. 2002. Hyaluronidase inhibitory activity from the polyphenols in the fruit of blackberry (Rubus fruticosus B.). Fitoterap 73(7–8):727-729. |
| [15] | Martini, S.; Addario, C.D.; Colacevich, A.; Focardis, S.; Borghini, F.; Santucci, A.; Figura, N. and C. Rossi. 2009. Antimicrobial activity against Helicobacter pylori strains and antioxidant properties of blackberry leaves (Rubus ulmifolius) and isolated compounds. Int J Antimicrob Ag 34:50-59. |
| [16] | Rosa, C.G.; Borges, C.D.; Zambiazi, R.C.; Rutz, J.K.; Luz, S.R.; Krumreich, F.D.; Benvenutti, E.V. and M.R. Nunes. 2014. Encapsulation of the phenolic compounds of the blackberry (Rubus fruticosus). LWT - Food Sci Tech 58(2):527-533. |
| [17] | Sarkar, A. and S.N. Ganguly. 1978. Rubitic acid, a new triterpene acid from Rubus fruticosus. Phytochem 17(11):1983-1985. |
| [18] | Sauter, C.and C. Wolfensberger. 1989. Anticancer activities as well as antiviral and virus-enhancing properties of aqueous fruit extracts from fifty-six European plant species. Eur J Cancer Clin Oncol 25(6):987-990. |
| [19] | Tobyn, G.; Denham, A. and M. Whitelegg. 2011. CHAPTER 26 – Rubus idaeus, raspberry. Med Herbs. 271-282. |
| [20] | Verma, R.; Gangrade, T.; Punasiya, R. and C. Ghulaxe. 2014. Rubus fruticosus (blackberry) use as an herbal medicine. Pharmacog Rev 8(16):101-104. |
| [21] | Wang, S.Y. and H.S. Lin. 2000. Antioxidant activity in fruits and leaves of blackberry, raspberry, and strawberry varies with cultivar and developmental stage. J Agric Food Chem 48:140-6. |
| [22] | Yang, H.; Hewes, D.; Salaheen, S.; Federman, C. and D. Biswas. 2014. Effects of blackberry juice on growth inhibition of foodborne pathogens and growth promotion of Lactobacillus. Food Cont 37:15-20. |
 Abstract
 Reference
 Full-Text PDF
 Full-text HTML