-
Paper Information
- Paper Submission
-
Journal Information
- About This Journal
- Editorial Board
- Current Issue
- Archive
- Author Guidelines
- Contact Us
Advances in Analytical Chemistry
p-ISSN: 2163-2839 e-ISSN: 2163-2847
2015; 5(2): 25-30
doi:10.5923/j.aac.20150502.01
Amperometric Determination of Hydrogen Peroxide at a Silver Electrode Fabricated from a Recycled Compact Disc
Chris Maynard , Kevin C. Honeychurch
Centre for Research in Biosciences, Faculty of Health & Life Sciences, University of the West of England, Frenchay Campus, Bristol, UK
Correspondence to: Kevin C. Honeychurch , Centre for Research in Biosciences, Faculty of Health & Life Sciences, University of the West of England, Frenchay Campus, Bristol, UK.
| Email: |  |
Copyright © 2015 Scientific & Academic Publishing. All Rights Reserved.
This present study investigates the utilisation of Ag electrodes fabricated from recycled recordable compact discs (CD-R) for the amperometric determination of hydrogen peroxide. The analytical curve was linear up to at least 30 mM hydrogen peroxide with a sensitivity of 21.89 µA/mM over this range. A corresponding detection limit of 17.7 µM, based on a signal-to-noise ratio of three was recorded. The developed electrode represents a simple, inexpensive, reliable method for the determination of hydrogen peroxide, avoiding extended and complex multi-step fabrication as it is readily fabricated from recycled materials. It has a number of potential applications, including environmental, industrial, physiological and home security, especially where single use and disposability could be beneficial.
Keywords: Compact Disc, Silver Electrode, Voltammetry, Amperometry
Cite this paper: Chris Maynard , Kevin C. Honeychurch , Amperometric Determination of Hydrogen Peroxide at a Silver Electrode Fabricated from a Recycled Compact Disc, Advances in Analytical Chemistry, Vol. 5 No. 2, 2015, pp. 25-30. doi: 10.5923/j.aac.20150502.01.
Article Outline
1. Introduction
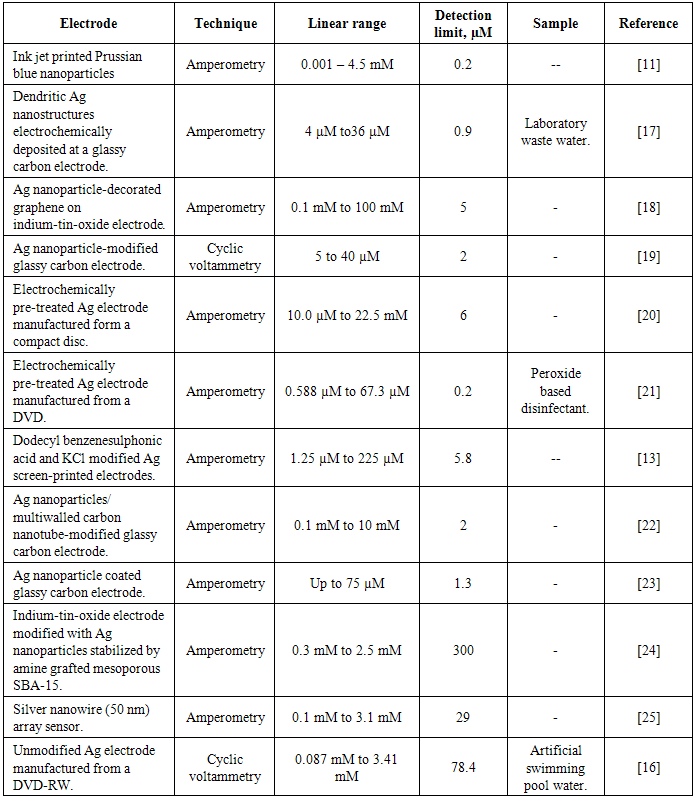
- Hydrogen peroxide is widely used industrially for the bleaching of products such as paper and cloth, in chemical synthesis, metallurgy, electronics, detergents, waste water treatment [1], as a disinfectant [2] and as an oxidant source in fuel cells [3]. A number of other applications, such as fuel for rockets [4] and similar devices [5] are commonly reported. It also is a by-product of several enzyme-catalysed reactions and is used in food, environmental, pharmaceutical, clinical and industrial analyses. A great deal of interest is also focused on its detection as it is commonly employed in range of oxidase based biosensors as an indirect method to determine analytes such as blood glucose levels and lactate [6]. Recently, the detection of hydrogen peroxide has become important in other areas, such as disease diagnosis [7] the detection of peroxide based explosives [8]. Electrochemistry offers an attractive approach for the determination of hydrogen peroxide. The decomposition and reduction of hydrogen peroxide are thermodynamically favourable, but are however, kinetically unfavourable and tend to require a catalyst or a large electrochemical over-potential. Biological catalysts such as peroxidase [9] and catalase [10] enzymes have been shown to allow for the reduction of hydrogen peroxide at lower over-potentials. However, these have a number of drawbacks as they can be difficult and expensive to isolate and purify and can be unstable. A number of different non-biological catalysts have been investigated for the reduction of hydrogen peroxide, such as Prussian blue [11], cobalt phthalocyanine [12], metallic silver [13] and platinum [14]. However, precious metals, such as Ag are particularly expensive and can become easily poisoned. A number of these more recent applications are summarised in table 1.
|
2. Materials and Methods
2.1. Apparatus
- Cyclic voltammetry and amperometry in stirred solution were performed with a µAutolab potentiostat interfaced to a PC for data acquisition via the General Purpose Electrochemical System Software Package (GPES) version 4.3 (Autolab, Windsor Scientific Limited, Slough Berkshire UK). The voltammetric cell contained a graphite rod counter electrode, a saturated calomel electrode (SCE) (Russell, Fife, UK) and a silver electrode fabricated as described in section 2.3 as the working electrode. The electrode was then connected to the potentiostat using a crocodile clip attached to coaxial cable inserted into the appropriate sockets. The cell used for the voltammetric measurements was obtained from Metrohm (Switzerland); a small magnetic stirrer bar was placed in the bottom of the cell for stirring during amperometric investigations. This was rotated at a fixed constant rate by a rotary magnetic stirrer (Hanna Instruments).
2.2. Chemical and Reagents
- All chemicals were supplied from Fisher (Loughborough, UK), unless stated otherwise. A 14.7 mM hydrogen peroxide stock solution was prepared by dissolving the appropriate volume in deionised water. Working standards, for optimisation of studies, were then prepared by dilution of the primary stock solution with deionised water. Deionised water was obtained from a Purite RO200–Stillplus HP System, (Purite Oxon, UK). Solutions of disodium, trisodium, sodium o-phosphate and o-phosphoric acid were made at a concentration of 0.2 M by dissolving the appropriate mass in deionised water. These were then titrated together, to give the desired pH. An appropriate volume was then added directly to the voltammetric cell and diluted with sufficient deionised water to give an overall phosphate concentration of 0.1 M.
2.3. Working Electrode Fabrication
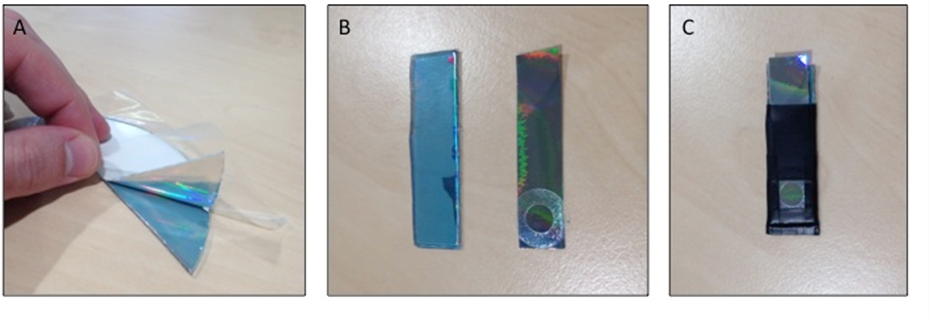
- The layer of silver required for the working electrode was obtained from a Verbatim recordable compact disc. The fabrication process is shown in Figure 1. The silver layer was removed by the application of sticky-backed plastic to top layer of disc. The silver layer was then cut with scissors to an appropriate size and the surface area of the electrode was defined using a plastic hole-reinforcer. This was then affixed to a piece of polycarbonate (base of compact disc) of the same size using electrical insulation tape. The remainder of the electrode was enclosed in electrical insulation tape, leaving an exposed pad at the opposite end for contact to be made to the potentiostat.
2.4. Cyclic Voltammetry
- Cyclic voltammograms were initially recorded in plain solutions 0.1 M of phosphate buffer, and then in the same solution containing 2 mM of hydrogen peroxide. An initial and final potential of 0.0 V and a switching potential of 1.0 V. The effect of scan rate was investigated over the range 20 to 200 mV/s.
2.5. Optimisation of the Amperometric Potential
- In order to deduce the optimum applied potential for calibration studies, amperometric measurements were made at various potentials in a solution containing 2.0 mM hydrogen peroxide 120 s after the application of each potential. This was achieved by transferring a 10 ml aliquot of hydrogen peroxide solution to the cell, stepping the potential from -0.2 V to 1.0 V in stepping in 100 mV steps. The resulting data was used to plot a voltammogram from which we could identify the optimum potential to be used in further amperometric studies.
3. Results and Discussion
3.1. Cyclic Voltammetry
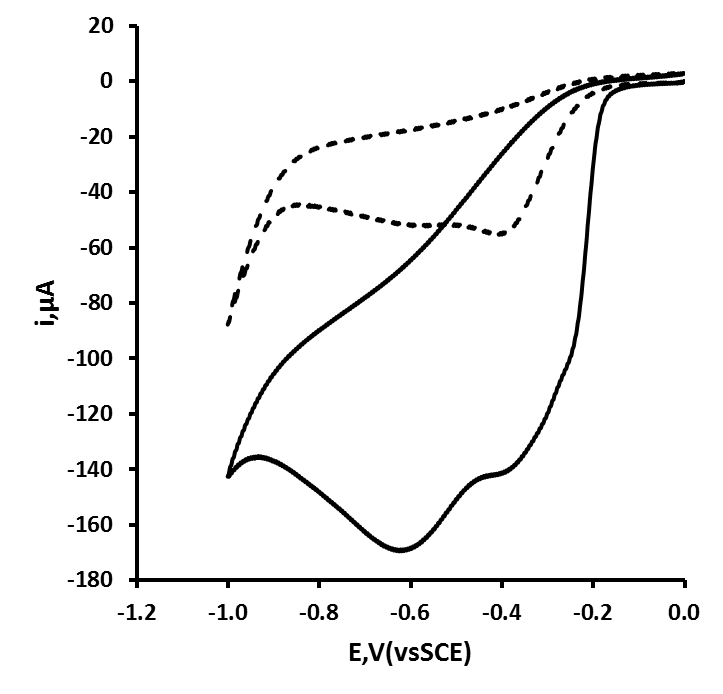
- Previously [16], we have shown that similar cyclic voltammetric behaviour can be obtained at our Ag CD-R electrodes to that reported at conventional more expensive Ag electrodes. Figure 2 shows a typical cyclic voltammograms obtained in the presence and absence of 2 mM hydrogen peroxide, using a supporting electrolyte of 0.1 M pH 7.0 phosphate buffer. The voltammogram was predominated by reduction peak, with an Ep of 0.70 V, with a smaller more positive peak at 0.20 V. Consequently, we believe that these reduction peak results from the same 2e, 2H+ reduction processes (eq. (1) and (2)).
 | (1) |
 | (2) |
 | (3) |
 | (4) |
 | (5) |
3.2. Hydrodynamic Voltammetry
- Figure 3 shows the hydrodynamic voltammogram obtained in the absence and presence of 2 mM hydrogen peroxide at the Ag CD-R electrode. The background current observed in the absence of hydrogen peroxide was found to increase with increasing negative potential until a plateau was recorded at 0.5 V. In the presence of 2 mM hydrogen peroxide, the reduction currents were found to be greater than the background over the entire potential range studied and plateaued at potentials more negative than 0.6 V. As this operating potential showed a good signal to noise ratio with a short settling time, an applied potential of 0.6 V was selected for further studies.
3.3. Calibration Study
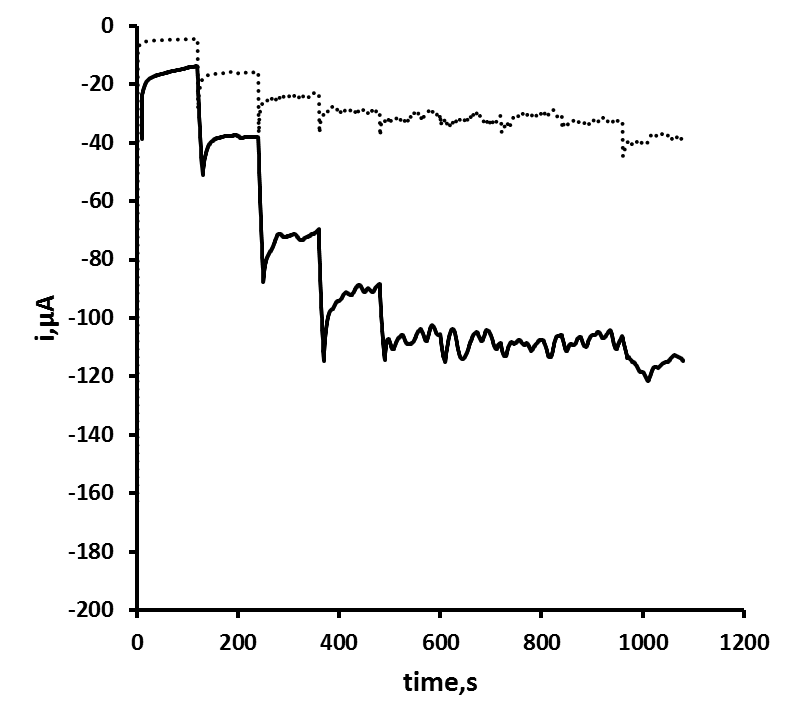
- Figure 3 shows the typical amperometric response obtained in stirred solution for the addition of replicate volumes of a standard hydrogen peroxide solution. The calibration plot (Figure 4) was linear up to 30 mM hydrogen peroxide with a sensitivity of 21.89 µA/mM over this range. A corresponding detection limit of 17.7 µM based on a signal-to-noise ratio of three was recorded.
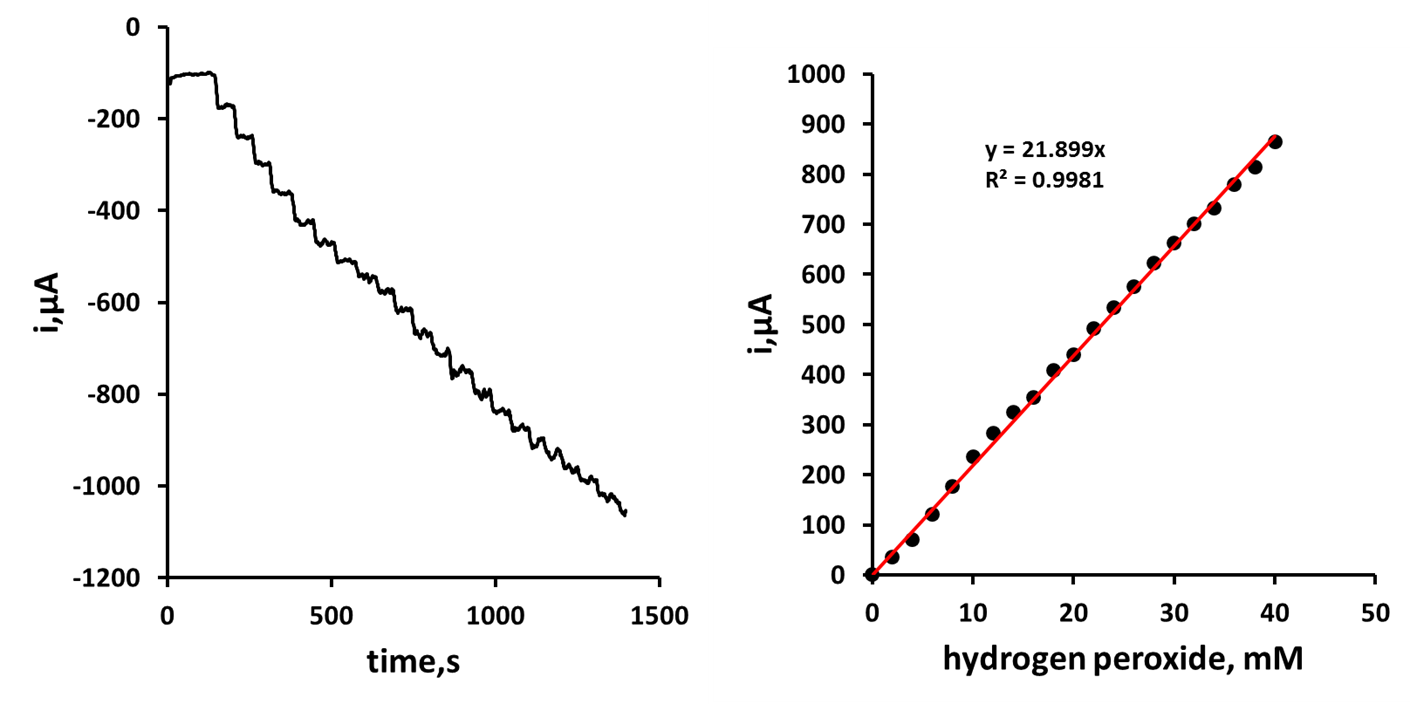 | Figure 4. Amperogram obtained in stirred solution for additions of hydrogen peroxide equivalent to 2.5 mM |
4. Conclusions
- Amperometric quantification of hydrogen peroxide has been shown to be possible at Ag electrode manufactured from an unmodified CD-R. Amperometry in stirred solution was performed with our Ag CD-R at different concentrations of hydrogen peroxide. Steady state behaviour was observed for each concentration investigated over the range 2 to 30 mM. The steady state current was found to be linearly related with hydrogen peroxide concentration over the range 2 mM - 30 mM in 0.1 M phosphate buffer pH 7 at an applied potential of 0.6 V (vs. SCE). A limit of detection of 17.7 µM (based on a signal-to-noise ratio of three) was recorded. These performance characteristics compare well with a number of previously reported methods (table 1). Our detection limit was over four times lower than our previous reported application of these electrodes utilising cyclic voltammetry [16]. It is also better than that obtained by some more complex approaches; such as Ag nanoparticle modified indium-tin-oxide electrodes [24] or that obtained at Ag nanowire array sensors [25]. The developed electrode represents a simple, inexpensive and reliable method for the determination of hydrogen peroxide, avoiding long and complicated multi-step fabrication procedures which are commonly reported (table 1) for these devices. It has a number of potential applications, such as for environmental, industrial, physiological and homeland security analysis, especially where single use and disposability are beneficial.
ACKNOWLEDGEMENTS
- We would like to thank the University of the West of England for funding.
 Abstract
 Reference
 Full-Text PDF
 Full-text HTML