-
Paper Information
- Paper Submission
-
Journal Information
- About This Journal
- Editorial Board
- Current Issue
- Archive
- Author Guidelines
- Contact Us
Advances in Analytical Chemistry
p-ISSN: 2163-2839 e-ISSN: 2163-2847
2014; 4(1): 1-8
doi:10.5923/j.aac.20140401.01
Validated Bivariate Calibration Spectrophotometric and High Performance Liquid Chromatographic Methods for Simultaneous Determination of Dantrolene Sodium and Paracetamol in Pharmaceutical Dosage Form
 Abstract
 Reference
 Full-Text PDF
 Full-text HTML
Noha S. Rashed1, Ola M. Abdallah1, Rabie S. Farag2, Sanaa S. Awad1
1Analytical Chemistry Department, Faculty of Pharmacy (Girls), Al-Azhar University, Cairo, Egypt
2Chemistry Department, Faculty of Science (Boys), Al-Azhar University, Cairo, Egypt
Correspondence to: Noha S. Rashed, Analytical Chemistry Department, Faculty of Pharmacy (Girls), Al-Azhar University, Cairo, Egypt.
| Email: |  |
Copyright © 2014 Scientific & Academic Publishing. All Rights Reserved.
Two simple and sensitive methods were developed for simultaneous determination of dantrolene sodium and paracetamol without previous separation. The first method is a bivariate calibration algorithm involving the use of data from four linear regression calibration equations, two calibrations for each component at two selected wavelengths; 250 nm and 290 nm. The second method describes the use of high performance liquid chromatography (HPLC), in which separation was performed using reversed phase C18 column and a mobile phase composed of methanol: potassium dihydrogen phosphate (50:50 v/v) adjusted to pH 3.5 by phosphoric acid, with flow rate of 1 ml min-1 and UV detection at 380 nm for dantrolene sodium and 248 nm for paracetamol. Beer’s law was obeyed in the concentration range of 1-16 and 1-15 μg mL-1 for dantrolene sodium and paracetamol respectively by bivariate method. While the linearity ranges was found to be 0.5-15 and 2.5-120 μg mL-1 for dantrolene sodium and paracetamol by HPLC method. The proposed methods were successfully applied for the determination of the two cited drugs in their pharmaceutical preparation with mean recoveries ranging from 99.5 – 100.6+ 0.94 -2.16%. In addition, results were validated as per International Conference on Harmonization (ICH) guidelines.
Keywords: Dantrolene sodium, Paracetamol, Bivariate, High performance liquid chromatography, Validation
Cite this paper: Noha S. Rashed, Ola M. Abdallah, Rabie S. Farag, Sanna S. Awad, Validated Bivariate Calibration Spectrophotometric and High Performance Liquid Chromatographic Methods for Simultaneous Determination of Dantrolene Sodium and Paracetamol in Pharmaceutical Dosage Form, Advances in Analytical Chemistry, Vol. 4 No. 1, 2014, pp. 1-8. doi: 10.5923/j.aac.20140401.01.
Article Outline
1. Introduction
- Dantrolene sodium (DT) is a direct acting skeletal muscle relaxant, probably inhibit the release of calcium from sarcoplasmic reticulum of skeletal muscle, chemically described as 1 (5- (p-nitrophenyl) furfurylidene) amino) hydantoin sodium salt hemiheptahydrate [1].Paracetamol (PR) is an analgesic, antipyritic and of weak anti-inflammatory activity, chemically described as N-(4-Hydroxy phenyl)-acetamide [1]; Figure (1).
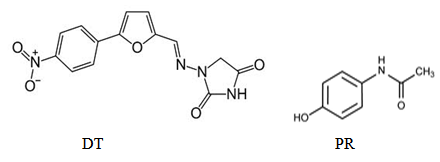 | Figure 1. Chemical structures of DT and PR |
2. Experimental
2.1. Apparatus
- -HP 1050 MWD series isocratic quaternary pump HPLC instrument (Thermo, U.S.A.) connected to 1050 multiple wavelength-UV detector. Separation was performed on BDS HYPERSIL-C18 column (150 x 4.6mm i.d., 5µm particle size). Chromatographic peaks were electronically integrated and recorded using Chemstation software (Germany).- Shimadzu, UV-V is 1601 PC spectrophotometer (Tokyo, Japan).
2.2. Samples
2.2.1. Pure Samples
- - DT pure sample was kindly supplied by Chemipharm pharmaceutical industries. Its purity was found to be 100.7% as referred by the supplier.- PR pure sample was kindly supplied by Egyptian Co. for pharmaceutical and chemical industries. Its purity was found to be 100% as referred by the supplier.
2.2.2. Market Samples
- Dantrelax compound® capsules; batch no.121031A, labeled to contain 25 mg DT and 300 mg PR, manufactured by Chemipharm pharmaceutical industries.
2.3. Chemicals and Reagents
- All reagents used were of analytical grade and solvents were of spectroscopic grade. Distilled water was used throughout the work. - Methanol, HPLC grade (Sigma-Aldrich Chemie, Germany; Fischer scientific, USA) and analytical grade (Suvchem).- Potassium dihydrogen phosphate and ortho-phosphoricacid (Sigma-Aldrich, Germany).
2.4. Standard Solutions
- - Standard stock solutions of the drugs (1mg mL-1) were prepared by dissolving 50 mg of DT or PR in 50 ml methanol.-Working standard solutions of DT and PR were prepared by further dilution of standard stock solution with methanol as appropriate to obtain the working concentration range.
2.5. Procedures
2.5.1. Bivariate Method
2.5.1.1. Construction of Calibration Curve
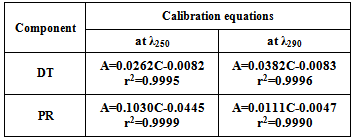
- Into two separate sets of 10 ml volumetric flasks, aliquots of the standard DT solution (0.1 mg mL-1) containing 10-160 μg mL-1 drug were transferred separately into one set of the volumetric flasks. Into the other set, aliquots of the standard PR solution (0.1 mg mL-1) containing 10-150 μg mL-1 were transferred, then both sets was diluted to volume with methanol. The spectra of the prepared solutions were recorded in the range of 200-400 nm. Calibration curves at different wavelengths 230-290 nm at 10 nm interval were constructed. The regression equations and the sensitivity matrices K were calculated; Table (1), from which the optimum pair of wavelengths to carry out the determination and the four regression equations used in the bivariate algorithm were investigated; table (2).
2.5.1.2. Assay of Laboratory Prepared Mixture
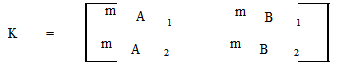
- Different aliquot volumes of DT and PR (0.1 mg mL-1) were transferred into a series of 10 ml volumetric flasks and diluted to the volume with methanol. The spectra of the prepared solutions were recorded at 250 and 290 nm.The concentrations of the two drugs were calculated using the following equations [18]:CA = (AAB1-eAB1-mB1CB)/mA1CB = [mA2(AAB1–eAB1)+mA1(eAB2–AAB2)]/mA2mB1–mA1mB2Where CA, CB are the concentration of component A (DT), component B (PR); mA1, mA2 are the slope values of DT at λ1, λ2; mB1, mB2 are the slope values of PR at λ1, λ2; AAB1, AAB2 are the absorbance of the binary mixture at λ1, λ2; eAB1, eAB2 are the sum of the intercepts of DT and PR at λ1 and λ2, respectively.
2.5.2. HPLC Method
2.5.2.1. Chromtographic Conditions
- At room temperature, the chromatographic separation was performed on BDS HYPERSIL C18 column (150 x 4.6 mm i.d, 5µm particle size) using a mobile phase of methanol: 0.025M potassium dihydrogen phosphate (50: 50 v/v ) adjusted by ortho-phosphoric acid to pH 3.5. The mobile phase was pumped at flow rate 1ml min-1 for at least 30 minutes before injecting the drug solutions to equilibrate the chromatographic column. The injected volume was 10 μl and the eluents were monitored at 380 nm for DT and 248 nm for PR.
2.5.2.2. Construction of Calibration Curve
- Aliquots of standard drug solution (0.1mg mL-1) containing 5-150 μgmL-1 of DT were introduced into a series of 10 ml volumetric flasks. Into another set of 10 ml volumetric flasks, aliquots of standard drug solution (0.5mg mL-1) containing 25-1200 μgmL-1 of PR were introduced. Both sets were adjusted to the volume with methanol. Triplicate 10 μL injections were made for each concentration and chromate graphed under the specified chromatographic conditions described previously. The Peak area of each concentration was plotted against the corresponding concentration to obtain the calibration graph of DT and PR.
2.5.2.3. Assay of Laboratory Prepared Mixture
- Different aliquots of DT (0.1 mg mL-1) and PR (0.5mg mL-1) were introduced into a series of 10 ml volumetric flasks, and then adjusted to the volume with methanol. 10μL of each obtained solution was injected into the HPLC column and the corresponding chromatograms were monitored at 380 nm for DT and at 248 nm for PR using the same previous chromatographic conditions. The concentration of each drug in the prepared mixtures was calculated from the regression parameters.
2.5.3. Application to Pharmaceutical Dosage Form
- The contents of ten Dantrelax compound® capsules each labeled to contain 25 mg DT and 300 mg PR were evacuated carefully, mixed and weighed. An accurately weighed quantity of the powder equivalent to one capsule content was introduced into a 100 ml volumetric flask, extracted and diluted to volume with methanol. The solution was filtered, 1 ml of the clear filtrate was transferred to 25 ml volumetric flask and diluted to volume with methanol to obtain solution labeled to contain 0.01 mg mL-1 of DT and0.12 mg mL-1 of PR to be analysed by bivariate and HPLC methods. The drug concentrations were calculated from the appropriate regression parameters.
3. Results and Discussion
- Two different analytical procedures were developed; bivariate and HPLC methods aiming for the simultaneous determination of DT and PR.
3.1. Bivariate Method
- Bivariate calibration spectrophotometric method is a direct method which has been proposed for the resolution of binary mixtures. The principle of bivariate calibration is the measurement of two components (A and B) at two selected wavelengths (λ1 and λ2) to obtain two equations [18, 19]:AAB1 = mA1CACB + eAB1AAB2 = mA2CACB + eAB2The resolution of each equation set allows the evaluation of CA and CB values according to the previously mentioned equations.This simple mathematic algorithm allows the resolution of the two components by measuring the absorbance of their mixture at the two selected wavelengths and using the parameters of the linear regression functions evaluated individually for each component at the same wavelengths. In order to apply the bivariate method in the resolution of DT and PR, the absorbance of the two components at several different selected wavelengths was recorded in the region of overlapping; from 230 to 290 nm at 10 nm interval. The calibration curve equations and their respective linear regression coefficients were obtained directly with the aim of ensuring that there was a linear relationship between the absorbance and the corresponding concentration. All of the calibration curves at the selected wavelengths showed a satisfactory linear regression coefficient (r2> 0.9990).According to Kaiser Method [18], the slope values of the linear regression equations for both DT and PR at the selected wavelengths were used to calculate the sensitivity matrices K to find out the optimum pair of wavelength at which the binary mixtures were recorded as shown in table (1).
|
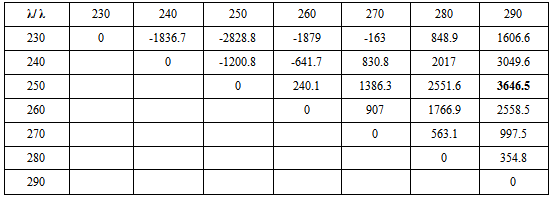
 For the bivariate determination of DT and PR 250and 290 nm were found to give the maximum value of K and thus can be used for the analysis; Figure (2). The linear regression formulas used for the bivariate algorithm were presented in table (2).
|
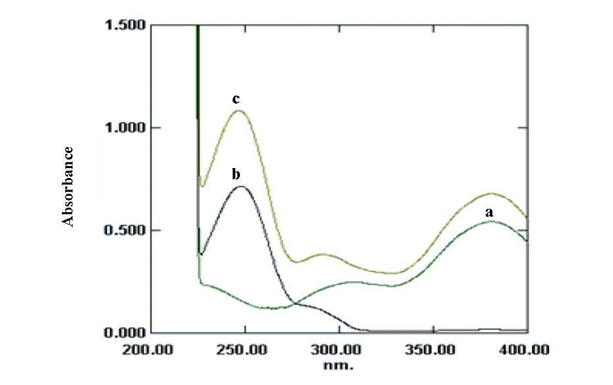 | Figure 2. Absorption spectra of 8μg mL-1 DT (a), 9μg mL-1 PR (b) and (10/10μgmL-1) mixture of both drugs (c) in methanol |
3.2. HPLC Method
- The proposed HPLC procedure was developed for the simultaneous determination of DT and PR. Different conditions affecting the chromatographic separation were optimized. The composition of the mobile phase was studied by trying acetonitrile - 0.025 M potassium dihydrogen phosphate and methanol - 0.025 M potassium dihydrogen phosphate in different ratios. Best peak shape and adequate separation of the two drugs was obtained by using methanol - 0.025 M potassium dihydrogen phosphate (50: 50 v/v) adjusted to pH 3.5 by ortho-phosphoric acid as mobile phase. Different flow rates (0.8-1.5 ml min-1) were tested; good resolution was obtained using 1 ml min-1. Four wave lengths were tried (214, 248, 254 and 380 nm), much sensitive detector response was obtained at 380 nm for DT and 248 nm for PR. Under the described HPLC parameters, the peak of DT was well resolved from the peak of PR and developed at retention time of 8.04 minutes for DT and 2.9 minutes for PR; Figure (3). System suitability test was performed in accordance with USP [20] to ensure system performance before or during the analysis of the drugs.
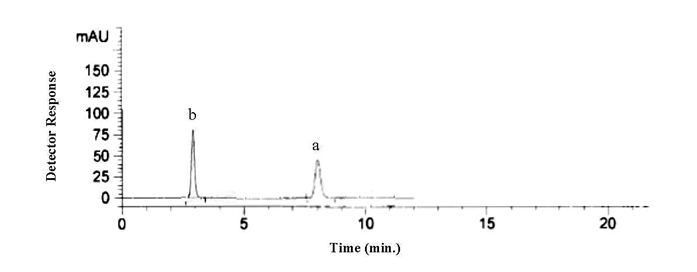 | Figure 3. HPLC chromatogram of standard mixture of 15μgmL-1DT at 380 nm(a) and12μg mL-1 PR (b) at 248 nm |
3.3. Methods Validation
3.3.1. Linearity
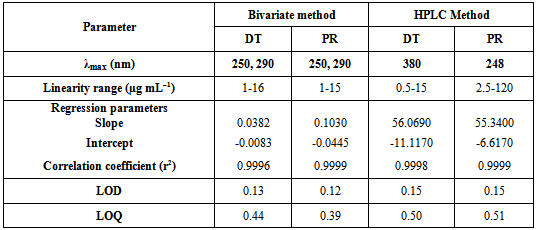
- Linear relationship between the absorbance and drug concentration in bivariate method in the range of 1-16 μg mL-1 for DT and 1-15 μg mL-1 for PR. While the linearity between the peak area and the corresponding drug concentration for the HPLC procedure was obtained over the range of 0.5-15 μg mL-1 for DT at 380 nm and 2.5-120 μg mL-1 for PR at 248 nm; Table (3).The linearity of calculated graphs was validated by the high value of the correlation coefficient and low intercept value.
3.3.2. LOD and LOQ
- The experimental limit of detection (LOD) and limit of quantitation (LOQ) were determined according to ICH [21] using the standard deviation of multiple blank samples and the slope of the calibration curve; Table (3).
|
3.3.3. Accuracy and Precision
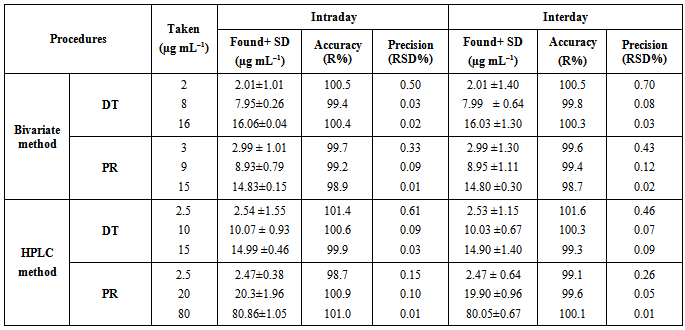
- The accuracy and precision of the proposed procedures were determined using three different concentrations of pure samples of the drug covering the specified range, each in triplicate, within one day for intraday analysis and different three days for interday analysis; Table (4).
|
3.3.4. Selectivity
- Methods selectivity was assured by applying them to laboratory prepared mixtures of studied drugs at different concentrations within the linearity range.Analysis of the laboratory prepared mixtures indicate high selectivity of the proposed methods for simultaneous determination of DT and PR in binary mixtures; Table (5).
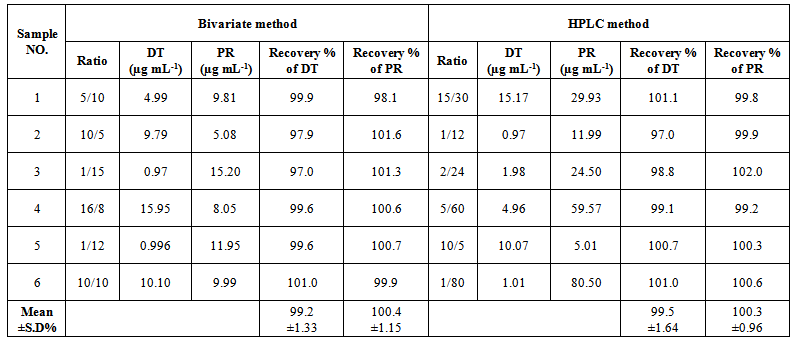 | Table (5). Determination of DT and PR in laboratory prepared mixtures by the proposed bivariate and HPLC methods |
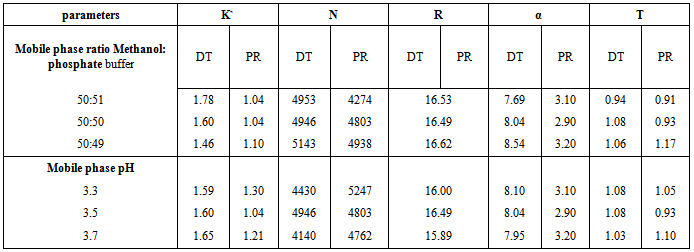
3.3.5. Robustness
- The robustness of the proposed bivariate method was checked by studying the effect of different sources of methanol. It was found that, using methanol of Sigma- aldrish, Suvchem and Fischer gave RSD% did not exceed 1.29 %.On the other hand, the robustness of the proposed HPLC method was assessed by study the influence of deliberate variation in the mobile phase contents ratio by + 2% and variation of the pH of the mobile phase by + 0.2 units. The required parameters for the system suitability test were capacity factor (k`), number of theoretical plates (N), resolution (R), selectivity (α) and tailing factor (T). It was found that, these deliberate variation did not affect the system suitability parameters confirming robustness of the method; Table (6).
|
3.3.6. Stability of Standard Solutions
- The stability of DT and PR solutions was evaluated by analysing of two different solutions; one of them was kept at room temperature while the other was kept in refrigerator against freshly prepared standards. The results showed that DT was stable for one week either kept at room temperature or in refrigerator, while PR is stable for five hours at room temperature and four days being kept in refrigerator.
3.4. Application to Pharmaceutical Dosage Form
- The proposed methods were successfully applied for the simultaneous determination of both DT and PR in pharmaceutical dosage form without interference of the excipients present. The recovery of the proposed procedures was determined by applying the standard addition technique; Table (7).
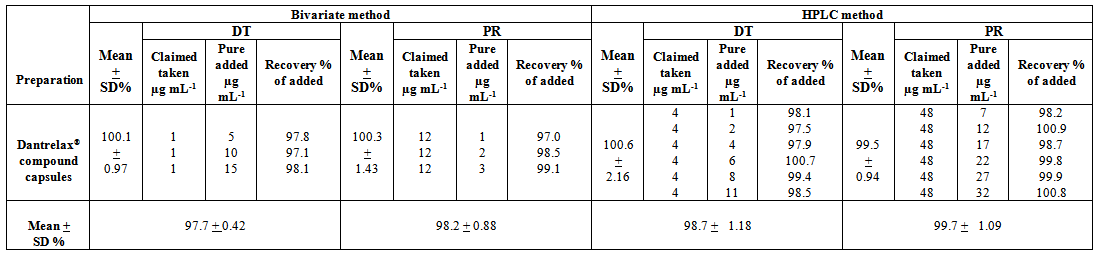 | Table (7). Standard addition technique for the determination of DT and PR by the proposed bivariate and HPLC methods in Dantrelax compound® capsules |
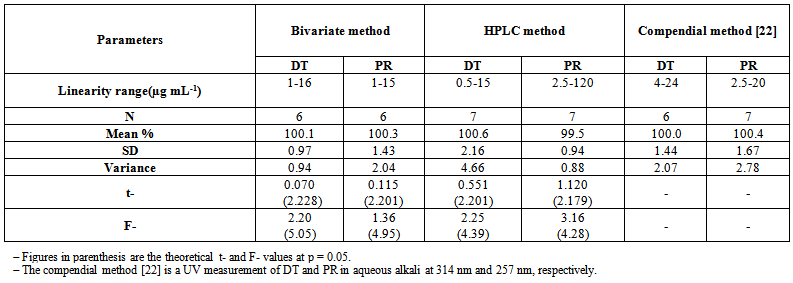 | Table (8). Results obtained by the proposed bivariate and HPLC methods compared with compendia method [22] for determination of DT and PR in pharmaceutical dosage form |
4. Conclusions
- The present paper described the successful evaluation of dantrolene sodium and paracetamol in their binary mixture in pharmaceutical formulation. Both methods are rapid, selective, sensitive and devoid of any potential interference. Therefore, the proposed methods can be used in routine quality control testing, allowing qualitative and quantitative information with high accuracy and precision.