Saima Qadir, Aijaz Ahmad Dar, Khaliquz Zaman Khan
Department of Chemistry, University of Kashmir, Hazratbal, Srinagar, 190006, J& K, India
Correspondence to: Saima Qadir, Department of Chemistry, University of Kashmir, Hazratbal, Srinagar, 190006, J& K, India.
| Email: |  |
Copyright © 2012 Scientific & Academic Publishing. All Rights Reserved.
Abstract
Ultraviolet/visiblespectrophotometric monitoring of substituted biscoumarins through microwave irradiation of solid support adsorbed reactants is reported. The progress of the reactions have been studied by calculating the percentage conversions with time and a comparison of the data has been drawn with their observed yields when carried out during the same conditions.
Keywords:
UV Monitoring, Biscoumarins, Microwave, Solvent Free
Cite this paper: Saima Qadir, Aijaz Ahmad Dar, Khaliquz Zaman Khan, UV Monitoring of Microwave Assisted Biscoumarin Synthesis, Advances in Analytical Chemistry, Vol. 3 No. 3, 2013, pp. 34-40. doi: 10.5923/j.aac.20130303.03.
1. Introduction
Of the various spectroscopic techniques available, UV spectrophotometry is an interesting and easy method for observing the progress of a chemical reaction. It has been employed as an excellent analytical tool to monitor the progress of a reaction. The kinetics of a reaction can be studied accurately to arrive at the rate and order of reaction as well as to study the effect of solvent, temperature and concentration on the progress of reaction. By analyzing the percentage yield, UV spectrophotometry can be employed to study as to which reactions should be actually carried out especially if a substance has to be prepared industrially and hence wastage of large quantity of reactants can be minimized.[1-5] Owing to the accuracy and reliability of the method, we decided to monitor the progress of microwave-assisted synthesis of biscoumarins using this method. Microwave assisted organic synthesis (MAOS) is now a days the leading trend in synthetic organic chemistry owing to shorter reaction times, solvent-free procedures and easy workups in addition to increased yields. A huge number of syntheses have been reported in view of the above advantages.[6] However, the kinetic studies of a very few of them have been carried out.[5] In order to gain further insight into the reaction mechanism of a microwave assisted organic reaction, a kinetic study of microwave assisted reactions was undertaken using UV spectrophotometry. The rates of product formation have been monitored as a function of time. Since we have been working on the microwave assisted synthesis of biscoumarins,[10] we decided to monitor the changes in chemical composition under microwave irradiation for observing how the particular reaction develops as a function of time. The UV/Visible spectra of the reactants and products were characterized by relatively sharp peaks, which were easily identifiable. Product peaks did not overlap with those of the reactants and the peak positions did not significantly vary with temperature.Coumarins are a class of organic compounds having a benzopyran nucleus containing a keto group at the β-position and are termed as β-ketolactones. Therefore they show mostly >C=O and >C=C< transitions, that is, n- π′ and π- π′. Coumarins show absorption bands at 274 and 322 nm (log ε 4.03 & 3.72) which have been attributed to the benzene and pyrone rings respectively. The prominent band, due to electronic transitions in coumarins, is the B-band due to π- π′ transitions in aromatic and heteroaromatic part of the molecule.In the present work, UV spectroscopy has been used to study the kinetics of the synthesis of biscoumarins from the condensation of 4-hydroxycoumarin with various aldehydes under microwave irradiation. The calculated percentage conversion of the reactants into products agrees well with the observed percentage yields done in our work for the same time of study.[10]
2. Materials and Methods
All the reactions studied under UV spectrophotometry were carried out in a Sharp Carousel domestic microwave oven at a power level of 75% kept constant throughout all the reactions. 4 - Hydroxycoumarin (1mmol) and the corresponding aldehyde (0.5mmol) in a 2:1 molar ratio were dissolved in minimum amount of ethanol and adsorbed on silica-gel (60-120 mesh). Five such reactions in each case were irradiated at different times of 1, 2, 3, 4 and 5 minutes respectively. The solid support was eluted with acetone and after the evaporation of acetone, the reaction mixtures were dissolved in 20 ml chloroform to form the stock mixtures. From the stocks thus prepared, aliquots of equal concentration were prepared in chloroform by further dilution from the respective reaction mixture stocks. The entire study in the work was carried out in a Schimadzu UV-1650 spectrophotometer in a 1cm quartz cell at room temperature in chloroform as the solvent. Aliquots from each solution were subjected to study over a wavelength range of 200-400 nm. For each reaction, UV spectra of the reactants and the product, was taken. Solutions of the reactants and the product in chloroform having the same concentration were subjected to UV study to look for the wavelength which would be distinct in one of the three moieties so that no or minimum interference or overlapping from the other two moieties would take place. Such a moiety (either one of the recatants or the product as the case may be) was used as the main sample for UV study of reaction progress. Once the wavelength of study was set, different concentrations of the sample were prepared and a calibration curve of absorbance vs concentration was plotted at the required wavelength. Molar absorbtivity ε was hence calculated from the Beer’s law, Where A is the absorbance, ε is the molar absorptivity in L cm-1 mol-1 and l is the path length of the quartz cuvette (=1 cm). Molar absorbtivity ε was used to find out the concentration of the sample in the five reactions subjected to microwave irradiation at different times.Percentage conversion was then calculated from either the decrease in concentration of the reactant or increase in the concentration of the product as the case may be.e.g.

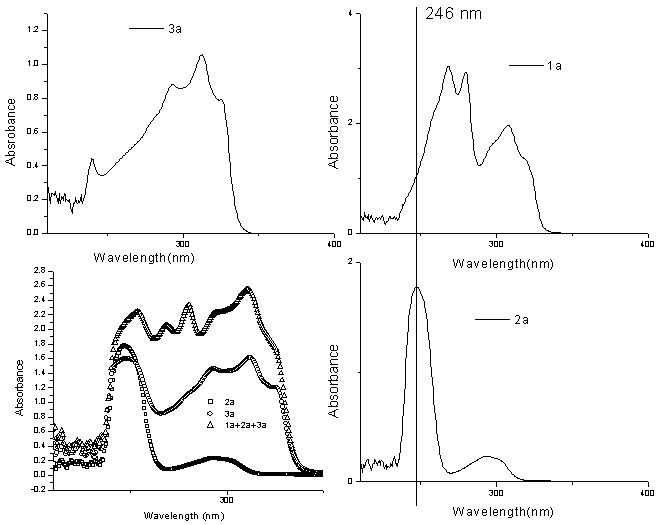 | Figure 1. Plot of absorbance vs wavelength for 1a, 2a and 3a to study the wavelength of minimum interaction |
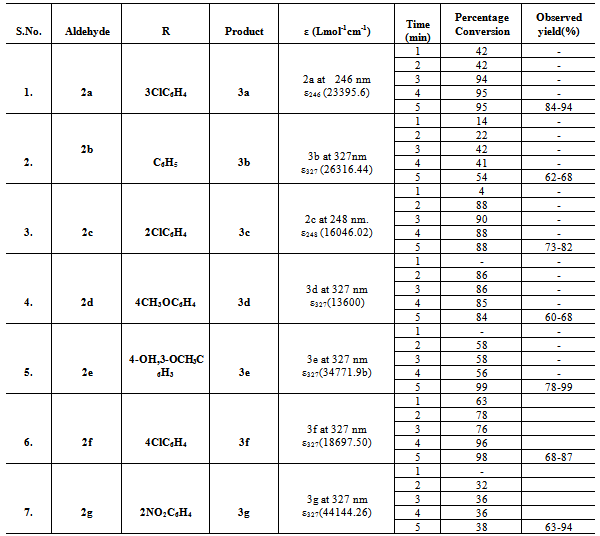
Table 1. UV monitoring of the progress of biscoumarin formation under microwave irradiation as a function of time(error ±2)
 |
| |
|
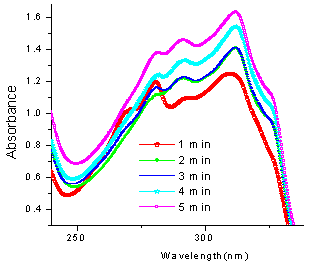
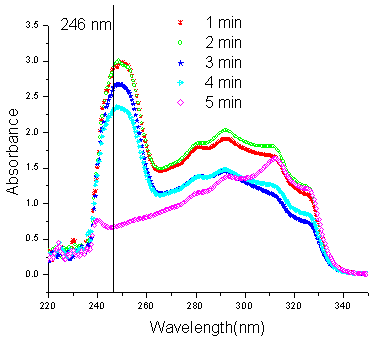 | Figure 2. UV spectra of the reaction between 1a and 2a at different times |
Where R0 = Initial concentration of the reactantAnd Rt = Concentration of the reactant after time tOrPercentage yield 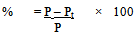 Where P = Expected concentration of the product and Pt = Observed concentration of the product after time tSince the reactions were carried out under solvent-free conditions, it was not possible to irradiate the same reaction mixture at intervals and study the percentage conversion into product under UV because this would have led to a change in concentration of the reactants as well as the product if every time the reaction mixture was eluted again and again. Therefore, five reaction mixtures having equally adsorbed solid support were irradiated at different times in order to maintain the concentrations considerably accurate.
3. Results and Discussion
Seven reactions have been studied and in each case, either the decrease in concentration of one of the reactants or increase in concentration of the product has been used as the parameter for the calculation of percentage yield. In almost all the reactions studied, the progress follows a sigmoid type of curve. Initially as indicated from their respective graphs, the reactions require some induction period after a minute of irradiation where after the reactants get almost abruptly converted into products. A few exceptions may arise because of improper heating in the multimode microwave oven. Improved yields as observed from the UV data as compared to their observed yields may also amount to the loss during isolation and crystallization. Exceptions being when the aldehydes 2b and 2g were used, the isolated yields were better than as indicated from the UV data. This may be as a result of improper microwave exposure in the multimode oven. Reaction between 4-hydroxycoumarin (1a) and 3-chlorobenzaldehyde (2a) to yield 3,3'-(3 - chlorobenzylidene) bis(4-hydroxy-1H-benzopyran-2-one) (3a):An extensive study of the reaction of 1a with 2a was undertaken under UV spectrophotometry. Solutions of 1a, 2a and 3a (1.5×10⁻⁵M) were prepared in chloroform and analyzed under UV to establish the wavelength of study where one of the three moieties interfered least with the other two. The plots obtained are shown in fig. 1. The wavelength optimum for the study of biscoumarin formation from 1a and 2a was taken as 246 nm for 2a. Since this wavelength had no interference from either 1a or the product 3a, the decrease in the intensity of this wavelength was taken as the parameter to study the percentage conversion of reactants into products. ε246 for 2a was calculated to be 23395.65 from its calibration curve.All the reactions were repeated three to four times for an exact comparison and the final data is shown in table 1. It is indicated from fig. 2 that the intensity of the peak at 246 nm of 2a gets decreased as the reaction progresses and is almost absent in the reaction mixture irradiated for five minutes. The average time of five minutes was observed as the optimum time for all reactions in the present work. The five reaction mixtures bearing an equal concentration of reactants were subjected to microwave irradiation at five different times to study the progress of reaction with time (Fig.2). Initial concentration of the aldehyde (t=0) after dilution from the reaction mixture was 2.5×10⁻⁵M in the aliquots subjected to UV spectra in all the five reactions. The progress of the reaction follows a sigmoid type of curve. (Fig.3).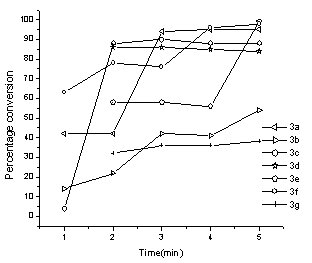 | Figure 3. UV spectra showing the progress of the reactions with time |
Reaction between 4-hydroxycoumarin (1a) and benzaldehyde (2b) to yield 3,3'- benzylidene - bis(4 – hydroxy -1H-benzopyran-2-one) (3b):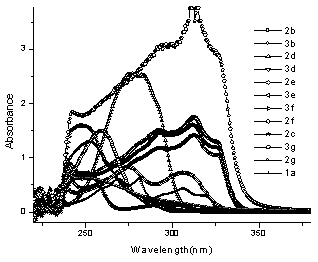 | Figure 4. UV spectra showing the absorption maxima of reactants and products |
In this case, the wavelength of the product 3b at 327 nm was taken for study as this wavelength had little interference from the reactants (Fig.4). ε was calculated to be 26316.44 from the linear fit data of the product at 327 nm. Percentage yield was hence calculated for all the five reactions irradiated at different times (Fig.5) under microwave irradiation as shown in table1. Expected concentration of the product in the reaction mixture was calculated to be 5×10⁻⁵M in the aliquots subjected to UV spectra in all the reactions. As indicated from fig. 3, the reaction shows a gradual progress with time which is more prominent initially and contrary to observed yield, an average percent conversion is indicated but the effect of irradiation is evident as an increase in the conversion of reactants into product is taking place.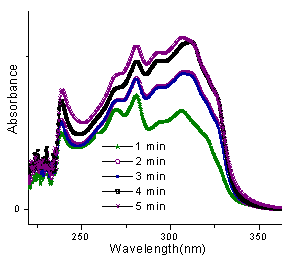 | Figure 5. UV spectra of the reaction between 1a and 2b at different times |
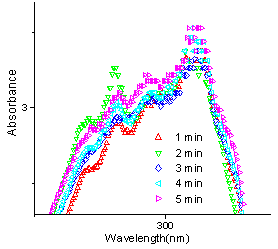
Reaction between 4-hydroxycoumarin (1a) and 2-chlorobenzaldehyde (2c) to yield 3,3'- (2 - chlorobenzylidene)-bis(4-hydroxy-1H-benzopyran-2-one) (3c):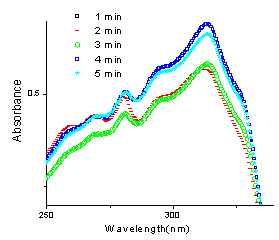 | Figure 6. UV spectra of the reaction between 1a and 2c |
In this case, the wavelength of the aldehyde at 248 nm was taken for study and ε was calculated to be 16046.02 from the linear fit data of the aldehyde at 248 nm. Percentage yield was hence calculated for all the five reactions irradiated at different times (Fig.6) under microwave as shown in table1. Initial concentration of the aldehyde (t=0) in the aliquots subjected to UV spectra after dilution from the reaction mixture was 2.5×10⁻⁵M. As indicated from fig. 8, there is an abrupt increase in the progress of reaction just within a minute of irradiation indicating the requirement of a very short induction period for the conversion of reactants into the product.Reactions between 4-hydroxycoumarin (1a) and aldehydes 2d-g:In the same way, UV monitoring of few more biscoumarins was carried out and a similar sort of a trend was followed. In the reaction of 4-hydoxycoumarin with aldehydes 2d-g, the λmax of their corresponding biscoumarins at 327 nm was taken for study in each case. The respective moalr absorptivities are indicated in table 1. In the reaction between 4-hydroxycoumarin (1a) and 4- methoxybenzaldehyde (2d) to yield 3,3' - (4 - methoxybenzylidene) -bis(4-hydroxy-1H-benzopyran-2-one) (3d), the progress of the reaction follows a linear type of curve (Fig.3). An abrupt increase in the progress of reaction indicates that a very short induction period is required. Figure 7 shows the UV spectra of the reaction carried out in chloroform as the solvent. 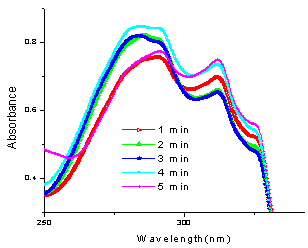 | Figure 7. UV plot of the reaction of 1a with 2d at different times |
 | Figure 8. Reaction of 1a with 2e at different times |
In case of the reaction between 4-hydroxycoumarin (1a) and (vanillin) 4-hydroxy-3-methoxy-chlorobenzaldehyde (2e) to yield 3e, there is almost 50% progress in the reaction initially and continues to be so upto four minutes of irradiation and a further minute of irradiation leads abruptly to almost cent percent completion of reaction and also agrees very well with the observed yield. (Fig.8)The progress of the reaction follows a sigmoid type of curve and excellent conversion is indicated when 4-hydroxycoumarin (1a) and 4-chlorobenzaldehyde (2f) react to yield 3f (fig. 9).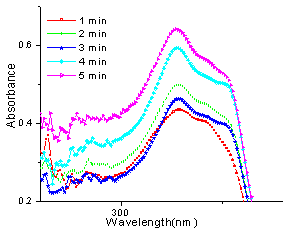 | Figure 9. UV spectra of reaction between 1a and 2f at different times |
 | Figure 10. UV spectra of reaction between 1a and 2g at different times |
When 2-nitrobenzaldehyde (2g) reacts with 4 - hydroxycoumarin, there is an average progress in the reaction. (fig. 10) Whereas good to excellent conversions have been indicated from the observed yields, an average yield is indicated from the UV data. This may be due to the lack of reproducibility while using domestic microwave oven.The percentage yield differences observed in products 3b and 3g are evident and contrary to observed yields although microwave conditions have been used in either case. This can be attributed to the differences in microwave exposure even if the same equipment is used. In a domestic microwave oven, the high and low field strengths commonly referred to as “hot and cold” spots lead to variations in temperature between different parts of the reaction mixture. Microwaves, no doubt, lead to increased reaction rates but the field of exposure and the time interval of irradiation, if not taken care of, may spoil a reaction at the same time. Evidently, more research is required to investigate the underlying principles of this heating method. So, in order to achieve a microwave assisted organic synthesis in which factors like superheating effects,[7] dipolar mechanism, ionic conduction mechanism, [8] penetration effect, thermal effects,[9] etc do contribute to increased yields and shorter reaction times, but the lack of reproducibility, because of inhomogenieties in microwave exposure and the heterogeneous field generated inside a domestic microwave oven does contribute to the exceptional results.Spectral Data of Biscoumarins 3a-g.Spectral data of 3,3'- (3- chlorobenzylidene) -bis(4-hydroxy-1H-benzopyran-2-one)-3a1H NMR(200 MHz, CDCl3): δ 6.1, IH, s,(H-11); 7.2-8.1,12H,m,(12×CH); IR (KBr,cm-1): 1663.9, 1617.7, 1568.5, 762.; MS(m/z): 445.9(ESI); UV(λmax), CHCl3:312 nm; Mp 222-224℃Spectral data of 3,3'- phenylmethylene –bis (4 - hydroxy-1H-benzopyran-2-one)-3b1H NMR(200 MHz, CDCl3): δ6.2 IH,s,(H-11); 7.2 - 8.3,13H,m,(13×CH); IR (KBr,cm-1): 1661.1, 1618, 1604.7, 1569.5, 762.2; MS(m/z): 412(ESI); UV(λmax), CHCl3:312 nm; Mp 215℃ Spectral data of 3,3'- (2- chlorobenzylidene) -bis(4-hydroxy-1H-benzopyran-2-one)-3c1H NMR(200 MHz, CDCl3): δ 6.2, IH, s,(H-11); 7.3-8.2,12H,m,(12×CH); IR (KBr,cm-1): 1648.3, 1618.4, 1601.7, 1565.7, 767.9; MS(m/z): 445.9(ESI); UV(λmax), CHCl3: 312 nm; Mp 198-199℃Spectral data of 3, 3' - (4-methoxyphenylmethylene)-bis(4-hydroxy-1H-benzopyran-2-one)-3d1H NMR(200 MHz, CDCl3): δ 3.9, 3H, s,(OCH3); 6.2,IH,s,(H-11);6.9-8.2, 12H,m,(12×Ar-CH); IR (KBr,cm-1): 1654.3, 1636.3, 1560.4, 781.8; MS(m/z): 442(ESI); UV(λmax), CHCl3: 312 nm; Mp 238-240℃Spectral data of 3,3'- (4- hydroxy,3 - methoxyphenylmethylene)-bis(4-hydroxy-1H-benzopyran-2-one)-3e1H NMR(200 MHz, CDCl3): δ6.8-7.9, m, 11H(11×Ar-CH), 8.1, 4-OH; 6.1,s,2(OH), 3.98, s, OCH3; 5.6,s, CH; IR(KBr,cm-1): 1669.6, 1617.6, 1560.4, 1514.8, 768.1; MS(m/z): 458(ESI); UV(λmax), CHCl3:312 nm; Mp 212-15℃Spectral data of 3,3'-(4-chlorobenzylidene) –bis (4- hydroxy -1H-benzopyran-2-one)-3f1H NMR(200 MHz, CDCl3): δ 6.1, IH, s,(H-11); 7.2-8.1,12H, m,(12×CH); IR(KBr,cm-1): 1663.9, 1617.7, 1568.5, 762.; MS(m/z): 445.9(ESI); UV(λmax), CHCl3: 312 nm; Mp 222-224℃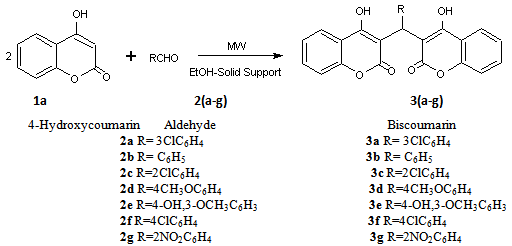 | Scheme 1. Reaction of 4-hydroxycoumarin with different aromatic aldehydes to yield biscoumarins |
Spectral data of 3,3'- (2-nitrophenylmethylene)-bis(4-hydroxy-1H-benzopyran-2-one)-3g1H NMR(200 MHz, CDCl3): δ 6.7, IH, s,(H-11); 7.2-8.1,12H,m,(12×Ar-CH); IR(KBr,cm-1): 1653.87, 1616.2, 1567.9, 762.6; MS(m/z): 456.9(ESI); UV(λmax), CHCl3:312 nm; Mp 200-202℃
4. Conclusions
UV spectroscopy has been successfully employed to study the kinetics of biscoumarin formation in the reaction of 4 - hydroxycoumarin with various aldehydes under microwave irradiation. The calculated yields agree well with the observed yields within experimental errors.
ACKNOWLEDGEMENTS
We are highly grateful to Tabasum and Aabid of Indian Institute of Integrative Medicine (IIIM), Jammu, for getting the IH-NMR and Mass spectra of the samples done in no time.
References
| [1] | Khorassani, S. M. H.; Maghsoodlou, M.T.; Ebrahimi, A.; Roohi, H.; Zakarianezhad, M. UV Spectrophotometric Study of the Kinetics and Mechanism of the Reactions between Triphenylphosphine, Dialkyl Acetylenedicarboxylates and NH-Acid. J. Iran. Chem. Soc., 2006, 3(3), 223-232. |
| [2] | Lopez, F.B.; Verboom,W.; Kakuta,M.; Han, J.; Gardeniers,G.E.; Egberink, R.J.M.; Edwin R.; Oosterbroek; Bergb, A.V.; Reinhoudta, D. N. Optical fiber-based on-line UV/Vis spectroscopic monitoring of chemical reaction kinetics under high pressure in a capillary microreactor. Chem. Commun., 2005, 2857–2859. |
| [3] | Andonovski, B. S.; Stojkovic, G. M. UV study of indole and 3-acetylindole in phosphoric and hydrochloric acid solutions. Acta Chim. Slov. 2000, 47, 349-362. |
| [4] | Andonovski, B.S. UV Study of the Protonation of Indole-2-carboxylic Acid, 3-Methylindole, 3-Acetylindole and D-Tryptophan in Perchloric Acid Solutions. Croatica Chemica Acta 1999, 72(4), 711-726. |
| [5] | Getvoldsen, G.S.; Elander,N.; Stone-Elander, S.A. UV Monitoring of Microwave-Heated Reactions– A Feasibility Study. Chem. Eur. J. 2002, 8(10), 2255-2260. |
| [6] | Caddick, S. Microwave Assisted Organic Reactions. Tetrahedron, (1995), 51(38), 10403-10432. |
| [7] | Baghurst, D. R.; Mingos, D. M. P. Superheating effects associated with microwave dielectric heating. J. Chem. Soc., Chem. Commun. (1992), 674-677. |
| [8] | Gabriel, C; Gabriel, S.; Grant, E. H.; Mingos, D. M. P.; Halstead, B. S. J.; Dielectric parameters relevant to Microwave dielectric heating. Chem Soc. Rev., 1998, 27, 213-223. |
| [9] | Hoz, A.; Ortiz, A.D.; Moreno, A. Microwaves in organic synthesis; Thermal and non-thermal microwave effects. Chem. Soc. Rev., 2005, 34, 164–178. |
| [10] | Qadir, S.; Dar, A.A., Khan, K.Z. Synthesis of Biscoumarins from 4-Hydroxycoumarin and Aromatic Aldehydes–A Comparative Assessment of Percent Yield under Thermal and Microwave-Assisted Conditions. Synth. commun., 2008, 38, 3490-3499. |
 Abstract
 Reference
 Full-Text PDF
 Full-text HTML