-
Paper Information
- Paper Submission
-
Journal Information
- About This Journal
- Editorial Board
- Current Issue
- Archive
- Author Guidelines
- Contact Us
Advances in Analytical Chemistry
p-ISSN: 2163-2839 e-ISSN: 2163-2847
2013; 3(3): 21-28
doi:10.5923/j.aac.20130303.01
Limitations to Use of Infrared Spectroscopy for Rapid Determination of Carbon-Nitrogen and Wood Density for Tropical Species
 Abstract
 Reference
 Full-Text PDF
 Full-text HTML
Kennedy Olale 1, 2, Abiy Yenesew 2, Ramni Jamnadass 1, Andrew Sila 1, Ermias Aynekulu 1, Shem Kuyah 1, 3, Keith Shepherd 1
1World Agroforestry Centre, Nairobi, P.O. BOX 30677-00100, Kenya
2Department of Chemistry, University of Nairobi, Nairobi, P.O. BOX 30197-00100, Kenya
3Department of Botany, Jomo Kenyatta University of Agriculture and Technology, Nairobi, P.O. BOX 62000 00200, Kenya
Correspondence to: Kennedy Olale , World Agroforestry Centre, Nairobi, P.O. BOX 30677-00100, Kenya.
| Email: |  |
Copyright © 2012 Scientific & Academic Publishing. All Rights Reserved.
Infrared (IR) spectroscopy was used as a rapid and non-destructive method to determine, carbon (C), nitrogen (N) and tree wood density.A total of 82 sample cores were scanned in the reflectance mode from 4000 to 400 cm-1 for mid-infrared (MIR) spectra and from 8000 to 4000cm-1 and 11000-4000cm-1 for near infrared (NIR) spectra. The reference values for C and N were measured using combustion method while wood density was calculated using auger method. Calibration equations were developed using partial least-squares and first derivative spectra. Root mean square error (RMSEP) was used to calculate prediction error. Prediction of Cusing MIR spectra gave R2 = 0.59, RMSEP = 0.02; NIR spectra R2 = 0.50, RMSEP = 0.02, whileN prediction usingMIR spectra had R2 = 0.54, RMSEP = 0.22; NIR spectra R2 = 0.48, RMSEP =0.24. Wood density prediction was fair for MIR (R2= 0.79, RMSEP = 0.14); NIR (R2= 0.69, RMSEP = 0.17).Improved predictions using NIR were for extendedspectral range;though accuracies were inferior to MIR. Both MIR and NIR models showed good potentials to be used as rapid and cost effective method of predicting C-N andwood density.
Keywords: Infrared Spectroscopy, Partial Least Squares Regression,Carbon, Nitrogen,Wood Density
Cite this paper: Kennedy Olale , Abiy Yenesew , Ramni Jamnadass , Andrew Sila , Ermias Aynekulu , Shem Kuyah , Keith Shepherd , Limitations to Use of Infrared Spectroscopy for Rapid Determination of Carbon-Nitrogen and Wood Density for Tropical Species, Advances in Analytical Chemistry, Vol. 3 No. 3, 2013, pp. 21-28. doi: 10.5923/j.aac.20130303.01.
Article Outline
1. Introduction
- Wood density provides vital information on how much carbon is stored by a plant[1]. Research to acquire the often sparse information on carbon,nitrogen and wood densityfor tropical tree species needs to develop a rapid and low cost method that can be applied across species[2]. However, the information on wood density can be acquired from measurements of tree biovolume from field surveys[2].Sampling trees for wood density can be achieved using destructive (discs) or non-destructive methods (increment cores). Non-destructive sampling conserves genotypes for later experimentation, research, and tree breeding[3]. However, measurements obtained by non-destructive methods must accurately represent the whole tree.Infrared Reflectance (IR) Spectroscopy, combined with chemometrics algorithms, is a promising spectroscopic tool for rapid assessment of wood parameters including carbon, nitrogen and wood density contents[2].The spectroscopic technique utilizes the specificity of absorption frequencies of the molecules given that molecules rotate or vibrate at discrete energies[4].The IR technique is non-destructive for evaluation of organic materials where particularly C–H, O–H, and N–H groups influence the properties to be assessed[4]. Of our interest are the near and mid infrared portions.Better predictions have been achieved with NIR spectra in estimating wood density and pulping yield of Eucalyptus globulus with robust and precise predictions than those obtained using MIR spectral region[5]. Studies have reported prediction of wood properties using NIR spectra collected at various moisture conditions; Thygesen[6] developed NIR calibrations for basic density and dry matter using green Norway spruce (Picea abies) discs and shavings that varied in moisture content.Thestudy findings showed that good calibration models are attainable for dry matter content of both solid wood and shavings.This further suggested that to evaluate the potential of NIR spectroscopy for wood density determination, it would be valuable to know why calibration is possible and which aspects of the calibration influence the predictive ability of the calibration models[6].Schimleck et al.[7] reported various characteristics (air-dry density, microfibril angle, stiffness, tracheid morphological traits) of Pinus taeda wood that could be modelled using collected NIR spectra.Lignin and carbon content have also been predicted in wood using NIR spectra[8], with the study indicating that species with high lignin content display high carbon content[8]. Nitrogen content determination in plants is fundamental and requires rapid and reliable tests which can be relied on to provide recommendations for optimum N fertilizer applications[9]. However, key challenge to N determination has beenthe existing destructive sampling and lengthy analysis time[10]. In addition to chemical characteristicspredicted in wood, thenear infrared region (NIR) has been used to assess non-chemical characteristics of solid wood and showed capability of predicting mechanical, anatomical and physical properties of solid wood[4,11,12].Though most application of the infrared spectroscopy has been on NIR; mid-infrared (MIR) spectral region has alsobeen reported as useful in following the molecular conformational changes of atoms[2]. The band shape in MIR region reflects the degree of ordering that is present in the molecular system[2]. The ability of the MIR model to discriminate or identify woodsamples is based on the vibrational responses of chemical bonds to the electromagnetic radiation of MIR region[13]. Combination of IR spectra and multivariate data analysis techniques likePartial least squares regression (PLSR), principal component (PCA) or discriminant analysis opens the possibility to unravel and interpret the spectral properties of the sample[13]. This interpretation allows for qualitative analysis of the samples, such as discrimination or classification[13].PCA is used to find the main variability sources in a data set and the relationship between/within objects and variables; PCA reduces the number of original variables to a few reduced variables or PCs, by keeping only the largest or most significant PCs[14]. Conversely, partial least squares regression (PLSR) is often regarded as the major regression technique for multivariate data[14]. PLSR have the potential to estimate the component concentration and chemical/physical properties (loading vectors, vector of final calibration regression coefficients, and spectral residuals) from the infrared spectra[15]. PLSR has been used successfully in developing multivariate calibration models for infrared spectroscopy by reducing the influence of irrelevant spectral variations in the calibration model[16; 17]. This ability provides a more information-rich data set of reduced dimensionality and eliminates data noise which results in more accurate and reproducible calibration models[16].Heterogeneous materials like wood have large numbers of overlapping absorption bands of different constituents within caused by large light scattering effects[18]. To address this, spectral pre-treatment is often applied to remove or reduce the interferences from the physical heterogeneity (such as the variations in particle size, packing density and moisture content)[19].The objective of the study was to develop a mathematical relationship (model) between carbon-nitrogen andwood densitycontents and the IR spectral signal. The new method of IR scanning is cost-effective and rapid and is seen as a replacement to time-consuming and expensive wet chemistry analysis.
2. Materials and Methods
2.1. Sample Origin and Preparation
- A total of 84 wood auger cores representing 17 different species grown on three different benchmark sites of Yala basin were taken from trunk at breast height (DBH 1.3 m). The species included;Bridelia micrantha, Crotonmacrostachyus, Harungana madagascalensis, Markhamia lutea, Prunus africana, Syzygium cordatum,Cuppresus lusitanica, Eucalyptus camaldulensis, Eucalyptus grandis, Eucalyptus saligna, Mangifera indica, Persia americana, Syzygium cuminii, Acacia mearnsii, Grevillea robusta, Jacaranda mimosifoliaand Combretum molle.Fresh auger cores were placed in a zip lock bag then transportation to the laboratory. Cores were dried at 105°C in oven until no further weight loss. Cores were ground and sieved using a sieve size of 0.5 mm into a fine powder and placed in zip lock bags.
2.2. C and N Reference Analysis
- Total C and N concentrations of wood samples were measured by dry combustion using a CN analyser by placing approximately 2 mg of finely ground samples in tin capsule (Thermo-Quest Flash EA1112-Analytical Technologies Inc., CA, USA).
2.3. Wood Density Measurement
- Cored volume was determined by assuming the core is cylindrical and wood density in g cm-3 was then calculated as the ratio of wood dry mass to core volume
2.4. Near-infrared Spectroscopy and Mid Infrared Spectroscopy
- Spectral data was collected in reflectance mode using a high intensity contact probe attached to Fourier Transform Infrared Multi-purpose Analyzer (FTIR MPA) from 8000 to 4000 cm−1 and 11000 to 4000 cm−1. For each spectrum, 30 scans were collected by the spectrometer and averaged to produce a single spectrum. For MIR, Samples were scanned from 4000 to 600 cm−1 (2500 to 25,000 nm) using a Bruker High-Throughput-Screening (HTS-XT) accessory attached to a Bruker Tensor 27 FT-IR spectrometer(ICRAF-Laboratory). Different wavenumber ranges for NIR were used to develop prediction models in order to improve the quantitative prediction of wood parameters.The spectral range extending from 11000 to 12,000 cm-1 had high noise level corresponding to the third harmonic region and was excluded for calibration[11].
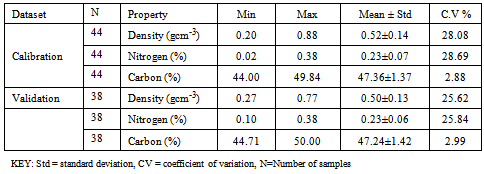
2.5. Statistical Analysis and Modeling
- Partial least squares (PLS) regression was employed to develop all prediction models.To discuss how calibration models predict carbon,nitrogen and wood density in relation to the spectral features, only the 1st derivative spectra were used in the analyses (Figure 1).Transformation of the raw spectra and analysis using Partial Least Square Regression (PLSR) were done usingR software version 2.13.1[20]. However,before transferring the spectral data to R, an automated optimisation for selecting the best spectral pre-treatment was first developed by the Bruker OPUS Quant software package vs. 6.5 (Bruker Optics). 84 samples were split into calibration set and validation set (Table 1).The selection of representative samples calibration set were based on recorded NIR and MIR spectral diversity using the Kennard and Stone algorithm[21].The performances of the models were evaluated in terms of the root mean square error of calibration (RMSEC), the root mean square error of prediction (RMSEP) and the correlation coefficient (R). The RMSEC was calculated as follows:
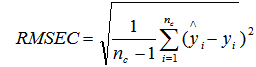 | (1) |
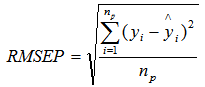 | (2) |
3. Results and Discussion
3.1. Carbon-Nitrogen Contents and Wood Density
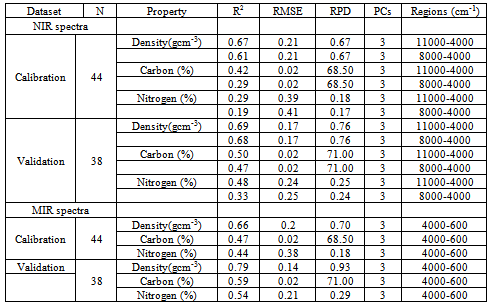
- Measured carboncontent ranged from 44.00% to 50.05%, mean of 47.30%standard deviation of 1.38 %, and coefficient of variation = 2.92% (n=81). Nitrogen content ranged from a minimum of 0.23% to a maximum of 0.38% (Table 1) (n=82).Wood density ranged from 0.20 gcm-3 to 0.88 gcm-3 with an average of 0.51 gcm-3, standard deviation of 0.14gcm-3 and coefficient of variation=26.91% (n=82). The summary of calibration and validation samples sets are shown in Table 1. Predictions corresponding to 11000-4000 cm-1 were slightly improved compared to those using 8000-4000 cm-1 spectral range (Table 2). Major absorption bands were observed in the wavelength region of 6940-6900 cm-1, 5700-5630 cm-1 and 5650-5600 cm-1, 4850-4780 cm-1, 4400-4380 cm-1 and 4220-4180 cm-1. The regions are associated with C-H Stretching and O-H stretching vibrations[23]. The peak around 5650-5600 cm-1 could be as a result of -CH3 stretch in first harmonic region.For MIR region, dominant absorption features were observed in the following region: 3400, 1750-1600, 2970, 2250, 2220, 1750-1600 and 1200-1000 cm-1 suggesting the following functional groups; -NH2, -CH3, -C≡N, -C≡C, >C=O and from 1200-1000 cm-1; -C-C-, -C-N and -C-O-[23] (Figure 1). The high peak around 1350 cm–1 is due to C–H and O–H bending vibrations[23].
|
|
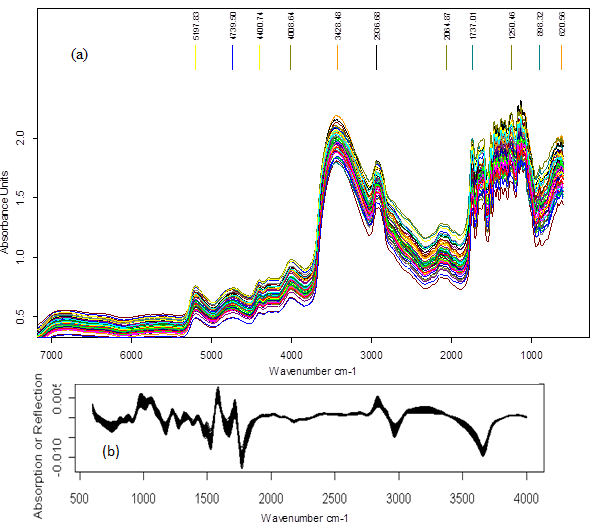 | Figure 1. Raw (a) and derivative (b) Mid-infrared spectra of wood cores samples.Spectra were pre-treated with 1st derivative |
3.2. IR Prediction of Carbon-Nitrogen and Wood Density
- The optimal models developed using PLS and 11000-4000 cm-1 spectral range gave fair performance in the calibration set for wood density with R2 = 0.67, RMSEP =0.21 gcm-3, RPD= 0.67 and R2= 0.69, RMSEP =0.17 gcm-3 and RPD=0.76 for validation set (Table 2). The validation set for carbon was R2 = 0.50, RMSE = 0.02%, RPD = 71.00. While for nitrogen, R2 = 0.48, RMSE = 0.24%, RPD = 0.25 in validation set (Table 2). On changing the NIR spectral range to 8000-4000 cm-1, the prediction statistics of carbon and nitrogen were R2 = 0.29, RMSE = 0.02% and RPD = 68.50; R2= 0.19, RMSE = 0.41%, RPD = 0.17 and R2 = 0.33, RMSE = 0.25%, RPD = 0.24 respectively for calibration. Wood density in calibration set had R2 = 0.61, RMSEP =0.21 gcm-3 and RPD= 0.67 (Table 2). For MIR region, the validation dataset for wood density was good with R2 = 0.79, RMSEP =0.14 gcm-3 and RPD= 0.93. While the calibration dataset had R2 = 0.66, RMSEP =0.20 gcm-3 and RPD= 0.70. The validation dataset of carbon and nitrogen had R2 = 0.59, RMSE = 0.02%, RPD = 71.00 and R2 = 0.54, RMSE = 0.21%, RPD = 0.29 respectively (Table 2). For wood density predictions using NIR spectra, several wavelengths were found to be associated with the models; these wavelengths were primarily around 5700-5630 cm-1 and 5650-5600 cm-1, 4850-4780 cm-1, 4400-4380 cm-1 and 4220-4180 cm-1 at 7168, 7143, 5935, 5797, 4545 and 4280 cm–1 associated with C–H stretching and/or deformation of CH, CH2, CH3, aromatic groups in lignin, –CHO and cellulose. The region around 7000 to 6000 cm-1is dominated by the 1st overtone of O–H stretching vibrations arising mainly from carbohydrates[24]. Better predictions were found on extending the spectral region to 11000 cm-1, within this region notable wavelengths were found at 8230 cm-1, 8650 cm-1and 8450 cm–1 these bands are associated with 2nd over-tone of C–H stretching vibrations from –CH3 groups[24]. 4296-4288 cm-1was proposed to be for hemicellulose[24].In MIR region, calculated principle components (PCs) were affected by absorption at 1890 and 700 cm-1, which may be attributed to COOH groups (Figure 2). PC2 was affected mainly by absorption between 3,500 and 2,500 cm-1 (attributable to CH3 groups) and PC3 by absorption at 3,670, 3,300, and 2,350 cm-1 (attributable to CH2 and CH3 groups). The high peak around 1350 cm-1 is due to C–H and O–H bending vibrations[23]. The sharp band intensity at 1739 cm-1 (Figure 2)is attributed to the stretching of the free carbonyl groups (cellulose, hemicellulose, and lignin[25]. Both carbon and nitrogen had specific absorption bands/relevant wavelength that were important in their predictions. For carbon, these wavelengths were 7353, 7168, 7143, 5935, 5797, 4545 and 4280 cm–1 primarily associated with –CH3[26]. Wavelengths range of 8230 cm–1 has been associated with cellulose[26]. O–H stretching and deformation of ROH at 7092 and 4807 cm-1 were also useful.These wavelengths were also reported by Fagan et al.[26]. The wavelengths used in nitrogen calibration were 5263, 5208 and 4926 cm-1which are associated with C-O stretching (2nd overtone) of –CO2H, CONH, and CONH[26]. However, Mclellan et al.[27]reported 7849, 4205, 4785 and 8130 cm–1 wavelengths in nitrogen determination of decomposing leaf material. Additional loadings were observed at around 6993 cm–1 attributed to N–H stretching (1st overtone) of CONH2. MIR spectra for carbon and nitrogen were predicted with regions around 1595, 1510/1507, 1270 and 1230 cm-1 and are assigned to characteristic bending or stretching of different groups of lignin[25]. Slopes for the PLS using the validation and calibration datasets results of the measured carbon and nitrogen versus the predicted values showed poor distributed along the 1:1 line. However, the use of 11000-4000 cm-1 spectral range did not improve the distribution resulting in over prediction of both carbon and nitrogen (Figure 3a). Whereas, the slopes for the PLSR-MIR wood density using the validation dataset were found to be close to the 1:1 line of the calibration models indicating good validations (Figure 3b).The results from this study shows that MIR spectra performed slightly better than NIR spectra but could meet the minimum threshold to recommend for prediction of wood density, carbon and nitrogen contents. However, the performance of NIR in predicting carbon and nitrogen were poor compared to fair predictions obtained using MIR. This was despite the fact that RPD was very large for carbon content (68.50-71.00) and low RMSEP (0.02%). The RPD value was used to evaluate the quality of the validation and the higher the RPD value, the better the predictive power of the calibration model[28],while low RMSEP suggested the accuracy of the model. Superiority of the MIR region could be due to more detailed chemical information from the MIR spectra.Improved performances of NIR models were obtained while using 11000-4000 cm-1 spectra range instead of 8000-4000 cm-1 for the NIR region. This could be due to wavelengths range of 8230cm–1 associated with cellulose[26]. Mathematical processing of the raw spectra using Savitzky–Golay first derivative algorithm enhanced both MIR and NIR spectral features and prepared the data for chemometrics modelling by removing the same signal between the two variables. Fujimoto et al.[29]used second derivative spectral pre-treatment in predicting wood density of oven dried Larix kaempferi and foundR2=0.79-0.89, SEP=24-26 kg/m3. However, for heterogeneous material such as wood, R2 values of 0.75 and above are considered good[30], thus our results are unsatisfactory for wood density, carbon and nitrogen.
3.3. Limitations to Use of Infrared Spectroscopy
- Infrared spectroscopy continues to be a vital technique for tree analysis for over years. Each IR spectrum of a plant sample contains a considerable amount of information and represents fingerprint of a sample[31]. The absorption peaks corresponds to the frequencies of vibrations between the bonds of the atoms making up the material[31].Different materials have unique combination of atoms, with no two compounds producing similar infrared spectrum[31].As a result, infrared spectra plus modern software algorithms can result in a positive identification (qualitative analysis) of different kind of material. In addition, the size of the peaks in the spectrum directly indicates the amount of material present[31]. One key advantage of IR is that acquisition of the spectra can be done to any sample in any state within a short time and data obtained. The potential of IR spectroscopy to predict the concentrations of various constituents or functional properties of plant materials more rapidly and at a lower cost also adds to its advantage. However, the technique has had limited applications in integrative fields such as agroforestry, ecoagriculture and landscape ecology[2]. These fields include study of tree, crop and livestock production in farms and landscapes and their interactions with ecosystems and the general environment[2].Every step in the procedure of IR calibration can generate errors, from sample collection, to analysis, to spectral preprocessing and interpretation. Plant-to-plant variation can contribute to considerably high variation in sample data[32]. Samples drying and drying conditions contribute to the loss of non-structural carbohydrates[33]. Sample size reduction by milling or grinding reduces particle size and enables weighing of a homogeneous sample, but not all grinders reduce samples to the same particle size and there can be loss of as much as 27% of the samples[32].Each of steps undertaken would, if not controlled result in errors in analytical procedures and are therefore, potential sources of errors in IR predictions.
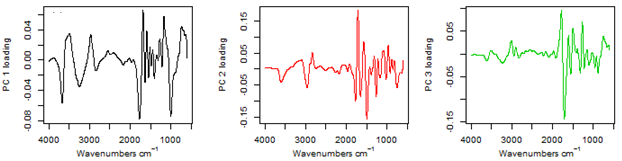 | Figure 2. Plot of factor loading values for the principal components used to predict wood density from MIR spectra |
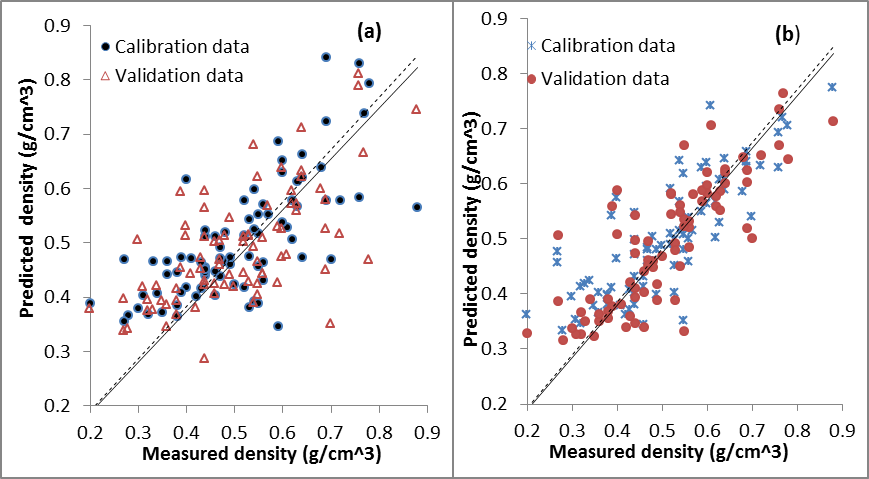 | Figure 3. Near-infrared (a) and Mid-infrared (b) predictions of wood density using calibration and validation datasets. The dash-dot lines represent regression lines for the calibration dataset and the solid straight lines represent regression lines for the validating dataset. The lines indicate 1:1 |
4. Conclusions
- The obtained models showed fair predictive ability for wood density, and poor predictions for carbon and nitrogen contents. Our results suggested that IR techniques coupled with partial least squares method holds promise for rapid and cost effective method to predict both physical and chemical properties of wood as alternative to the chemical analysis.However, different spectral pre-treatments can be further tried toimprove the calibration models.
ACKNOWLEDGEMENTS
- We gratefully acknowledge the assistance ofICRAF-Kisumu team for collection of plant discs for this research. Funding was provided by the World Agroforestry Centre (ICRAF).