-
Paper Information
- Previous Paper
- Paper Submission
-
Journal Information
- About This Journal
- Editorial Board
- Current Issue
- Archive
- Author Guidelines
- Contact Us
Advances in Analytical Chemistry
p-ISSN: 2163-2839 e-ISSN: 2163-2847
2012; 2(6): 80-87
doi: 10.5923/j.aac.20120206.02
Development and Validation of the Quantitative Analysis of Cefuroxime Sodium in Powder for Injection by Infrared Spectroscopy
 Abstract
 Reference
 Full-Text PDF
 Full-Text HTML
Daniela Cristina de Macedo Vieir, Patrícia de Castro Ricarte, Hérida Regina Nunes Salgado
Department of Drugs and Medicines, School of Pharmaceutical Sciences, UNESP – Univ Estadual Paulista, Araraquara, 14801-902, Brazil
Correspondence to: Daniela Cristina de Macedo Vieir, Department of Drugs and Medicines, School of Pharmaceutical Sciences, UNESP – Univ Estadual Paulista, Araraquara, 14801-902, Brazil.
| Email: |  |
Copyright © 2012 Scientific & Academic Publishing. All Rights Reserved.
A simple, useful and reproducible infra red spectrophotometric method for quantitative determination of cefuroxime (CFU) in powder for injection was developed. This method involved the measurement of absorbance measurements of the band corresponding to aromatic ring centered by 1475-1600 cm-1. The validation of analytical method was carried out to the study of the following analytical parameters: linearity, specificity, precision, accuracy and robustness. The linearity range was found to be 5.0 to 20.0 µg.ml-1(regression equation: y = 0.5053x + 0.0114, r2 = 0.9991). The data show a good precision of the method, since the R.S.D. values are close to 2% and below 5%.The proposed method was successfully applied to the assay of cefuroxime in powder for injection.
Keywords: Infrared Spectroscopy, Quantitative Determination, Quality Control
Cite this paper: Daniela Cristina de Macedo Vieir, Patrícia de Castro Ricarte, Hérida Regina Nunes Salgado, "Development and Validation of the Quantitative Analysis of Cefuroxime Sodium in Powder for Injection by Infrared Spectroscopy", Advances in Analytical Chemistry, Vol. 2 No. 6, 2012, pp. 80-87. doi: 10.5923/j.aac.20120206.02.
Article Outline
1. Introduction
- Antibiotics are specific chemical substances produced by living organisms that are able to inhibit the action of other organisms. Molecules of cephalosporins are characteristically composed of three main parts, namely: β-lactam ring, free carboxyl acid group and a substituted amino acid side chain. The main representatives of this class are shown in Figure 1.Replacement of R1 or R2 positions results in different compounds with different antimicrobial spectrum, power, bioavailability, half-life and toxicity profile. These differences are relatively small, however with rampant bacterial resistance, a study of this class of drugs requires ongoing research so that in the near future a new generation of pharmaceuticals being developed and introduced into clinical practice. The chemistry of cephalosporins has been widely explored because of their extensive medical applications[1].Cefuroxime (CAS 56238-63-2) (Figure 2) is a cephalosporin of second generation with high antibacterial activity; it has enhanced in vitro activity against clinically important Gram-positives and Gram-negativemicroorganisms[2].
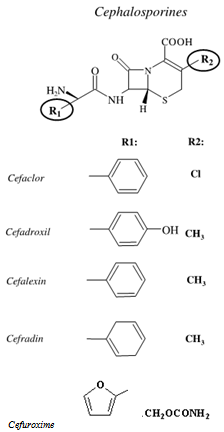 | Figure 1. General structure of cephalosporin, showing the main substituents with their names |
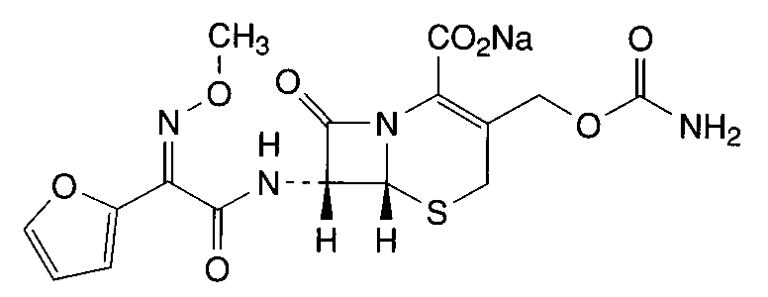 | Figure 2. Chimical structure cefuroxime sodium (CAS 56238-63-2) |
2. Experimental
2.1. Chemicals
- Cefuroxime (CFU) reference substance (purity 97.40%) was kindly supplied by Glaxosmithkline and cefuroxime sodium powder for injection Cellofarm Farmacêutica (São Paulo, Brazil). Cefuroxime sodium powder for injection (Zencef®) were claimed to contain 750 mg (as anhydrous base) of active drug.Potassium bromide (Merck, Darmstadt, Germany) used to the preparation of translucent pellets was of analytical grade and was previously dried at 120ºC for 2 h.
2.2. Instrumentation and Analytical Conditions
2.2.1. Equipment
- A conventional SHIMADZU IR Spectrometer Model FTIR 8300 (Tokyo, JP) with spectral digitalization was used for the analysis and obtaining data and respective absorption regions (wavelength region of 500-4000 cm-1 at 2 cm-1 intervals). After obtaining the IR spectrum and with the assistance of the IR Solution software, quantitative analysis was carried out in the spectral region between 1800 and 1700 cm-1, related to a carbonyl band of the cefuroxime molecule, and this band had its height analyzed in terms of absorbance.
2.2.2. Obtaining of Analytical Curve
- Equivalent amounts of 5.0, 7.0, 10.0, 15.0 and 20.0 mg of cefuroxime reference substance (previously diluted with potassium bromide 1:10, w/ w) were taken and diluted with sufficient amounts of potassium bromide to obtain 250 mg pellets. The powders were mixed and ground until obtaining a homogeneous mixture. Thus, this mixture was compressed in a mechanical die press for 15 minutes to obtain translucent pellets, through which the beam of the spectrometer can pass.
2.2.3. Determination of Cefuroxime in the Pharmaceutical Dosage Form
- Preparation of cefuroxime RS pelletsAmounts of powder equivalent to 1.5 mg of cefuroxime (15.0 mg of the 1:10 dilution in potassium bromide) were taken and homogenized with 235 mg of potassium bromide, making the total pellet weight of 250 mg. The determinations were performed in triplicate.Preparation of cefuroxime Sample PelletsThe contents of twenty vials of cefuroxime in powder for injection solution were mixed. From this mixture, amounts of 1.5 mg of cefuroxime (15.0 mg of the 1:10 dilution in potassium bromide) were taken and homogenized with 235 mg of potassium bromide, making the total pellet weight of 250 mg. The determinations were performed in triplicate.Readings were made at wavelength region of 500-4000 cm-1 and absorbances were monitored at 1475-1600 cm-1 region, that corresponding to the aromatic ring absorption region of the molecule.
2.2.4. Calculation of Cefuroxime Content in the Sample
- The cefuroxime concentration in the sample was calculated by Equation 2 and its percentage content was calculated by Equation 1.
 | (1) |
 | (2) |
2.3. Method Validation
- The method was validated by determining the following parameters: linearity, precision, accuracy, robustness, and detection and quantification limits, according to the literature recommendation[45].
2.3.1. Linearity
- To asses linearity of the method, doses of reference substance were evaluated on 3 different days. Regression lines were calculated by the least-squares method. Statistical evaluation was made by ANOVA. For the infrared spectrometric method, linearity was verified by analysis of 5 points at concentration range 5.0-20.0 mg.
2.3.2. Precision
|
2.3.3. Accuracy
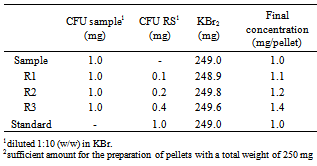
- Accuracy was attained via the recovery assay, in which known quantity of c RS was added to known quantity of the sample[45]. The recovery was performed in the 3 levels, R1, R2 and R3, and the pellets were prepared according to the Table 1, in triplicate.The recovery percentage was calculated by the equation determined by the Association of Official Analytical Chemists (AOAC)[46].
2.3.4. Robustness
- The robustness of the method was evaluated with the purpose of showing the reliability of the analysis concerning small variations in its working parameters. In other words, it shows that the validity of the method is maintained even with small variations in its working conditions. The following parameters were individually varied: total pellet weight, brand of potassium bromide and time compression. The obtained responses were evaluated according to the R.S.D. among the dosages.
2.3.5. Detection and Quantification Limits
- The detection (LOD) and quantification (LOQ) limits were calculated based on the intercept standard deviation and the curve slope, as described in the literature[45]. Three different curves were performed for the obtainment of the necessary data for the calculation. The values were calculated by the equations 3 and 4.
 | (3) |
 | (4) |
3. Results and Discussion
- Quality Control is a very important step in the process of drug manufacturing, as it ensures its safety and efficacy. Thus, research on quality control of pharmaceutical products to identify the content of active and the study of physical and chemical characteristics of the drug are essential to ensure the quality of the final product.In order to reduce environmental impacts of their activities on the environment, industries must seek alternatives to reduce, prevent or eliminate chemical residues in their routine processes. Thus, the replacement of analytical methods that employ organic solvents for others that do not employ them is an action may be taken for this purpose[47]. In that context, the infrared spectroscopy is a good option because it is a method that does not use organic solvents and also allows the quantification of compounds.
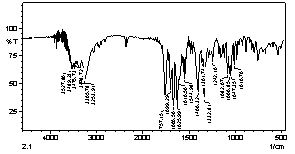
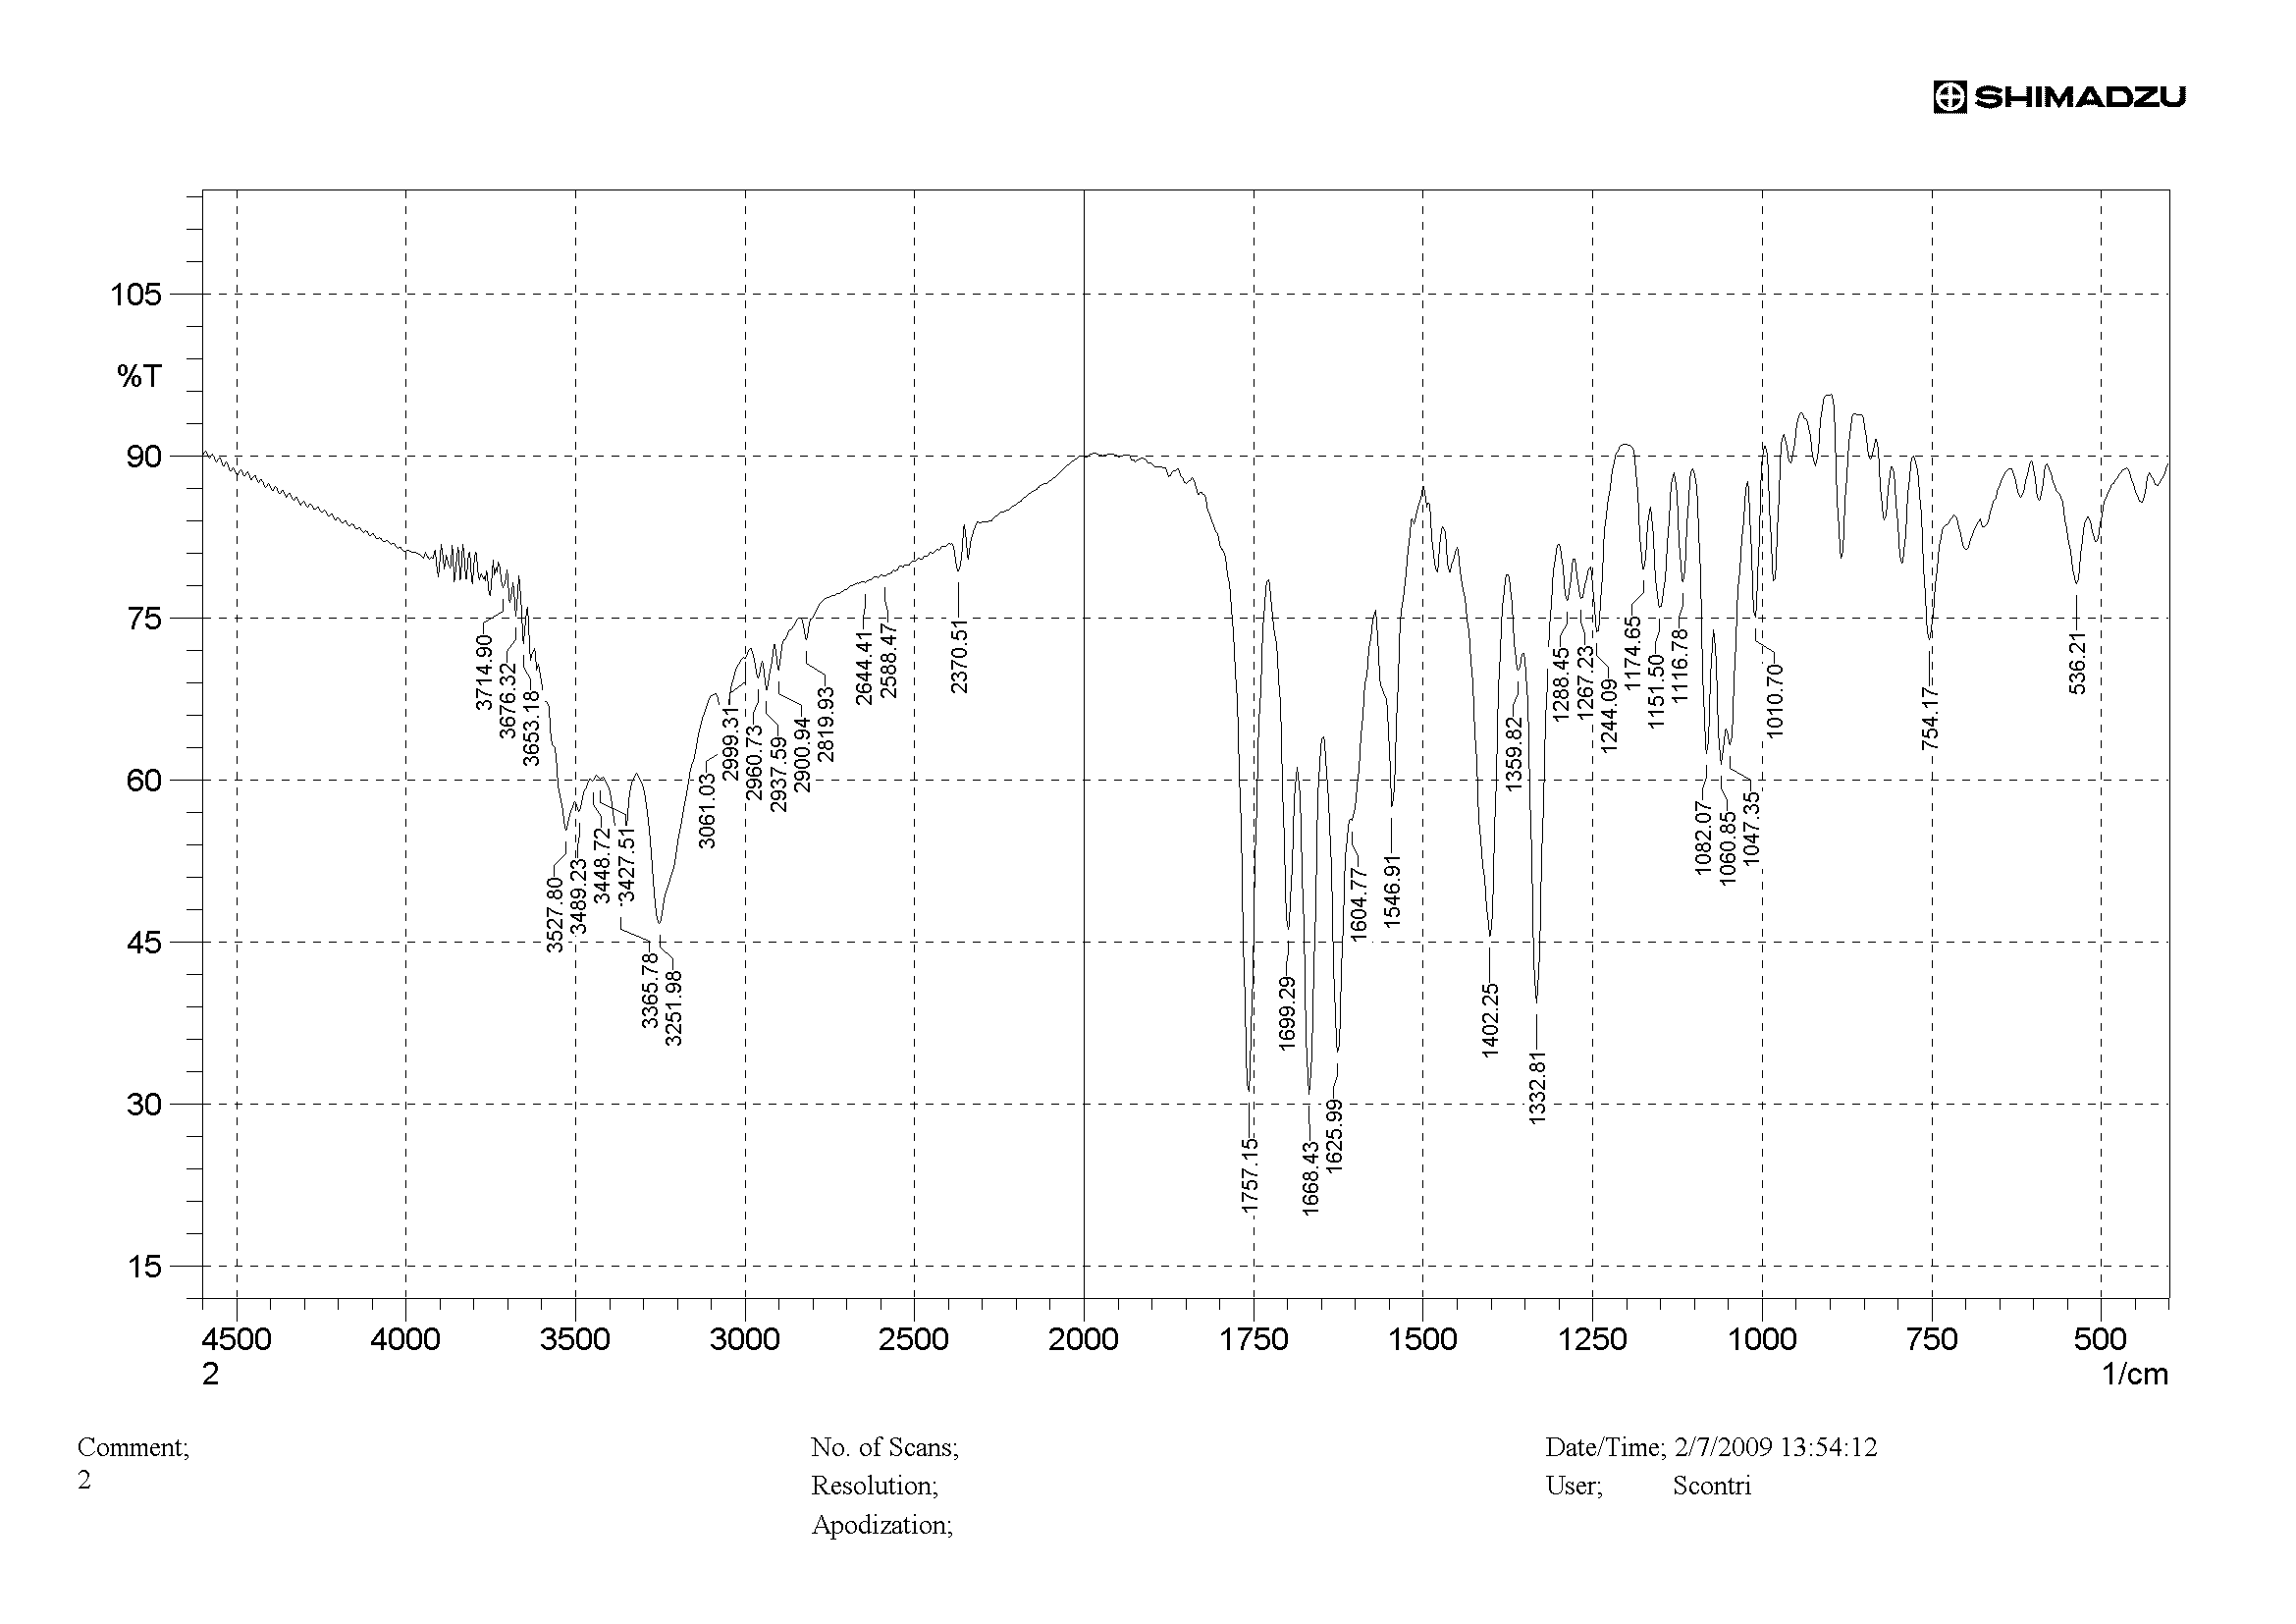 | Figure 3. Infrared spectrum of cefuroxime RS (concentration of 1 mg/pellet) |
|
3.1. Method Validation
3.1.1. Linearity
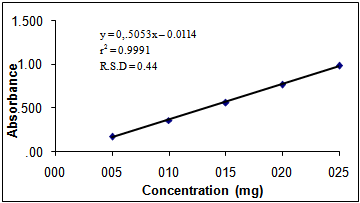 | Figure 4. Graphical representation of cefuroxime analytical curve by IR spectroscopy |
|
3.1.2. Precision
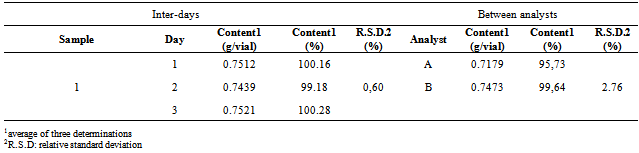
- The precision of the method was evaluated by three parameters: intra-day or repeatability, inter-days or intermediate precision, and between analysts. The results were expressed based on the R.S.D. The intra-assay precision provided the R.S.D. value of 0.60%. The R.S.D. values presented by the inter-assay and between-analysts were lower than 2.76%, and are represented in the Table 3. The data show a good precision of the method, since the R.S.D. values are close to 2% and below 5%.
3.1.3. Accuracy
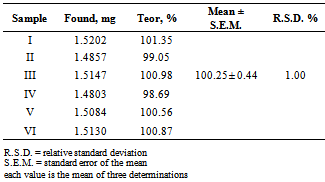
- The accuracy of the method was determined by the recovery assay, which was done in three concentration levels and the results are presented in the Table 4. The data shows that the method has the adequate accuracy, meaning that the experimental concentration values are very close to the real values, since in the range of 80% - 120%, the recovery rates were close to 100%.
3.1.4. Robustness
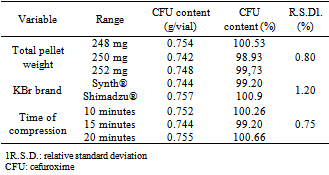
- The robustness was evaluated by small modifications, individually, in the following method parameters: total pellet weight, brand of potassium bromide and time compression. The results are represented in the Table 5. The R.S.D. values shown are smaller than 2%, showing the robustness of the analytical method for the analysis of the cefuroxime by IR spectroscopy.
|
3.1.5. Detection and Quantification Limits
- The detection and quantification limits were calculated in order to determine the sensibility of the method. The calculated value for the detection limit was of 0.15 mg, and the quantification limit was of 0.5 mg. The values obtained indicate the reliability of the method to detect and quantify the CFU powder for injectable preparation. The Figure 5 shows a graph of the limit of quantification.
 | Figure 5. Graphical representation of the quantification limit of cefuroxime injectable pharmaceutical form |
4. Conclusions
- The results showed that the infrared method for the cefuroxime in powder for injection preparation quantitation presented good linearity, precision, accuracy and robustness in the range of concentrations from 0.5 to 2.5 mg/pellet. Therefore, it is a method interchangeable with other methods already described for the same purpose and can be used in routine tests for quality control of a pharmaceutical industry. Furthermore, it has some advantages over other methods described in the literature for cefuroxime, and the main one is that do not use organic solvents, which contributes to the non-generation of this type of residue, contributing to minimize the environmental impact of pharmaceutical industries. In addition, this study opens the possibility of applying the IR spectroscopy to the quantification of other drugs.
ACKNOWLEDGEMENTS
- Authors thank Glaxo Smithkline Ltda for providing cefuroxime reference substance. This work was supported by PACD-FCFAr-UNESP-Brazil, FUNDUNESP-Brazil, FAPESP-Brazil and CNPq-Brazil.
References
| [1] | Humphrey P. Rang, Maureen M. Dale, James M. Ritter, Rod Flower. Rang & Dale: Farmacologia, 6th ed., Rio de Janeiro, Brazil: Elsevier 2007 |
| [2] | Laurence L. Brunton, John S. Lazo, Keith L. Parker. in: Goodman & Gilman: As bases farmacológicas da terapêutica, McGraw-Hill, New York, 2006. |
| [3] | Ohannesian Lena, Anthony J. Streeter. Handbook of Pharmaceutical Analysis, Marcel Dekker, New York, NY, 2002 |
| [4] | BRITISH Pharmacopoeia 2011. London: The Stationary Office, 2011. |
| [5] | Robert L. Pecsok, L. Donald Shields. Metodos Modernos de Analisis Quimico, Limusa, 1983, 487pp. |
| [6] | Jeffrey, G. H.; Basset, J.; Mendham, J.; Denney, R. C. Vogel: Análise Química Quantitativa, LTC Livros Técnicos e Científicos, Rio de Janeiro, 1992. |
| [7] | Harris D. Análise Química Quantitativa, LTC Livros Técnicos e Científicos, Rio de Janeiro, 2001. |
| [8] | Navarro P. G., Las Parras P.M., “Reaction of sodium amoxicillin with Cu(II) ion in a methanolic medium”. Journal of Pharmaceutical Sciences, vol. 80, pp. 904-907, 1991. |
| [9] | Zuhri A. Z. A., Rady A. H., El-Shahawi M. S., Al-Dhaheri S., “Metal complexes of penicillins and cephalosporins (Review)”. Microchemical, vol. 50, pp. 111-115, 1994. |
| [10] | Dimitrovska A., Andonovski B., Stojanoski K., “Spectrophotometric study of copper(II) ion complexes with cefaclor”. International Journal of Pharmaceutics, vol. 134, pp. 213-221, 1996. |
| [11] | Ayad M. M., Shalaby A. A., Abdellatef H. E., Ellsaid H. M., “Spectrophotometric and atomic absorption spectrometric determination of certain cephalosporins” Journal of Pharmaceutical and Biomedical Analysis, vol. 18, pp. 975-983, 1999. |
| [12] | Al-Momani I. F., “Spectrophotometric determination of selected cephalosporins in drug formulations using flow injection analysis”. Journal of Pharmaceutical and Biomedical Analysis, vol. 25, pp. 751-757, 2001 |
| [13] | Mohamed G. G.,”Spectrophotometric determination of ampicillin, dicluxacillin, flucloxacillin and amoxicillin antibiotic drugs: ion-pair formation with molybdenum and thiocyanate”. Journal of Pharmaceutical and Biomedical Analysis, vol. 24, pp. 561-567, 2001. |
| [14] | Martinez L. G., Falco P. C., Cabeza A. S. ”Comparison of several methods used for the determination of cephalosporins. Analysis of cephalexin in pharmaceutical samples”. Journal of Pharmaceutical and Biomedical Analysis, vol. 29, pp. 405-423, 2002. |
| [15] | Salem H., Askal H., “Colourimetric and AAS determination of cephalosporins using Reineck's salt”. Journal of Pharmaceutical and Biomedical Analysis, vol. 29, pp. 347-354, 2002. |
| [16] | El-Mammly M. Y., “Spectrophotometric determination of flucloxacillin in pharmaceutical preparations using some nitrophenols as a complexing agent”. Spectrochimica Acta, vol. 59, pp. 771-776, 2003. |
| [17] | Amin A. S., Ragab G. H., “Spectrophotometric determination of certain cephalosporins in pure form and in pharmaceutical formulations”. Spectrochimica Acta, vol. 60, pp. 2831-2835, 2004. |
| [18] | Aly H. M., Amin, A. S., “Utilization of ion exchanger and spectrophotometry for assaying amoxycillin and flucloxacillin in dosage form”. International Journal of Pharmaceutics, vol. 338, pp. 225–230, 2007. |
| [19] | Vieira D.C.M., SalgadH.R.N. “Comparison of HPLC and UV Spectrophotometric Methods for the Determination of Cefuroxime Sodium in Pharmaceutical Products” Journal of Chromatographic Science, vol. 49, pp. 508-511, 2011 |
| [20] | Myers C. M., Blumer J. L., “Determination of ceftazidime in biological fluids by using high-pressure liquid chromatography”. Antimicrobial. Agents Chemotherapy, vol 24, pp. 343-346, 1983. |
| [21] | Joshi S., “HPLC separation of antibiotics present in formulated and unformulated samples.” Journal of Pharmaceutical and Biomedical Analysis. vol. 28, pp. 795-809, 2002. |
| [22] | Adamis G., Papaioannou M. G., Giamarellos-Bourboulis E. J., Gargalianos P., Kosmidis J., Giamarellou H., “Pharmacokinetic interactions of ceftazidime, imiprenem and aztreonam with amikacin in healthy volunteers." International Journal of Antimicrobial Agents. vol. 23, pp. 144-149, 2004. |
| [23] | Zivanovic L., Ivanovic I., Vladimirov S., Zecevic M., “Investigation of chromatographic conditions for the separation of cefuroxime axetil and its geometric isomer.” Journal of Chromatography B, vol. 800, pp. 175-179, 2004. |
| [24] | Tozo G. C. G., Salgado H. R. N., “Determination of Lomefloxacin in Tablet Preparations by Liquid Chromatography”. Journal of AOAC International, vol.89, pp. 1305-1308, 2006. |
| [25] | Moreno A. H., Salgado H. R. N., “Development of a New High-Performance Liquid Chromatographic Method for the Determination of Ceftazidime”. Journal of AOAC International,vol. 91, pp. 739-743, 2008. |
| [26] | Flurer C. L., “Analysis of antibiotics by capillary electrophoresis.” Electrophoresi, vol. 18, pp. 2427 – 2437, 2005. |
| [27] | Fabre H., Blanchin M. D., Lerner D., Mandrou B., “Determination of cephalosporins utilising thin-layer chromatography with fluorescamine detection.” Analyst, vol. 110, pp. 775, 1985. |
| [28] | Farrell C.D., Rowell F.J., Cumming R.H., “A rapid fluorescence ELISA for ceftazidime.” Analytical Proceedings, vol. 32, pp. 205-206, 1995. |
| [29] | Aly F.A., Hefnawy M.M., Belal F., “A selective spectrofluorimetric method for the determination of cephalosporins in biological fluids.” Analytical Letters, vol. 29, pp. 1, 1996. |
| [30] | Yang J.H.,. Zhou G.J. Jie, N.Q, Han R.J., Lin C.G., Hu J.T., “Simultaneous determination of cephalexin and cephadroxil by using the coupling technique of synchronous fluorimetry and H-point standard additions method.” Analytica Chimica Acta, vol. 325, pp. 195-200, 1996. |
| [31] | Sengun F.I., Ulas K., Fedai I., Analytical investigations of cephalosporins-II. Polarographic behaviour of ceftriaxone, cefuroxime, cefotaxime and ceftizoxime and assay of their formulations. Journal of Pharmaceutical and Biomedical Analysis, vol. 3, pp. 191-199, 1985. |
| [32] | S. Altinoz, Ozer D., Temizer A., Yuksel N., Determination of ceftriaxone in aqueous humour and serum samples by differential-pulse adsorptive stripping voltametry, Analyst, vol. 119, pp. 1575-1577, 1994. |
| [33] | El-Maali N.A., Ali A.M.M., Ghandour M.A., Square-wave voltametric determination of cefoperazone in a bacterial culture, pharmaceutical drug, milk and urine, Electroanalysis, vol. 52, pp. 599-604, 1994. |
| [34] | Reddy G.V.S., Reddy S.J., Estimation of cephalosporin antibiotics by differential pulse polarography, Talanta, vol. 44, pp. 627-631, 1997. |
| [35] | Ozkan S.A., Erk N., Uslu B., Ylmaz N., BiryoI. l, Study on electrooxidation of cephadroxil monohydrate and its determination by differential pulse voltametry, Journal of Pharmaceutical and Biomedical Analysis, vol. 23, pp. 263-273, 2000. |
| [36] | Fogg A.G., Abadía M.A., Henriques H.P., Titrimetric determination of the yield of sulphide formed by alkaline degradation of cephalosporins. Analyst, vol. 107, pp. 449, 1982. |
| [37] | Tozo G.C.G., Salgado H.R.N., Microbiological assay for cefoxitin sodium in dosage form. Journal of AOAC International, vol.90, no.2, pp.452-455, 2007. |
| [38] | Moreno H., Salgado H.R.N., Microbiological assay for ceftazidime injection, Journal of AOAC International, vol. 90, pp. 1379-1382, 2007. |
| [39] | Vieira D.C.M., Ricarte P.C., Salgado H.R.N., Validation of Microbiological Assay for Determination of Cefuroxime in Injectable Preparations. Latin American Journal of Pharmacy, vol. 31, no 5, pp. 746-50, 2012. |
| [40] | Sadlej-Sosnowska N., Ocios A., Fuks L., Selectivity of similar compounds identification using IR spectrometry: β-lactam antibiotics. Journal of Molecular Structure, vol. 792-793, pp. 110-114, 2006. |
| [41] | Korolkovas, A., Burckhalter, J.H. Química Farmacêutica, Rio de Janeiro: Guanabara Koogan, 2008 |
| [42] | Matkovic S.R., Valle G.M., Galle M., Briand L.E., Desarollo y validación del análisis cuantitativo de ibuprofeno en comprimidos por espectroscopia infrarroja. Acta Farmaceutica Bonaerense, vol. 24, pp. 561-567, 2001. |
| [43] | Moreno A. H., Salgado H. R. N., Development and validation of the quantitative analysis of ceftazidime in powder for injection by infrared spectroscopy. Physical Chemistry Chemical Physics, vol. 2, pp. 6-11, 2012. |
| [44] | Tótoli E. G., Salgado H. R. N., Development and Validation of the Quantitative Analysis of Ampicillin Sodium in Powder for Injection by Fourier-transform Infrared Spectroscopy (FT-IR). Journal Heading Year, vol. 2, no 1, pp. 6-11, 2012. |
| [45] | International Harmonised Tripartite Guideline (ICH). Validation of analytical procedures: text and methodology Q2 (R1). Commission of the European Communities. Geneva, 2005 |
| [46] | Association of Official Analytical Chemists. Official methods of analysis, 17th ed., Gaithesburg: AOAC, 2002. |
| [47] | Nolasco F.R., Tavares G.A., Bendassolli J.A., “Implantação de programas de gerenciamento de resíduos químicos laboratoriais em universidades: análise crítica e recomendações”, Engenharia Sanitária Ambiental, vol. 11, no. 2, pp. 118-124, 2006 |
| [48] | Brazilian Pharmacopeia, 5th. ed., Brasília, Brazil: Anvisa, 2010 |
| [49] | Pavia D.L., Lampman G.M., Kriz G.S., Vyvyan J.R., Introdução à espectroscopia, 4th ed., São Paulo, Brazil: Cengage Learning, 2010. |
| [50] | Farouk F., Moussa B.A., Azzazy H.M.E-S., “Fourier transform infrared spectroscopy for in-process inspection, counterfeit detection and quality control of anti-diabetic drugs”, Spectroscopy, vol. 26, pp. 297-309, 2011. |