-
Paper Information
- Next Paper
- Paper Submission
-
Journal Information
- About This Journal
- Editorial Board
- Current Issue
- Archive
- Author Guidelines
- Contact Us
Advances in Analytical Chemistry
p-ISSN: 2163-2839 e-ISSN: 2163-2847
2012; 2(5): 46-52
doi: 10.5923/j.aac.20120205.01
The Chronoamperometric and Voltammetric Behaviour of Glutathione at Screen-Printed Carbon Micro-Band Electrodes Modified with Cobalt Phthalocyanine
 Abstract
 Reference
 Full-Text PDF
 Full-Text HTML
Kevin C. Honeychurch , John P. Hart
Centre for Research in Biosciences, Faculty of Applied Sciences, University of the West of England, Bristol, BS16 1QY, UK
Correspondence to: John P. Hart , Centre for Research in Biosciences, Faculty of Applied Sciences, University of the West of England, Bristol, BS16 1QY, UK.
| Email: |  |
Copyright © 2012 Scientific & Academic Publishing. All Rights Reserved.
Screen-printed carbon electrodes (SPCEs) incorporating the electrocatalyst cobalt phthalocyanine (CoPC) have been successfully used for the manufacture of microband electrodes for the determination of reduced glutathione (GSH). Initially investigations were performed to explore the cyclic voltammetric behaviour of these electrodes with potassium ferrocyanide. It was shown that steady state behaviour occurred which is indicative of radial diffusion at a microelectrode. Current densities of 2173 μAcm−2 were obtained compared to 464.4 μAcm−2 for conventional sized (3 mm x 3 mm) screen-printed electrodes were obtained. At scan rates between 5 and 20 mVs−1 no significant increase in current response was observed. The application of these microband CoPC–SPCEs, to the measurement of GSH by both chronoamperometry and cyclic voltammetry was investigated. The chronoamperometric response was found to be linear between 50 µM and 8.0 mM with a detection limit of 7.3 µM using an applied potential of +0.25 V (vs. Ag/AgCl).
Keywords: Glutathione, Cobalt Phthalocyanine Screen-Printed Carbon Electrodes, Voltammetry, Chronoamperometry, Microband Electrodes
Cite this paper: Kevin C. Honeychurch , John P. Hart , "The Chronoamperometric and Voltammetric Behaviour of Glutathione at Screen-Printed Carbon Micro-Band Electrodes Modified with Cobalt Phthalocyanine", Advances in Analytical Chemistry, Vol. 2 No. 5, 2012, pp. 46-52. doi: 10.5923/j.aac.20120205.01.
Article Outline
1. Introduction
- In a number of recent reviews we have reported on the wide range of applications in which screen-printed carbon electrodes (SPCEs) are presently utilised[1-4]. The majority of these applications have employed working electrodes with geometric areas typically in the square millimetre range. However, to our knowledge there are relatively few studies which have utilised SPCEs for the fabrication of working electrodes in the micrometer (µm) range[5-12]. Such electrodes exhibit a number of analytically advantageous features, such as, improved signal to noise ratios, independence of forced convection and low ohmic drop[13,14]. This can be also be advantageous in a number of application areas, such as in vitro cell toxicity studies, as they greatly reduce any perturbation of cell metabolism that may result from in situ electrochemically monitoring. The endogenous antioxidant glutathione (GSH) (i) is afrequently monitored compound in such studies[15] providing a good correlation with the redox and detoxification status of the cell[16]. As a reflection of the importance of monitoring GSH, various analytical techniques have been utilised for its determination[17-20]. However, the directelectrochemical of oxidation GSH occurs at relatively high potentials, leading to problems of selectivity in its application; consequently, a number of authors have used some form of electrochemical catalyst to mediate this reaction to more analytically useful potentials[21-27]. Previously we have reported on the electrochemical behaviour and determination of GSH, at several different carbon based electrodes incorporating the mediator, cobalt phthalocyanine (CoPC) (ii)[24-27].
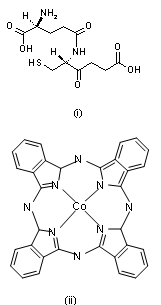 | Scheme (1). structures of (i) glutathione and (ii) cobalt phthalocyanine |
 | (1) |
 | (2) |
 | (3) |
 | (4) |
2. Experimental
2.1. Chemicals and Reagents
- All standard reagents were purchased from Fisher Scientific unless otherwise stated. Deionised water was obtained from a Purite RO200-Stillplus HP System, (Purite Oxon, UK). Separate stock solutions of disodium and monosodium o-phosphate were made at a concentration of 0.2 M by dissolving the appropriate mass of solids in deionised water. These were then titrated to give the required pH. Standard stock solutions of GSH were prepared by dissolving the appropriate mass in sufficient deionised water to give a concentration of 10 mM. Potassium ferrocyanide stock solutions were made in a similar manner. Minimum Essential Medium Eagle (MEM) cell culture media was obtained from Sigma (Poole, UK).
2.2. Apparatus
- Voltammetric and chronoamperometric studies were performed with a Pstat10 potentiostat interfaced to a PC for data acquisition via the General Purpose Electrochemical System Software Package (GPES) version 3.4 (Autolab, Windsor Scientific Limited, Slough, Berkshire UK). All experiments were undertaken using a two electrode cell, consisting of a Ag/AgCl screen-printedcounter/pseudoreference electrode and a CoPC-SPCE, as the working electrode supplied by Gwent Electronics Materials Ltd (GEM, Mamhilad, Gwent, UK) printed from C40511D8 ink.
2.3. Microband Formation
- The original screen-printed strip is shown in Figure 1a the electrode working area covered with a suitable dielectric (insulating tape, RS Components, Northamptonshire, UK). The end of the working electrode was cut-off perpendicular to the screen-printed carbon track to expose a cross section of the working electrode (figure 1b), sandwiched between the dielectric (insulting tape) and the PVC substrate, hence forming the microband electrode (2 mm x 20 µm) (figure 1c). The working and pseudoreference/counter electrodes were then connected to the potentiostat using a gold clip attached to coaxial cable inserted into the appropriate sockets. A small portion of the working electrode was removed before each measurement, in order to produce new carbon surface. Figure 2 shows an electron micrograph of the microband CoPC SPCE. Here the exposed 20 µm ink layer can be clearly seen, sandwiched between the dielectric (upper) and the PVC substrate (below).
2.4. Voltammetric Procedures
- Cyclic voltammograms were recorded with plain 10 ml aliquots of the supporting electrolyte (0.1 M phosphate buffer pH 7) and then with the same solution containing the analyte under investigation. The voltammetric conditions were as follows: initial and final potentials, -0.2 V, with a switching potential of +1.0 V. All experiments were undertaken at 37℃.
2.5. Optimisation of the Chronoamperometric Potential for Glutathione Detection
- In order to deduce the optimum applied potential for calibration studies, chronoamperometric measurements were made at various potentials in a solution containing 5.1 mM GSH 40 s after the application of each potential. This was achieved by transferring a 5 ml aliquot of GSH solution to the cell, stepping the potential from open circuit to 0.2 V and then stepping in 50 mV to a final potential of +0.4 V. The resulting data was used to plot a voltammogram from which we could identify the optimum potential to be used in further chronoamperometric studies.
2.6. Calibration Study on GSH Using Chronoamperometry with Microband CoPC–SPCEs
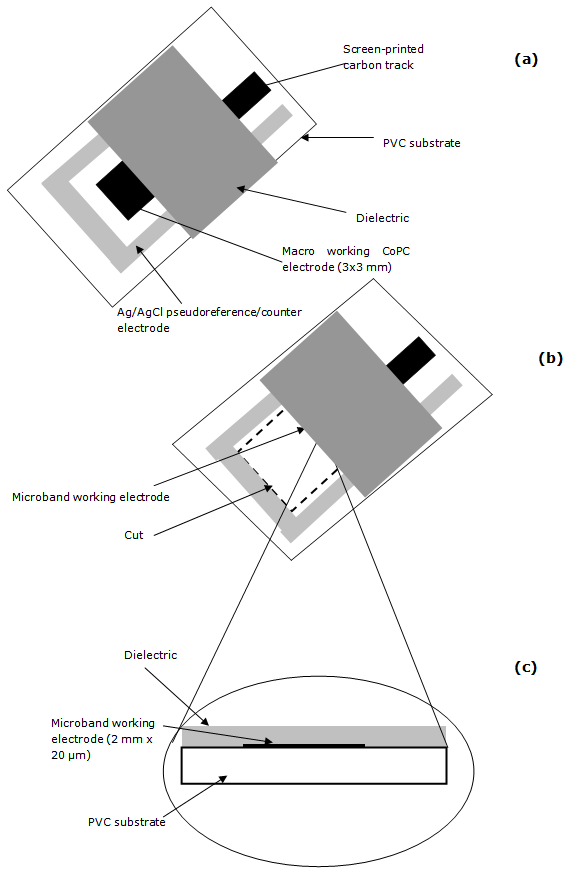 | Figure 1. Schematic diagram demonstrating the method for the manufacture of microband SPCEs |
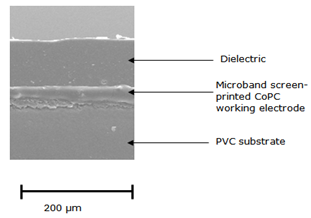 | Figure 2. Scanning electron micrograph of a microband CoPC-SPCE |
2.7. Analytical Application
- A four mL aliquot of MEM was taken and diluted four mL of 0.2 M phosphate buffer pH 7.3 and a potential of +0.25 V was applied. The system was left to reach a steady-state current (about 100 s), then a total of six 5 µL additions of a 102 mM GSH standard were made to the cell, using a micropipette, and ensuring steady-state currents between additions. All measurements were made in quiescent solution.
3. Results and Discussion
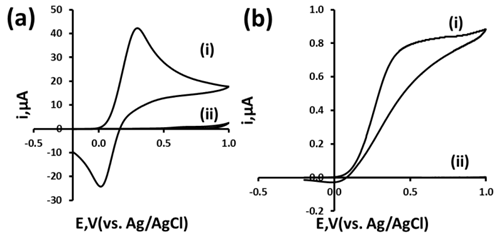 | Figure 3. Cyclic voltammograms obtained with 5.1 mM potassium ferrocyanide using a conventional sized CoPC–SPCE: a(i) (area 0.09 cm2) and microband CoPC–SPCE b(i) (area 4.0 × 10⁻⁴cm2). Cyclic voltammograms for plain 0.1 M phosphate buffer at pH 7.3, obtained for conventional sized CoPC–SPCEs a(ii) and microband CoPC–SPCEs b(ii) |
3.1. Cyclic Voltammetric Investigations Using Microband CoPC–SPCEs with Potassium Ferrocyanide
- Initial investigations were performed using cyclic voltammetry with our macro and microband CoPC-SPCEs with a 5.1 mM potassium ferrocyanide solution. Figure 3a(i) shows a typical cyclic voltammogram obtained for 5.1 mM potassium ferrocyanide 0.1 M phosphate buffer pH 7.3 solution using a 3x3 mm CoPC-SPCE. A quasi-reversible redox couple is seen with this screen-printed electrode which exhibited typical peak shaped responses. In contrast to this, Figure 3b(i) shows a cyclic voltammogram obtained at our microband electrode. Clearly sigmoidal behaviour is obtained which is a diagnostic test for microelectrode behaviour. A current density of 2173 µAcm2 was obtained, compared to 464.4 µAcm2 obtained with a 3 x 3 mm macro SPCE. The large increase in current density indicates the elevated mass transport that occurs at the microband electrodes through radial diffusion. The effect of scan rate on the ferrocyanide oxidation was studied from 5 mVs1 to 20 mVs1. The voltammetric response of potassium ferrocyanide was found to be independent of scan rate over the range studied, again indicative of radial diffusion and microband electrode behaviour.
3.2. Cyclic Voltammetric Studies using Microband CoPC–SPCEs with Glutathione
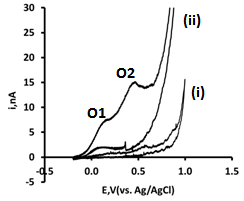 | Figure 4. Cyclic voltammograms obtained in the absence (i) and presence (ii) of 1.9 mM GSH in a 0.1 M phosphate buffer at pH 7.3 obtained at a microband CoPC–SPCE using a scan rate of 5 mVs1 |
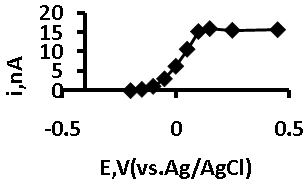 | Figure 5. A voltammogram of 5.1 mM GSH in 0.1 M phosphate buffer at pH 7.3 obtained using chronoamperometry in 50 mV steps up to +0.4 V |
3.3. Chronoamperometry
- To identify the optimum applied potential for thechronoamperometric measurements of GSH, a voltammogram was obtained by increasing the applied potential from open circuit to +0.4 V in 50 mV steps; Figure 5 shows that the response becomes independent of the applied potential at potentials greater than +0.1 V. Form this, it was concluded that an applied potential of +0.25 V would be suitable for further chronoamperometric investigations.
3.4. Calibration Study
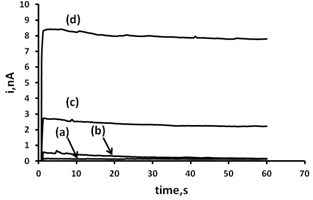 | Figure 6. Typical chronoamperograms obtained at microband CoPC–SPCEs using various concentrations of GSH of (a) 0.0, (b) 0.488, (c) 1.95, (d) 4.88 mM. The electrolyte was 0.1 M phosphate buffer at pH 7.3, with an applied potential of +0.25 .V |
3.5. Analytical Application
- The behaviour of GSH in MEM was investigated using the optimised assay. MEM is known be GSH free and only a small baseline current is observable using an applied potential of +0.25 V (Figure 7). The addition of 63.8 µM GSH to the system results in a rapid current increase resulting from the oxidation of GSH at the CoPC microband SPCE. Further additions of this standard resulted in a linear increase current over the range examined with an associated R2 = 0.999 (Figure 8). An estimated detection limit of 7.3 µM was calculated based on a signal-to-noise ratio of three.
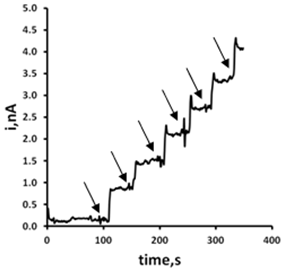 | Figure 7. Chronoamperometric investigations of GSH at a microband CoPC-SPCE electrode in MEM dilute 1:1 with 0.2 M phosphate buffer solution, pH 7.4 at 37℃. Arrows represent additions of 5 μL 102 mM GSH into 8 mL quiescent (stirred only to mix for 10 s) |
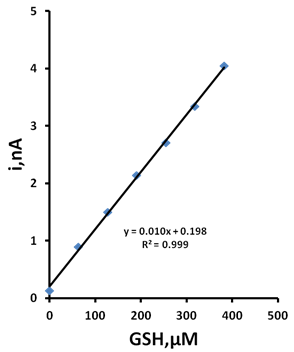 | Figure 8. Standard addition plot for GSH in MEM. Conditions as described in Figure 7 |
4. Conclusions
- To our knowledge, the present study is first report on the development of microband electrodes based on SPCEs modified with the electrocatalyst CoPC for the determination of GSH. We have demonstrated that these electrodes show behaviour which is characteristic of microelectrodes for both GSH and potassium ferrocyanide. Initial cyclic voltammetric investigations using 5 mM ferrocyanide in phosphate buffer solution with our macro (3x3 mm) CoPC–SPCEs showed typical diffusion control behaviour. However,voltammograms for this species obtained with our microband CoPC–SPCEs developed in this study showed much greater current density and a sigmoidal anodic wave with no cathodic response, typical of microelectrode behaviour. Further cyclic voltammetric investigations for the same microband electrodes, using 7 mM GSH in phosphate buffer at several different scan rates showed the response to be independent of scan rate, indicative of microband behaviour.Chronoamperometry was performed with these microband CoPC–SPCEs at different concentrations of GSH. Steady state behaviour was observed for each concentration investigated over the range 0 to 25 mM. The steady state current was found to be linearly related with GSH concentration over the range 50 µM-8 mM in 0.1 M phosphate buffer pH 7.2, at an applied potential of +0.25 V (vs. Ag/AgCl). This behaviour is important as it demonstrates possibility of monitoring GSH continuously which could be exploited for cell metabolism studies[32]. Future work will focus on such studies. Our performance characteristics compare well with those previously reported [24-27]. Pereira-Rodrigues et al[33] recently reported a similar linear range of 80 µM to 1 mM at a CoPC modified graphite electrode. However, these devices could not readily be mass produced at low cost to create disposable devices for cell metabolism studies. In addition, as they are macro-sized devices they would perturb the cell behaviour; therefore they would be unsuitable for the proposed application. Other reports[24-27] have described macro-sized CoPC-SPCEs for GSH determination with similar linear ranges to that obtained with our proposed microband CoPC-SPCE. However, as previously mentioned, these devices would be unsuitable for cell metabolism studies owning to the higher consumption of GSH. Importantly, microband CoPC-SPCEs would consume very little GSH and the solutions do not need stirring to give steady state currents as mass transport occurs by radial diffusion.
ACKNOWLEDGEMENTS
- The authors would like to thank the HEFCE for funding. They are grateful to Gwent Electronic Materials Ltd. for supplying the screen-printed carbon electrodes. Dr. Jinsheng Xu is thanked for the gift of the cell culture media and Dr. David Patton for his assistance with the SEM analysis.