-
Paper Information
- Previous Paper
- Paper Submission
-
Journal Information
- About This Journal
- Editorial Board
- Current Issue
- Archive
- Author Guidelines
- Contact Us
Advances in Analytical Chemistry
p-ISSN: 2163-2839 e-ISSN: 2163-2847
2012; 2(3): 14-24
doi: 10.5923/j.aac.20120203.02
Sediment Contamination Due to Toxic Heavy Metals in Mithi River of Mumbai
 Abstract
 Reference
 Full-Text PDF
 Full-Text HTML
Pravin U. Singare, Ravindra M. Mishra, Manisha P. Trivedi
Department of Chemistry, Bhavan’s College, Munshi Nagar, Andheri (West), Mumbai 400058, India
Correspondence to: Pravin U. Singare, Department of Chemistry, Bhavan’s College, Munshi Nagar, Andheri (West), Mumbai 400058, India.
| Email: |  |
Copyright © 2012 Scientific & Academic Publishing. All Rights Reserved.
The present study deals with quantification of accumulated toxic heavy metals in sediments of Mithi River of Mumbai. The study was performed at three different sampling locations along the flow of Mithi River for two years from 2009-12. The different heavy metals studied were Al, As, Cd, Cr, Hg, Ni, Pb, Sr and Mn. The results of our study indicate that the concentration level of these toxic heavy metals for the two assessment years increases by the factor of 1.2-5.8 µg/g. The result is a clear indication of day by day increasing pollution level of the Mithi River, which is creating negative environmental impact on biological life of the river. The results emphasises the need of regular scientific monitoring of different pollutants adversely affecting the environment and to reframe the pollution control strategies already in existence.
Keywords: Sediments, Toxic Heavy Metals, Quantification Study, Environmental Impact, Biological Life, Mithi River, Mumbai, India
Article Outline
1. Introduction
- Among the inorganic contaminants of the river water, heavy metals are getting importance for their non-degradable nature and often accumulate through tropic level causing adeleterious biological effect. These toxic heavy metals are creating more serious environmental problem owing to their long biological half lives. It is also difficult to remove them completely from the environment once they enter into it. Rivers are a dominant pathway for transport of these heavy metals[1, 2] which have become significant pollutants of many riverine systems. Anthropogenic activities like mining, ultimate disposal of treated/untreated waste effluents containing toxic metals as well as metal chelates[3] from different industries and also the indiscriminate use of heavy metal containing fertilizers and pesticides in agriculture resulted in deterioration of water quality rendering serious environmental problems posing threat on human beings[4] and sustaining aquatic biodiversity[5,6]. Though some of the metals like Cu, Fe, Mn, Ni and Zn are essential as micro nutrients for life processes in plants and microorganisms, while many other metals like Cd, Cr and Pb have unknown physiological activity, but they are proved detrimental beyond a certain limit[7], which is very much narrow for some elements like Cd (0.01 mg/L), Pb (0.10 mg/L) and Cu (0.050 mg/L). The deadlier diseases like edema of eyelids, tumor, congestion of nasal mucous membranes and pharynx,stuffiness of the head and gastrointestinal, muscular, reproductive, neurological and genetic malfunctions caused by some of these heavy metals have been documented[8,9].The behavior of metals in natural waters is a function of the substrate sediment composition, the suspended sediment composition, and the water chemistry. During their transport, the heavy metals undergo numerous changes in their speciation due to dissolution, precipitation, sorption and complexation phenomena[10, 11] which affect their behaviour and bioavailability[12, 13]. The overall behavior of heavy metals in an aquatic environment is strongly influenced by the associations of metals with various geochemical phases in sediments[14]. Due to their particle reactivity, metals tend to accumulate in sediments, and, as a result, may persist in the environment long after their primary source has been removed. These toxic metals are not necessarily fixed by the sediments permanently, but may be recycled via biological and chemical agents both within the sedimentary compartment as well as in the water column. Behaviour of these metals in the coastal marine sediments is largely related to their capacity for complexation with organic matter in truly dissolved, colloidal, macro particulate phases. These metals entering the ecosystem may lead to geoaccumulation, bioaccumulation, biomagnification and may have possibilities for environmental transformation into more toxic form. These toxic heavy metals entering in aquatic environment are adsorbed onto particulate matter, although they can form free metal ions and soluble complexes that are available for uptake by biological organisms[15] or get deposited in estuarine sediments[16]. Once deposited, binding by sulphides and/or iron hydroxides immobilizes trace metals until a change in redox or pH occurs[17, 18].In hydrosphere, toxic metal concentrations are typically orders of magnitude greater in the sediments as compared to those in overlying waters. Thus, superficial sediments, particularly the fine fraction, accumulate toxic heavy metals and provide a means for evaluating the long term accumulation of these metal contaminants[17, 19]. The capacity of sediments to concentrate trace levels of most of the metals also make them useful indicators for monitoring purposes and for detecting sources of pollution in the aquatic system. These heavy metals are sensitive indicators for monitoring changes in the water environment. Also the experimental data obtained based on analysis of sediment cores helps to provide a historical record of the heavy metal burdens. The monitoring these toxic heavy metals are important for safety assessment of the environment and human health in particular.The problem of environmental pollution due to heavy metals has begun to cause concern now in most of the major metropolitan cities in Maharashtra state and Mumbai is not an exception to it. The day by day increasing tremendous pollution of water bodies[20-30] has prompted us to carry the systematic and detail study of pollution due to toxic heavy metals in sediments at different sampling stations along the flow of Mithi River which is considered as one of the heavily polluted river of Mumbai.
2. Materials and Methods
2.1. Area of Study
- The water sampling was done from three different sampling stations along the flow of Mithi River namely Airport (L1), CST Kalina (L2) and BKC Taximen’s Colony (L3). Airport site near Jari Mari area is thickly populated and has many small scale industries including scrap dealers. Previous short term study conducted by Maharashtra Pollution Control Board shows the presence of cyanide, consistent high COD, oil and grease found at this station indicating some chemical activity in that area[21]. Unauthorized encroachments by illegal industrial units, scrap dealers and oil mixing business at CST road near Kalina, have further resulted in discharge of solid waste, organic waste, industrial waste, heavy metals, oils and tar in the river. This sampling point is surrounded by many small scale industries including recyclers, barrel cleaners, workshops and other units. This area has thick density of population. Illegal activities like washing of oily drums have resulted in discharge of unauthorized hazardous waste which is carried out along the bank of this river. Development of Bandra-Kurla Complex has resulted in diversion and unnatural turn along the Mithi River at few places thereby affecting natural flow of the river and seriously affected the drainage. This part of the river is a dumping ground for garbage and it is reflected in higher values of suspended solids. The organic waste, sludge and garbage dumping has reduced the carrying capacity of the Mithi River. The solid wastes which is discharged in to the Mithi river from the surrounding illegal industries and the slums has resulted in sever water logging during 26/7 deluge in Mumbai. The map showing flow of Mithi River is shown in Figure 1.
2.2. Climatic Conditions
- The area is located along western Arabian cost of India from 18 deg. 53’ north to 19 deg. 16’ north latitude and from 72 deg. east to 72 deg. 59’ longitude. The area experiences tropical savanna climate. It receives heavy south west monsoon rainfall, measuring 2166 mm on an average every year. The temperature ranges from 16 deg. centigrade to 39 deg. centigrade with marginal changes between summer and winter months. Whereas relative humidity ranges between 54.5 to 85.5%.
2.3. Requirements
- The chemicals and reagent were used for analysis were of Analytical Reagent (AR) grade. The procedure for calculating the different parameters were conducted in the laboratory. The laboratory apparatus were soaked in nitric acid before the analysis. After acid soaked, it is rinsed thoroughly with tap water and de-ionised distilled water to ensure complete removal of any traces of cleaning reagents. Finally, it is dried and stored in a clean place. The pipettes and burette were rinsed with solution before final use.
2.4. Sediment Sampling, Preparation and Analyses
- The sediment samples were collected randomly four times in a month in morning, afternoon and evening session from three different sampling stations along the flow of Mithi River (Figure 1). The samples were collected and subsequently analysed for a span of two years starting from October 2009 to September 2011. The sampling was done in three shifts i.e. morning shift between 07:00 a.m. to 09:00 a.m., afternoon shift between 02:00 p.m. to 04:00 p.m. and evening shift between 07:00 p.m. to 09:00 p.m. Sediment samples were collected by hand-pushing plastic core tubes (7 cm diameter) as far as possible into the sediment. The sediment cores retrieved in the field were sliced on arrival at the lab at 1-cm depth intervals for the first 15 cm, 2-cm depth intervals from 15–25 cm, and then every 5 cm for the deeper sections of the cores. The sediments were kept cool in icebox during the transportation to the laboratory[31, 32]. They were then ground manually to a fine powder in an alumina mortar; passed through a 2-mm mesh screen and stored / preserved in polyethylene bags for further analysis. Well-mixed samples of 2 g each was taken in 250 mL glass beakers and digested with 8 mL of aqua regia on a sand bath for 2 hr. After evaporation to near dryness, the samples were dissolved with 10 mL of 2% nitric acid and filtered through Whatman’s No.1 filter paper. The samples were subjected to nitric acid digestion using the microwave-assisted technique, setting pressure at 30 bar and power at 700 W[33, 34]. About 400 mL of the sample was transformed into clean glass separating funnel in which 10 mL of 2% ammonium pyrrolidine dithiocarbamate, 4 mL of 0.5 M HCl and 10 mL of methyl isobutyl ketone (MIBK) are added[35]. The solution in separating funnel was shaken vigorously for 2 min and was left undisturbed for the phases to separate. The MIBK extract containing the desired metals was then diluted to give final volumes depending on the suspected level of the metals[36]. The sample solution was then aspirated into air acetylene flame in an atomic absorption spectrophotometer.
2.5. Heavy Metal Analysis By AAS Technique
- The analysis for the majority of the trace metals like aluminum (Al), cadmium (Cd), chromium (Cr), nickel (Ni), lead (Pb), strontium (Sr) and manganese (Mn) was done by Perkin Elmer ASS-280 Flame Atomic Absorption Spectrophotometer. Arsenic (As) was determined by hydride generation coupled with an atomic fluorescence detector, while mercury (Hg) was analysed with a cold-vapour atomic adsorption spectrophotometer. An atomizer with an air/acetylene burner was used for determining all the elements investigated. All instrumental settings were those recommended in the manufacturer’s manual book. To analyse the solutions extracted, an aliquot 100 µL of the solution was introduced to nebulizer of flame AAS. The detection limits of Al, As, Cd, Cr, Hg, Ni, Pb, Sr and Mn 15, 20, 2, 20,5,25,45, 10 and 5 µg/g respectively. The calibration curves were prepared separately for all the metals by running different concentrations of standard solutions. A reagent blank was taken through the method, analyzed and subtracted from the samples to correct for reagent impurities and other sources of errors from the environment. Average values of three replicates were taken for each determination.
2.6. Quality Control/Assurance
- Sediment samples were collected with plastic-made implements to avoid contamination. Samples were kept in polythene bags that were free from heavy metals and organics and well covered while transporting from field to the laboratory to avoid contamination from the environment. Reagent blanks were used in all analyses to check reagent impurities and other environmental contaminations during analyses. Analytical grade reagents were used for all analyses. All glassware used were soaked in appropriate dilute acids overnight and washed with teepol and rinsed with deionised water before use. Tools and work surfaces were carefully cleaned for each sample during grinding to avoid cross contamination. Replicate samples were analysed to check precision of the analytical method and instrument. To validate the analytical procedures used, the spike recovery test was conducted on some sediment samples for Al, As, Cd, Cr, Ni, Pb, Sr, Mn and Hg.
3. Results and Discussion
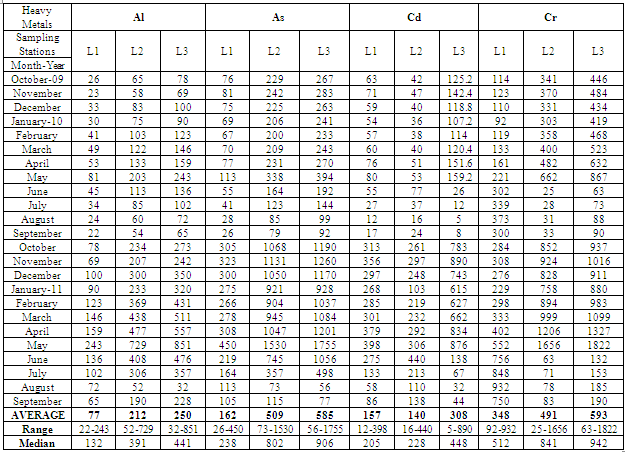
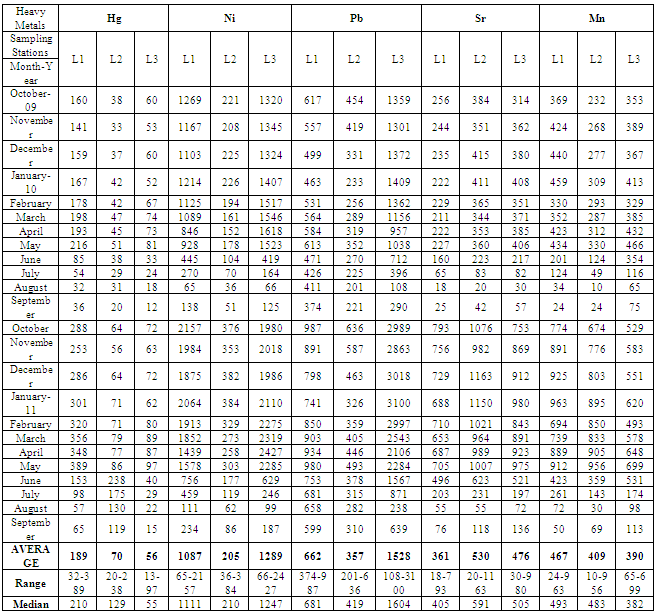
- Toxic heavy metals are released into the environment from metal smelting and refining industries, scrap metal, plastic and rubber industries, various consumer products and from burning of waste containing these elements. On release to the air, the elements travel for large distances and are deposited onto the soil, vegetation and water depending on their density. Discharge of treated/partially treated or untreated domestic and agricultural wastes also leads to the pollution of water bodies due to the heavy metals[37]. These metals entering in aquatic environment are adsorbed onto particulate matter, although they can form free metal ions and soluble complexes that are available for uptake by biological organisms. The metals associated with particulate material are also available for biological uptake, and are deposited in estuarine sediments[38]. Once deposited, binding by sulfides and/or iron hydroxides immobilises trace metals until a change in redox or pH occurs. Thus, surfical sediments, particularly the fine fraction, accumulate trace metals and provide a means for evaluating the long term accumulation of heavy metal contaminants[39]. These heavy metals which are accumulated in sediments are not degraded and persist in the environment for many years poisoning humans through inhalation, ingestion and skin absorption. Acute exposure leads to nausea, anorexia, vomiting, gastrointestinal abnormalities and dermatitis.The experimental data on concentration (µg/g) of toxic heavy metals like Al, As, Cd, Cr, Hg, Ni, Pb, Sr and Mn in the sediment samples collected along sampling stations L1, L2 and L3 of Mithi River is presented in Table 1. The trend in average concentration of these metals at different sampling stations for the assessment years 2009-10 and 2010-11 is graphically represented in Figures 2-4.From the results it was observed that aluminum (Al) concentration at different sampling stations lies in the range of 22-243, 52-729, and 32-851 µg/g at the respective sampling stations. The biyearly average Al concentration was found to be 77, 212 and 250 µg/g respectively at different sampling stations (Table 1). It was also observed that the average Al concentration for assessment year 2010-11 was higher than that obtained for the assessment year 2009-10 by a factor of 3.03 at L1 to 3.43 at L2 sampling stations (Figures 2-5). It is important here to note that aluminum toxicity is an important growth-limiting factor for plants in many acid soils, particularly in pH of 5.0 or below[40]. Aluminum toxicity in plants is often clearly identifiable through morphological and physiological symptoms. Differential tolerances to Al toxicity almost certainly involves differences in the structure and function of roots. Aluminum interferes with cell division in roots, decreases root respiration and uptake and use of water and nutrients, particularly calcium and phosphorous and metabolic pathway[41-43].Levels of arsenic (As) are higher in the aquatic environment than in most areas as it is fairly water-soluble and may be washed out of arsenic bearing rocks. Recently, the anthropogenic activities such as treatment of agricultural land with arsenical pesticides, treating of wood using chromated copper arsenate, burning of coal in thermal plants power stations and the operations of gold-mining have increased the environmental pervasiveness of As and its rate of discharge into freshwater habitat. Arsenic can also interfere with the fish immune system by suppressing antibody production[44] as well as by lowering macrophage activity and maturation[45]. Several studies are reporting As induced liver fibrosis, hepatocellular damage, inflammation, focal necrosis in addition to hepatocellular carcinoma[46]. In the present investigation it was observed that As concentration at L1, L2 and L3 sampling stations lies in the range of 26-450, 73-1530 and 56-1755 µg/g respectively. The biyearly average As concentration was found to be 162, 509 and 585 µg/g respectively at different sampling stations (Table 1). It was also observed that the average As concentration for assessment year 2010-11 was higher than that obtained for the assessment year 2009-10 by a factor of 3.98 at L1 to 4.25 at L2 sampling stations (Figures 2-5).Although emissions of cadmium (Cd) in the environment have markedly declined in most industrialized countries, Cd remains a source of concern for industrial workers and for populations living in polluted areas, especially in less developed countries[47]. Cd dispersed in the environment can persist in soils and sediments for decades[48]. When taken up by plants, Cd concentrates along the food chain and ultimately accumulates in the body of people eating contaminated foods[48]. By far, the most salient toxicological property of Cd is its exceptionally long half-life in the human body. Once absorbed, Cd irreversibly accumulates in the human body, in particularly in kidneys and other vital organs such the lungs or the liver[49]. In addition to its extraordinary cumulative properties, Cd is also a highly toxic metal that can disrupt a number of biological systems, usually at doses that are much lower than most toxic metals[50]. In the present investigation it was observed that Cd concentration at L1, L2 and L3 sampling stations lies in the range of 12-398, 16-440 and 5-890 µg/g respectively. The biyearly average Cd concentration was found to be 157, 140 and 308 µg/g respectively at different sampling stations (Table 1). It was also observed that the average Cd concentration for assessment year 2010-11 was higher than that obtained for the assessment year 2009-10 by a factor of 5.04 at L1 to 5.78 at L3 sampling stations (Figures 2-5).Chromium (Cr) is one of the most common skin sensitizers and often causes skin sensitizing effect in the general public. A possible source of chromium exposure is waste dumps for chromate-producing plants causing local air or water pollution. Penetration of the skin will cause painless erosive ulceration (“chrome holes”) with delayed healing. These commonly occur on the fingers, knuckles, and forearms. The characteristic chrome sore begins as a papule, forming an ulcer with raised hard edges. Ulcers can penetrate deep into soft tissue or become the sites of secondary infection, but are not known to lead to malignancy[51, 52]. Besides the lungs and intestinal tract, the liver and kidney are often target organs for chromate toxicity[53]. In natural waters, exposure to Cr has demonstrated cumulative deleterious effects on fishes as a function of time[54, 55]. In the present investigation it was observed that Cr concentration at L1, L2 and L3 sampling stations lies in the range of 92-932, 25-1656 and 63-1822 µg/g respectively. The biyearly average Cr concentration was found to be 348, 491 and 593 µg/g respectively at different sampling stations (Table 1). It was also observed that the average Cr concentration for assessment year 2010-11 was higher than that obtained for the assessment year 2009-10 by a factor of 2.10 at L3 to 2.50 at L1 and L2 sampling stations (Figures 2-5).Mercury (Hg) poisoning has become a problem of current interest as a result of environmental pollution on a global scale. Mercury is a strong phytotoxic as well as genotoxic metal. High concentration of mercury, which could pose an ecological hazard, leading to contamination of plants[56, 57], aquatic resources and bioaccumulation in the food chain[58]. Although elemental mercury is relatively innocuous and non-toxic, it can be converted to organomercurials, which are particularly toxic and are retained in the cells of plants and living organisms. Reports by Tanaka[59] and Goldstone et al.[60] have dwelt on the natural alkylation of total mercury in waste water and water bodies. Recent studies have also reported that the inorganic mercury is transformed into methylmercury through microbial activity, which is the most toxic and most bioavailable form of mercury for living organisms[61]. Bodaly et al.[62] have reported that treated sewage water discharged into rivers and similar water bodies could result in an appreciable increase in the buildup of alkyl mercury. In the present investigation it was observed that Hg concentration at L1, L2 and L3 sampling stations lies in the range of 32-389, 20-238 and 13-97 µg/g respectively. The biyearly average Hg concentration was found to be 189, 70 and 56 µg/g respectively at different sampling stations (Table 1). It was also observed that the average Hg concentration for assessment year 2010-11 was higher than that obtained for the assessment year 2009-10 by a factor of 1.20 at L3 to 2.71 at L2 sampling stations (Figures 2-5).Nickel(Ni) and nickel compounds have many industrial and commercial uses, and the progress of industrialization has led to increased emission of pollutants into ecosystems. Nickel is easily accumulated in the biota, particularly in the phytoplankton or other aquatic plants, which are sensitive bioindicators of water pollution. It can be deposited in the sediment by such processes as precipitation, complexation and adsorption on clay particles and via uptake by biota[63, 64]. Levels of precipitation of Ni of 0.9 mg/m2/year over long periods were found to be dangerous for biological systems of fresh water catchments[65]. In rivers, nickel is transported mainly as a precipitated coating on particles and in association with organic matter. Recent studies have suggested an increase in cancer in nickel refinery areas where exposure to water-soluble nickel salts occurs[66]. Nickel has been shown to be immunotoxic, altering the activity of all specific types involved in the immunological response, resulting in contact dermatitis or asthma. Human exposure to highly nickel-polluted environments has the potential to produce a variety of pathological effects. Among them are skin allergies, lung fibrosis, cancer of the respiratory tract and iatrogenic nickel poisoning[67]. While no reproductive effects have been associated with nickel exposure to humans, several studies on laboratory animals have demonstrated fetotoxicity[68]. In the present investigation it was observed that Ni concentration at L1, L2 and L3 sampling stations lies in the range of 65-2157, 36-384 and 66-2427 µg/g respectively. The biyearly average Ni concentration was found to be 1087, 205 and 1289 µg/g respectively at different sampling stations (Table 1). It was also observed that the average Ni concentration for assessment year 2010-11 was higher than that obtained for the assessment year 2009-10 by a factor of 1.50 at L3 to 1.70 at L1 and L2 sampling stations (Figures 2-5).Lead (Pb) inhibits plant growth, reduces photosynthesis, and reduces mitosis and water absorption. Lead concentrations in aquatic (and terrestrial) vertebrates tend to increase with increasing age of the organism, and to localize in hard tissues such as bone and teeth. Tetramethyl lead reportedly was produced from biological and chemical methylation of several inorganic and organic Pb compounds in the aquatic environment, and has been detected at low concentrations in marine mussels, lobsters, and bony fishes.
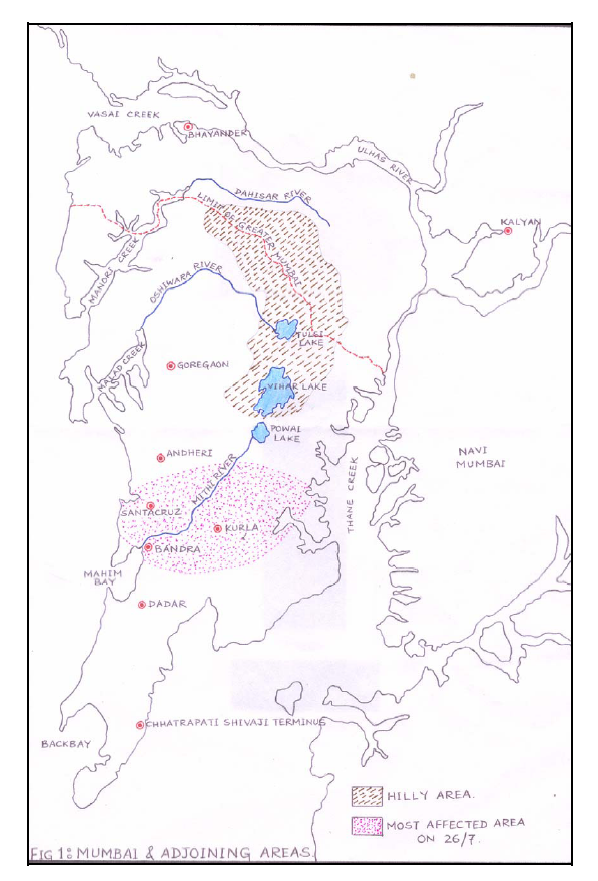 | Figure 1. Map showing flow of Mithi River in Mumbai |
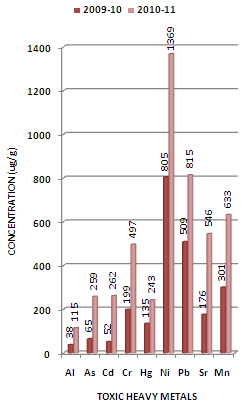 | Figure 2. Variation in average concentration values of different toxic heavy metals in sediment samples collected at L-1 sampling station of Mithi River during the assessment year 2009-10 and 2010-11 |
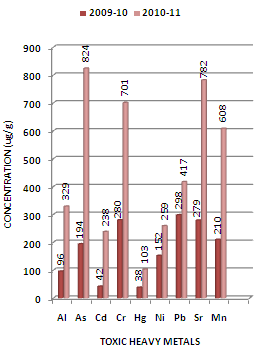 | Figure 3. Variation in average concentration values of different toxic heavy metals in sediment samples collected at L-2 sampling station of Mithi River during the assessment year 2009-10 and 2010-11 |
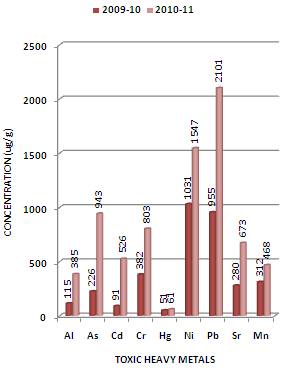 | Figure 4. Variation in average concentration values of different toxic heavy metals in sediment samples collected at L-3 sampling station of Mithi River during the assessment year 2009-10 and 2010-11 |
|
|
4. Conclusions
- Heavy metal pollution is an ever-increasing problem of our oceans, lakes and rivers. Incidence of heavy metal accumulation in fish, oysters, sediments and other components of aquatic ecosystems have been reported from all over the world. Environmental problems concerning coastal and aquatic bodies cannot be addressed in isolation. They are intricately interwoven with each other. The environments of land and sea are interdependent, linked by complex atmospheric, geological, physical, chemical and biological interactions. The human activities that affect and arise from this environment also depend on economic and social factors. The problem is beyond the limits of physical and institutional bodies and therefore, there is a need to set common objectives and implement compatible policies and programmes. Today, it is realised that solution to environmental problem can only be achieved through a comprehensive, systematic and sustained approach. During the past few years, attempts were made by various groups to develop strategies directed towards more integrated approach in coastal environments. The present data on heavy metal pollution in sediment samples collected along the Mithi River of Mumbai also points out to the need of regular monitoring of water resources and further improvement in the industrial wastewater treatment methods. What is more fundamentally lacking is a consistent, internationally recognised and data driven strategy to assess the quality of aquatic bodies and generation of international standards for evaluation of levels of contaminants.
ACKNOWLEDGEMENTS
- The authors are thankful to SAP Productions for developing and maintaining the paper template.