-
Paper Information
- Paper Submission
-
Journal Information
- About This Journal
- Editorial Board
- Current Issue
- Archive
- Author Guidelines
- Contact Us
Advances in Analytical Chemistry
p-ISSN: 2163-2839 e-ISSN: 2163-2847
2012; 2(2): 1-5
doi: 10.5923/j.aac.20120202.01
Applicability of Linear Regression Model for the Estimation of Mobility Factor of Heavy Metal in Contaminated Soil against Native Concentrations
 Abstract
 Reference
 Full-Text PDF
 Full-Text HTML
Lawan I. Bukar 1, Stephen S. Hati 2, Goni A. Dimari 1, Maimuna Waziri 3
1Department of Chemistry, University of Maiduguri, Nigeria
2Department of Chemistry, IBB University Lapai, Nigeria
3Department of Chemistry, BAI University Damaturu, Nigeria
Correspondence to: Stephen S. Hati , Department of Chemistry, IBB University Lapai, Nigeria.
| Email: |  |
Copyright © 2012 Scientific & Academic Publishing. All Rights Reserved.
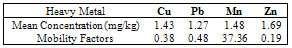
This study posits a far-reaching aggregation of considerations for the immediate natural conditions of soil under assessment with the application of simplistic linear regression analysis to deduce a mobility factor for heavy metals in soil. Attempting thereby to eliminate the weaknesses observed in adsorption tests, the rigors of infiltration tests and chemical fractionation procedures. Therefore vertical depth profile (0-5cm, 5-50cm and 50-100cm) of contaminated soil samples at municipal dumpsites and native soil (uncontaminated reference samples) concentrations of Cu, Mn, Pb and Zn were analysed using inductively coupled plasma – optical emission spectrometry (ICP-OES). The results of linear regression analysis considered the value of slope in the equation for the estimation of mobility factor of heavy metals in contaminated soil. The following average order of mobility factor for the heavy metals, Mn (37.36) > Pb (0.48) > Cu (0.38) > Zn (0.19) was established. This order was certainly not dependent on concentration, which allude to already established facts that several factors influence the mobility of heavy metals in soil. Apart from the estimation of mobility factors for the heavy metals, the equation was also found to be useful in predicting the concentration of heavy metals at dumpsites given a reference concentration value.
Keywords: Dumpsite Soil, Native Concentration, Heavy Metals, Regression Model, Mobility Factor
Article Outline
1. Introduction
- The diverse interests of researchers from the diverse field of soil and environmental sciences are consequential to the several methods and variables contained in the estimation of mobility of heavy metals in soil[1]. However, the terms: migration, immobilization or movements of heavy metals and its distribution throughout the soil system is synonymous with the diverse interests. This is due to the fact that as soon as the retention capacity of soil is exceeded by metal load added or released to soil surface, especially from wastes materials, the mobility of metals into other environmental compartments commences under several favorable conditions[2].Therefore, vertical distribution of heavy metals in soil has been well researched[3-5] and are generally intended mainly for the estimation of the risk of contamination to soil, plants and groundwater quality[6-8]. Notable methods of estimating heavy metal mobility in soils are the adsorption experiments (or batch tests) and the infiltration tests.The earlier method is prominent but is weakened by lack of real field conditions and the underestimation of heavy metal availability[9,10], making it complex to present comprehensible conclusions[11]. Conversely, the infiltration tests take into account the conditions of the natural environment, though strictly exigent to perform[9].Models for the estimation of mobility have also been developed from mathematical background for simulating concentrations[12] and modeling heavy metal transport based on the typical approach of the convection-dispersion equation[13]. Mobility factor is another important parameter that is also estimated for heavy metals in soil and particularly useful for presenting the estimated concentrations of the heavy metals along vertical profile by an order[10,14]. These are submissions to make heavy metal mobility estimation facile, accurate and cost effective.This study posits a far-reaching aggregation of considerations for the immediate natural conditions of soil under study and the application of simplistic linear regression analysis to deduce a mobility factor for heavy metals in soil. Thereby eliminating the weaknesses observed in adsorption tests[9], the rigors of infiltration tests[10] and chemical fractionation [15] procedures.
2. Materials and Methods
2.1. Study Sites and Sample Collection
- The study was conducted in Maiduguri, Borno State Nigeria at coordinates: latitude 11°51'N and longitude 013°05'E. Dumpsites located in three different districts of Maiduguri metropolis comprising, Bulunkutu (B), Meri (M) and Zajeri (Z) and were identified and selected on the basis of divergent concomitant factors such as population density, variety of waste and magnitude of dumpsite. A fourth location was selected as a Reference site (REF) at the outskirt of Maiduguri metropolis, which is also unaffected by farm practice. This represented the site for native concentration of heavy metals. Sub-sampling clusters of six at each site were also generated to achieve analyte sampling representation.Soil samples were collected randomly[16] from the dumpsites and the reference site using depth calibrated soil auger. The sampling depths are surface level (0-5cm), 5-50cm and 50-100cm[17]. Samples were collected in clean polythene bags.
2.2. Determination of Heavy Metals
- Heavy metals (Cu, Mn, Pb and Zn) in the soil samples were determined by the ICP-OES methodology[18,19]. Soil samples preparations, prior to determination of metals, was carried out according to Method 3050B[20]. The homogenized samples were subjected to oven-drying and sieved through an equivalent USS #10 sieve. One gram (1g) portions of soil sample were separately digested by refluxing in 10ml 1:1 HNO3 for 10mins. This procedure was repeated with additional 5 ml of conc. HNO3 until digestion was completed. The evaporated (5 ml) was treated with 2ml water and 3ml 30% H2O2 in 1ml sequential aliquot addition until bubbling subsided. The digest was further reduced to 5ml and refluxed in 10ml conc. HCl for 15mins. This was filtered and made up to 100ml volume.The Aglient 710 Series ICP-OES (USA), operational with SPS auto-sampler was used for the determination of heavy metals. Samples were analysed under the instrumental operating conditions: RF Power 1.0 kW, Outer argon flow 12.0 L/min, Intermediate and Inner argon flow 1.0 L/min and the Nebulizer uptake rate (mL/min) 1.0. Standards calibration curves for the metal analytes already prepared covering the optimum working range stored in the system software was used to produce the computerized analysis report.
2.3. Data Analysis
- Data obtained were analysed using Analyse-it® v. 2.22 [21], statistical software for Microsoft Excel. Results are presented as mean ± standard deviation. Statistical variations were considered significant at p<0.05.The linear regression equation[22] was used for the estimation of metal mobility factor and forecasting metal concentrations at certain depth level. The equation was obtained from plotting a linear curve of each metal concentration at the Reference site against the metal concentrations at various dumpsite sites. Thus, from the equation, the mobility factor was deduced as the value of the slope in the equation. Further substituting the values of concentrations at Reference site in the equation at certain was also used to predict concentration of a metal at certain depth level.
3. Results
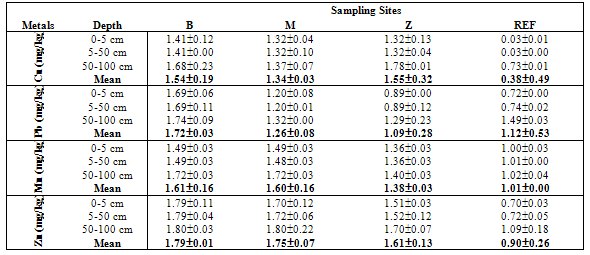
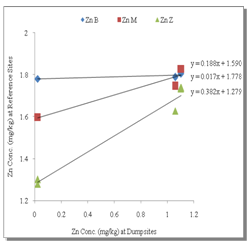
- Table 1 shows the summary results of heavy metals concentrations recorded at the different sampling sites by the respective depth profile. All the metals were detected at all sampling sites. Generally, higher concentrations of the heavy metals were observed as the depth appreciates downwards to 100cm. Zn showed the highest concentrations at all levels. However, analysis of variance (ANOVA) for pair wise test at p<0.05, shows that there was only a significant variation in Cu concentrations between 0-5cm and 50-100cm depth levels. Pb also showed significant variation in concentrations at all levels except 5-50cm and 50-100cm depth levels while, the pair wise test for Mn showed significant variation in concentrations between 5-50cm and 50-100cm depth levels. In contrast, Zn concentrations are not significant between all depth levels. The overall average order of concentration for the metals is Zn > Mn > Pb > Cu.Figure 1 shows the linear curve for Cu concentrations at the Reference site against the concentrations at various dumpsites. The equation for CuB is y = 0.4001x + 1.2902. The equation can also be expressed as CuB = 0.4001(CuRef) + 1.2902. The slope is 0.4001, which express the mobility factor of Cu at this dumpsite.Therefore mobility factor of Cu at dumpsites B, M and Z are 0.40, 0.07 and 0.66 respectively. The lowest is at M (0.07), while the highest is at Z (0.66) and the average for Cu is 0.38. However substituting the concentration values of CuRef at each point into the equation, CuB = 0.4001(CuRef) + 1.2902, gives the equivalent predicted value of CuB. This can be utilized as a model to predict concentration at a particular dumpsite. For instance, with a predicted CuRef concentration of 1.5mg/kg (which was not measured in this work), equivalent values of predicted Cu at the various dumpsites are PreCuB (1.89 mg/kg), PreCuM (1.41 mg/kg) and PreCuZ (2.27 mg/kg). Figure 2 shows the linear curve for Pb. The linear equations for PbB (y = 0.091x + 1.617), PbM (y = 0.294x + 0.959) and PbZ (y = 1.040x + 0.060) also revealed the mobility factors for Pb and the respective dumpsites. The average mobility factor for Pb is 0.48. Figure 3 shows the linear curve for Mn and the respective mobility factors at the dumpsites, MnB (51.03), MnM (49.14) and MnZ (11.90). The average mobility factor for Mn is 37.36.Figure 4 shows the linear curve for Zn and revealed the mobility factors ZnB (0.02), ZnM (0.19) and ZnZ (0.38). The average mobility factor for Zn is 0.19.
|
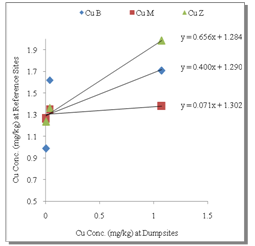 | Figure 1. Linear Curve for Cu |
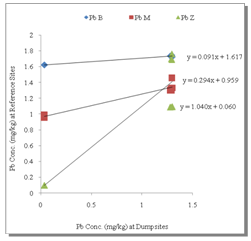 | Figure 2. Linear Curve for Pb |
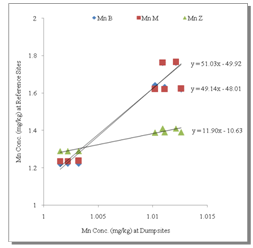 | Figure 3. Linear Curve for Mn |
 | Figure 4. Linear Curve for Zn |
|
4. Discussion
- According to McLean and Bledsoe[23], all soils naturally contain trace levels of metals and as result, the occurrence of metals in soil is not pinpointing contamination. However, the concentration of metals in uncontaminated soil is for the most part associated with the geology of the parent substance from which the soil was formed. Hence the justification in this study for the application of the native concentrations within the vicinity of contamination as reference soil in the regression model. The applicability of linear regressions models, which depends mainly on the equation for estimation, prediction and hypothesis testing has been proven efficient and has received attention in the fields of environmental sciences[24,25]. In this study, it was also found suitable for the estimation of mobility factors of heavy metals in contaminated soils.Higher concentrations of heavy metals observed as the depth increases depth-wise may be due the downward migration and accumulations of leachates[1,3]. The fate of metals in soil has been described by Shuman[2] to be found in any of the several "pools" of the soil: Dissolved in the soil solution; Occupying exchange sites on inorganic soil constituents; Specifically adsorbed on inorganic soil constituents; Associated with insoluble soil organic matter; Precipitated as pure or mixed solids; Present in the structure of secondary minerals; and/or Present in the structure of primary minerals. Therefore anthropogenic sources of metals in soil are related to these pools. However, the varying concentrations of all metals studied in this work are within the common range[23]. Environmental conditions in soil, which include changes over time, resulting from the degradation of the organic waste matrix, changes in pH, redox potential, or soil solution composition, natural weathering processes, are responsible for metal mobility. The extent of vertical contamination is intimately related to the soil solution and surface chemistry of the soil matrix with reference to the metal and waste matrix in question[1,23]. Hence concentration alone is not the only determining variable influencing the mobility factor of metals in soil.The mobility factors of heavy metals obtained in this study show concordance with that elucidated in Osakwe[15]. The study was undertaken at an automobile environment and presented mobility factors for the heavy metals studied in the following order: Co>Ni>Mn>Fe. Similarly Iwegbue[14] presented the order: Cd > Zn > Pb > Cu > Cr > Ni. In this study, an average order, Mn > Pb > Cu > Zn was established.Therefore, as mentioned earlier, several factors influencing the mobility of heavy metals in soil and hence the value of the mobility factor as well as the order of particular metal in relation to another is not specific or constant. However, the value of the mobility factor becomes useful in elucidating the risk heavy metals to contaminations.Consequently, it is suggested that while the results from studies of the mobility factors of heavy metals in soils are mainly useful to the particular environment under evaluations, this study also encourages the application of native concentrations where available for the estimation.
5. Conclusions
- 1. Metals concentrations generally increased across depth profile and were within common range for soils 2. Mobility factors of metals were estimated using the slope value in the linear regression equation and were comparable to results obtained by other researchers.3. The mobility factor of Mn recorded, generally indicated that Mn portends more risk in this environment.4. The study also showed that the linear equation can be utilized for predicting metal concentrations at a contaminated site from a reference value.
ACKNOWLEDGEMENTS
- The authors are indebted to the staff of the Advanced Research Laboratory of the Department of Geology, University of Maiduguri, for their assistance in the analysis of the soil samples.