Adams Udoji Itodo 1, Abdullahi Usman 2, Saliha Bashir Sulaiman 1, Happiness Ugbede Itodo 3
1Department of Applied Chemistry, Kebbi State University of Science and Technology, Aliero, Nigeria
2Basic Science Unit, Nasarawa State University Keffi, Shabu-Lafia Campus, Keffi, Nigeria
3Department of Chemistry, Benue State University Makurdi
Correspondence to: Adams Udoji Itodo , Department of Applied Chemistry, Kebbi State University of Science and Technology, Aliero, Nigeria.
| Email: |  |
Copyright © 2012 Scientific & Academic Publishing. All Rights Reserved.
Abstract
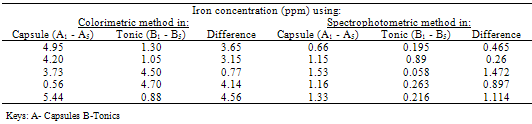
Additional consideration is that most research to datehas focused on the effects of anemiabut few works has been done to investigate whether iron supplement foods and drugs has the accurate specification as claimed by manufacturers. In this instrumental analytical study, two methods (viz: Colorimetry and Spectrophotometry) were utilized to investigate the level of Fe contents in branded capsules and their respective tonics marketed in pharmaceutical stores within Aliero metropolis, Nigeria. The comparative test analysis of iron content in five branded Tonics and their Capsules using two different methods revealed that none of the capsules have the same amount of label iron contents with their corresponding tonic equivalents. Capsule A1, A2, A3, A4 and A5 showed a difference of 0.465mg/L, 0.26mg/L, 1.472mg/L, 0.897mg/L and 1.114mg/L, with their respective Tonics using Spectrophotometric method, while in Colorimetric method, capsule A1, A2, A3, A4 and A5 showed a difference of 3.65mg/L, 3.15mg/L, 0.77mg/L, 4.14mg/L and 4.64mg/L with their corresponding Tonics. The correlation coefficient value (R2) was high and positive for both Spectrophotometric and colorimetric standards. The values were 0.998 and 0.964 respectively. On the same fashion, the sensitivity of Analytical methods was observed by difference to favour Spectrophotometric than it does for the colorimetric method.
Keywords:
Iron, Capsules, Tonics, Spectrophotometric, Colorimetric, iron supplementation
Cite this paper:
Adams Udoji Itodo , Abdullahi Usman , Saliha Bashir Sulaiman , Happiness Ugbede Itodo , "Color Matching Estimation ofIron Concentrationsin Branded Iron Supplements Marketed in Nigeria", Advances in Analytical Chemistry, Vol. 2 No. 1, 2012, pp. 16-23. doi: 10.5923/j.aac.20120201.04.
1. Introduction
Iron is required for a number of vital functions which include: oxidative metabolism, reproduction, cellular growth, wound healing, execution of various metabolic processes. The main role of Iron is to carry oxygen to the tissue where it is needed. It is also essential for the proper functioning of numerous enzymes involve in DNA synthesis, energy metabolism, and protection against microbes and free radicals, because free radical produced in the body can promote the development of heart diseases and can damage cholesterol in the blood[1]Iron supplementation remains an important strategy for the prevention and treatment of iron deficiencyanaemia and can produce substantial improvements in the functional performance of iron deficient individualsand populations. Many potential benefits of iron supplementationrequire further exploration, including its specification in claimed labelling. Supplementation with iron tablets is the most widely usedapproach to controlling the global problem of iron deficiency/anaemia. Much has been learned from our experiences withiron supplementation, but many scientific and logistical issuesremain to be resolved.There are two forms of dietary iron: heme and non-heme. The heme is derived from haemoglobin, heme iron is found originally in animal food that originally contains haemoglobin such as fish and poultry. Iron in plant foods such as lentils and beans is arranged in a chemical structure called non-hemeiron[2]. This is the form of iron added to iron-enriched and iron-fortified foods. Heme iron is absorbed better than non-heme iron, but most dietary iron is non-heme iron[3]. 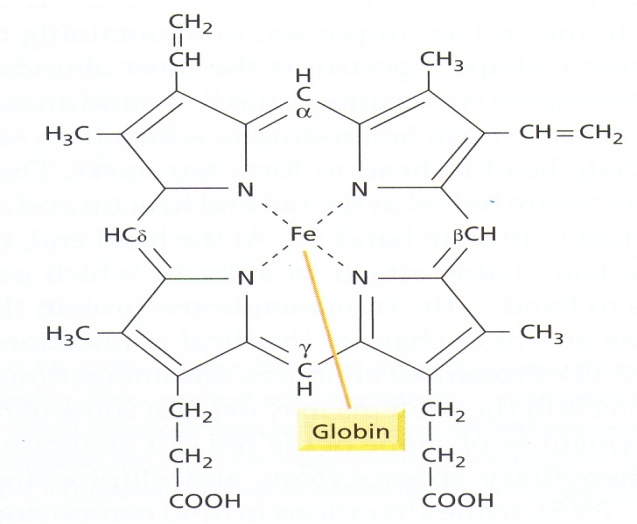 | Figure 1.1. Structure of Hemoglobin |
Iron deficiency anaemia, a reduction in the haemoglobin concentration of oxygen-carrying capacity of blood. Anaemia is characterized by loss of appetite, abdominal pains, tiredness, shortness of breath and headaches. Iron deficiency may result from lack of iron in the diet, inadequate absorption from the gut, or losses, usually through bleeding. For example: Iron deficiency anaemia affects 10-15 percent of women of menstruating age because the iron they lose in menstrual blood exceeds the iron obtained from food. Therefore, women with high menstrual losses may need higher iron intakes. Too much iron is toxic. An excess can damage the heart, liver, and pancreas, and irritate the gut causing constipation or diarrhoea[4].Colour Matching: Several methods for Fe analysis include: Spectrophotometric method such as kinetic spectroscopy, atomic absorption spectroscopy, flame atomic absorption spectroscopy, UV/ visible spectroscopy, optical emission spectrometry, Infrared (IR) spectroscopy, inductively coupled plasma emission spectrometry (ICP-AES), Colorimetric methods such as visual and photoelectric colorimetry and High performance liquid chromatography (HPLC).The most adopted colour matching methods are the spectrophotometric and colorimetric methods. These methods are based on the change in intensity of the color of a solution with variations in concentration, it represents the simple form of absorption analysis, it is cheap, quick and there is an increase in sensitivity and accuracy when used to measure the color intensity of a sample compare to other methods[5-11]Ferric and ferrous compounds contains iron in both +3 and +2 oxidation states. The ferric and ferrous refers to iron- containing compounds. In chemistry, the term ferric is reserved for iron with oxidation state of +3, also denoted iron (III) or Fe3+ on the other hand, ferrous refers to iron with oxidation state of +2 denoted iron (II) of Fe2+ The oxidation state of iron (II) is obtained when iron metal is dissolved in non oxidizing acids such as hydrochloric or dilute sulfuric acid. Insoluble ferrous hydroxide, Fe(OH)2 is a white gelatinous solid which turns green turn reddish- brown as it is oxidized to the ferric state on exposure to air. Solutions of ferrous salts have a pale green color and are also oxidized by air to ferric salts[12]Iron (III) is usually the most stable form of iron in air. In water ferric iron forms compounds that are often insoluble. A salt of ferric ion hydrolyses and produces iron (III) oxide-hydroxides while contributing hydrogen ions to the solution, lowering the pH[13]. Most iron containing proteins contain ferric ions at least transiently such as ferritin, oxyhaemoglobin, cytochromes and iron-sulfur clusters. Iron (III) is obtained when iron is dissolved in oxidizing acids or when ferrous solutions are oxidized. Although ferrous hydroxide is a fairly strong base, ferric hydroxide is much weaker. The hydrated ion acts as an acid. | (1) |
The oxide Fe2O known under many descriptive names is used as paint pigment, polishing compound and rouge. Ferric iron is detected by blood-red reaction product with thiocyanate ion which forms ferric thiocyanate [14]. | (2) |
(a) COLORIMETRY (Thiocyanate method)Thiocyanate (also known as rhodanide) is the anion (SCN-) and is the conjugate base of thiocyanic acid. Thiocyanate is analogous to the cyanate ions (OCN-), where in oxygen is replaced with sulfur. (SCN-) is one of the pseudo halides, due to the similarity of its reaction to that of halide ions. Thiocyanate used to be known as rhodanide (from a Greek word for rose) because of the red color of its complexes with iron. Thiocyanate is produced by the reaction of elemental sulfur or thiosulfate with cyanide. | (3) |
 | (4) |
The second reaction is catalyzed by the enzyme known as rhodanase and may be relevant to detoxification of cyanide in the body.Stated below is theresonance structures of the thiocyanate ions.Thiocyanate shares its negative charge approximately equally between sulfur and nitrogen. As a consequence, thiocyanate can act as a nucleophile at either sulfur or nitrogen it is ambidentate. In the test for iron (III), if SCN is added to a solution containing iron (III) ions (Fe3+),a blood red solution is formed due to the formation of (FeSCN)2- which indicates the presence of Fe3+. | (5) |
Iron (Fe) is in +2 oxidation state in the above equation.The change in the intensity of the color varies with concentration, and the more the intensity of color, the more the absorption[14]Basically, A colorimeter is used in the quantification of solute in a solution, It operates at visible light region and is only used to determine colored species or solutions. In colorimetry, the more the analyte present, the more the intensity of the color and; the more the absorption. Hence, the absorption is directly proportional to the concentration of the analyte [15]. | Figure 1.2. Schematic diagram of a colorimeter[15] |
The amount of light absorbed by a solution is governed by factors of path length through which the light travels and the concentration of the solution as expressed in the Beer-Lambert law[15].(b) SPECTROPHOTOMETRY (1, 10 – Phenanthroline method)The reaction between ferrous ion and 1, 10-phenanthroline serves as a sensitive method for iron determination. Two equations are involved in this process:1). The conversion of ferric ion to ferrous ion by the use of excess hydroxylamine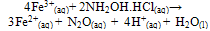 | (6) |
2). Thecomplexing of ferrous iron with o-phenanthroline | (7) |
 | Figure 1.3. Schematic diagram of a UV-visible spectrophotometer |
Fe is in +2 oxidation state in the above equations[16].In Spectrophotometry, the intensity of the light that passes through the sample under study depends on the amount of light absorbed by the sample. UV-visible spectrophotometer can operate both as a colorimeter and spectrophotometer i.e. operates at both UV (unable to view with the eyes) and visible and most importantly operates with both colored and colorless solution [17].JUSTIFICATION: Iron is an absolute requirement for most forms of life and is one of the many minerals required by human, especially lactating and menstrous women. The production and sale of unwholesome iron capsules or drugs is quite at an alarming rate. The need to quantitatively estimate Fe content, as well as comparison with legislatively acceptable standards portrayed in manufacturers label calls for this present research. This research is aimed at estimating the iron contents in multivitamins from pharmaceutical stores within Aliero metropolis. The objectives are stated thus,i. To estimate iron in reduced oxidation states using 1, 10 Phenanthroline method.ii. To qualitatively compare the concentration of iron using both colorimetric and Spectrophotometric methods.iii. To qualitatively compare the concentration of iron for the capsules with those of their corresponding tonics
2. Materials and Methods
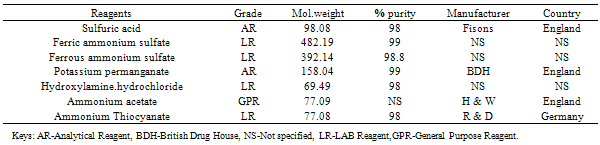
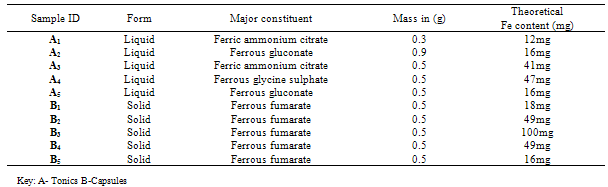
The materials used in carrying out this research work include the reagents, instruments and apparatus presented below.Beside the use of routine laboratory apparatus and equipment, the following also finds application in this research.Ten brands of Multivitamin drugs (five capsules and five tonics) were procured from pharmaceutical stores within Aliero metropolis of Kebbi State. They were stored at room temperature 25±2℃ and as prescribed on their instruction leaflets. Samples were used as received except for the color matching.Besides the non-displayed of the existing legislative registration numbers on grounds of confidentiality, other specifications were provided in Table 2.3 belowTable 2.1. List of Reagents
 |
| |
|
| Table 2.2. Lists of Apparatus |
| | Equipment | Model | Manufacturer | Country | | Electronic balance | JT201N | Sartorius | England | | Uv-visible spectrophotometer | SM752S | Surgispec | England | | Colorimeter | | Bausch and Lomb | Germany | | Conductivity meter | DDS-307 | B-Bran scientific | England | | pH meter | LOWA52001 | Barnstead international | USA |
|
|
Table 2.3. Sampling Data
 |
| |
|
Steps for the Preparation of Fe3+ standard solution.An accurate 3.0g of Ferric ammonium sulfate was weighed into a mortar and a pestle was used to grind the salt to a fine powder.1. An accurate 2.41g of the powder was weighed into a 100mL beaker and 20mL of concentrated sulfuric acid was added. The powder was left to soak in acid overnight.2. The acid/powder slurry was poured into a 500mL volumetric flask, and made up to the mark with distilled water.3. The solution of ferric ammonium sulfate was left for several days to dissolve.4. A standard solution of ferric ammonium sulfate was prepared by pipetting 10mL of the Fe3+ solution into a 500mL volumetric flask, 10mL of sulphuric acid was also added and made up to the mark with distilled water.5. The procedure was repeated in separate 500mL volumetric flasks, pipetting in 20, 30, 40 and 50mL of Fe3+ standard solutions in turn.Preparation of 1mol/L Ammonium Thiocyanate solution: A precise 38g of solid ammonium thiocyanate was weighed into a 500mL volumetric flask and made up to the mark with distilled water.Preparation of 1mol/L Sulphuric acid: A measured 55.4mL of Sulfuric acid was added into a 500ml volumetric flask containing about 250ml of distilled water and then transferred into 1 liter volumetric flask and made up to the mark with distilled waterPreparation of 0.15 mol/L Potassium permanganate solution: Potassium permanganate of 2.4g was weighed into a 100mL volumetric flask and made up to the mark with distilled water.Steps for the Preparation of the iron Capsules / multivitamins sample solution for analysis1. The content of the iron capsule was weighed accurately and placed in a beaker and a measuring cylinder was used to add 20mL of 1mol/L sulfuric acid. The content of the capsule was allowed to dissolve.2. Potassium permanganate of 0.15mol/L solution was added drop wise to the dissolved iron capsule, swirling the beaker after each addition, for the first addition of permanganate, the purple color disappeared immediately upon adding to the iron solution, as further drops were added the color lingered a little longer, addition of KMNO4 was stopped when the purple color persisted for several seconds after the addition (not more than 2mL was added).3. The iron solution was transferred to a 250mL volumetric flask and made up to the mark with distilled water.4. Using a pipette, 5mL of the iron solution was transferred to a 100mL volumetric flask and made up to the mark. The diluted solution was used for colorimetric analysis.Test Run (Colorimetric analysis)1. An accurate 10mL of the sample solution was measured into a clean, dry 25ml beaker. 10mL of each Fe3+ standard solution was measured into separate boiling tubes in order of increasing concentration.2. Precisely 1mL of 1mol/L ammonium thiocyanate solution was added to each iron solution in sequence with 2 minutes between each addition using a 10mL measuring cylinder. 3. A stable red color appeared over few minutes after mixing the solutions by swirling.4. The absorbance at wavelength of 490nm for each colored solution was measured using a colorimeter after 15 minutes of adding Thiocyanate.Determination of Iron by 1, 10 PhenanthrolineSteps for the Preparation of Fe2+ standard solutions1. An accurate 0.07g of ferrous ammonium sulfate(Fe(NH4)2(SO4)2.6H2O) was weighed and dissolved in water, the solution was transferred into a 1litre volumetric flasks and 2.5mL of concentrated sulphuric acid was added and diluted to the mark.2. The sample to be analyzed was weighed (iron capsules or tonics) and transferred into a 100mL volumetric flask and 2.5mL of sulphuric acid was added into a volumetric flask and diluted to the mark.1mL aliquot of this solution was transferred to another 100mL volumetric flask and was referred to as “prepared unknown”.3. Standard iron solutions of 1, 5, 10, 25 and 50mL were pipette volumetrically into five 100mL volumetric flasks. 50mL of distilled water was pipette into another flask to serve as the blank. To each flask, including the “prepared unknown”. 1mL of hydroxylamine solution, 2mL of 1, 10 phenanthroline solution and 1mL of the ammonium acetate solution was added. All the solutions were diluted to the 100mL mark and allowed to stand for 10minutes with occasionally swirling the flask. 4. The blank and one of the iron solution prepared above was used as a reference. The absorbance was measured at different wavelength in the interval of 400-600nm, and the readings were taken 20nm apart. A curve of absorbance and wavelength was plotted.5. The absorbance of each standard solution and unknown were measured at the selected wavelength (500nm) the curve of absorbance vs. concentration was plotted.Preparation of 0.001M of 1, 10 phenanthroline solution: An accurate 0.1g of 1, 10 phenanthroline was weighed into a 100mL volumetric flask and made up to the mark with distilled water.Preparation of 0.1M of ammonium acetate solution :A precise 10g of solid ammonium acetate was weighed into a 100mL volumetric flask and made up to the mark with distilled water.Preparation of 0.1M of hydroxylamine hydrochloride solution: An accurate 10g of hydroxylamine hydrochloride was weighed into a 100mL volumetric flask and made up to the mark with distilled water.
3. Results and Discussion
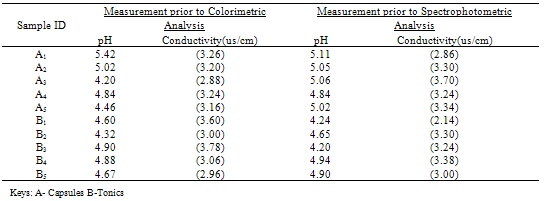
Table 3.1. pH and Conductivity measurement of sample solutions
 |
| |
|
| Table 3.2. Experimental data for Standard Curve for both Thiocyanate (Colorimetry) and O-Phenanthroline (Spectrophotometry) at wavelength of 490nm and 500nm respectively |
| | Colorimetric Method | Spectrophotometric Method | | Concentration (ppm) | Absorbance | Concentration (ppm) | Absorbance | | 2.79 | 0.13 | 0.103 | 0.040 | | 5.58 | 0.24 | 0.515 | 0.12 | | 8.37 | 0.40 | 1.03 | 0.25 | | 11.16 | 0.53 | 2.06 | 0.49 | | 13.95 | 0.56 | 2.60 | 0.64 |
|
|
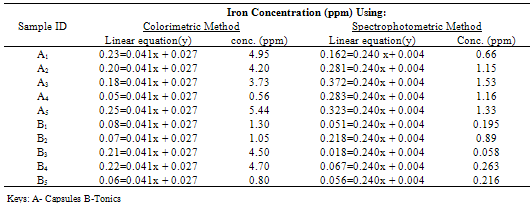
Table 3.3. Concentration reading of iron contents using Colorimetric and Spectrophotometric method
 |
| |
|
Table 3.4. Comparison between iron Capsules and their corresponding Tonics
 |
| |
|
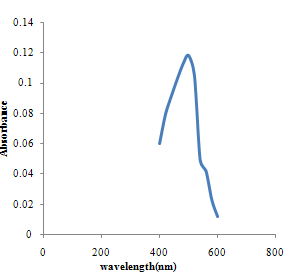 | Figure 3.1. Absorbance versus vavelength for spectroscopic method |
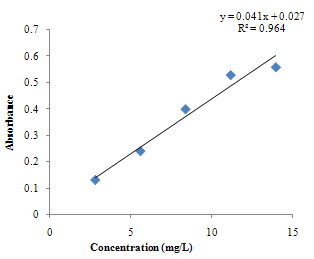 | Figure 3.2. Calibration curve for Fe standards using Thiocyanate method |
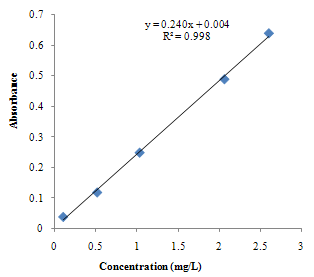 | Figure 3.3. Calibration curve for Fe standards using 1,10 Phenanthroline method |
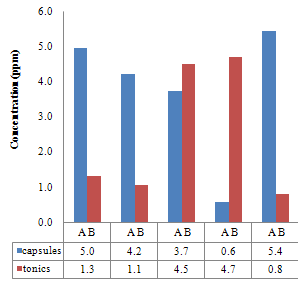 | Figure 3.4. Comparison between the iron Concentration (ppm) of the Capsules and their corresponding Tonics using Thiocyanate method |
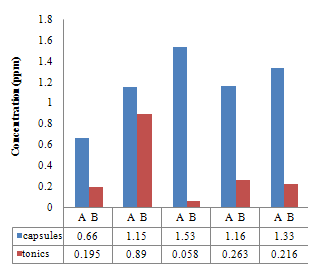 | Figure 3.5. Comparison between the iron Concentration (ppm) of the Capsules and their corresponding Tonics using O-Phenanthroline method |
3.1. Discussion
Effect of Ph on Colour Intensity Table 3.1 gave the pH level and conductivity measurements of the samples prior to analysis. The pH measuresbetween 4-6 which tells that the samples are in acidic medium. The measure of conductivity is an indicator of the presence of charged species. High color intensity is an indication of high absorbance, pH and conductivity. Table 3.1 clearly showed that Capsule A1 in colorimetric method has a higher pH value of 5.42 and hence a high conductivity value of 3.26 compared to sample A1 in Spectrophotometric method with an absorbance reading of 5.11 and a conductivity reading of 2.86. Capsule A2has a lesser pH and conductivity reading (5.02 and 3.20 respectively) in colorimetric method compare to Capsule A2 in Spectrophotometric method with a pH reading of 5.05 and conductivity reading of 3.30 and so on.it was reported that the intensity ofthecoloris independent of pH in the range 2 to 9. The complex is very stable and the colorintensity does not change appreciably over long periods of time. Beer's law is obeyed. The iron must be in the ferrous state, and hence a reducing agent is added before the color isdeveloped. Hydroxylamine, as its hydrochloride, can be used to reduce any ferric ion as shown below; | (8) |
The pH is adjusted to a value between 6 and 9 by addition of ammonia or sodium acetate.Absorbance Reading and Calibration CurveThe absorbance readings at different wavelength was recorded between 400-600nm with 20nm intervals and it also showed that the highest absorbance reading was at 500nm. Fig 3.1 shows the curve of absorbance and wavelength which was plotted from these readings for Spectrophotometric analyses. The maximum wavelength which was found to be 500nm was taken as the wavelength at maximum absorbance (ʎmax) used to carry out the analysis.The absorbance readings obtained from iron standards in both colorimetric and Spectrophotometric analysis obeys the principle of light absorption which states that the absorption increases with increase in the concentration of a solution[15].Table 3.3presents the concentrations of the branded iron capsules and tonics estimated from the calibration curve of iron standards in both Colorimetric and Spectrophotometric methods (Fig 3.2 and 3.3) using their absorbance readings and a standard linear equation.Capsules Versus Tonics Iron ConcentrationThe results obtained from the analysis of various branded tonics and their respective capsules in Spectrophotometric method as shown in Table 3.3 above clearly showed that none of the branded capsules has the same concentration with their respective tonics. Capsule A1-A5 has higher concentrations of 0.66mg/L, 1.15mg/L, 1.53mg/L, 1.16mg/L and 1.33mg/L respectively than their respective tonics B1-B5 with 0.195mg/L, 0.89mg/L, 0.058mg/L, 0.263mg/L and 0.216mg/L, while in Colorimetric method there is a slight contrast in the result. Capsule A1, A2& A5 with concentration readings of 4.95mg/L, 4.20mg/L and 5.44mg/L has higher concentration than their corresponding tonics of B1, B2 and B5 with readings of 1.30mg/L, 1.05mg/L and 0.80mg/L. Capsule A3 and A4 has less concentration with values of 3.73mg/L and 0.56mg/L than their corresponding Tonics of B2 and B3 with values of 4.50mg/L and 4.70mgL respectively.There is a wide difference between the capsules and their tonics in both colorimetric and Spectrophotometric method as displayed in Table 3.4 above. For Capsule A1, A3, A4 and A5 there is a difference of 0.456mg/L, 1.472mg/L, 0.897mg/L and 1.114mg/L with their corresponding Tonics in Spectrophotometric analysis. Capsule A1, A2, A4 and A5 having a difference of 3.65mg/L, 3.15mg/L, 4.14mg/L and 4.56mg/L with their respective tonics in Colorimetric analysis. Capsule A2 and A3 in both methods showed a slight difference of 0.26mg/L and 0.77mg/L respectively. This result explained that though, the analysis of the tonics and their respective capsules were carried out using the same weight, the difference in the iron content is enormous.The high difference between the theoretical iron content and experimented iron content could be linked to the fact that the theoretical iron content is the total iron and not of specification with reference to a particular oxidation state. The high positive correlation coefficient values (R2) measures the applicability of the two adpted instrumental techniques. R2 values in this research indicated that both colorimetric and spectrophotometric methods finds application in iron content estimation. This is reported as Fig 3.1 and 3.2 indicating high positive correlation .However, Fig 3.3 with R2=0.998 for spectrophotometergave a higher level of fitness than that of a colorimeter (Fig 3.2) with R2=0.964. This could be linked to the fact that the spectrophotometer is capable of adsorbing through the UV region and not necessarily for colored solutions owing to its high sensitivity and design.Sensitivity of Analytical TechniquesVery needfulis a comparison betweenthe efficacy of both Colorimetric and Spectrophotometric analysis utilized in this research. Table 3.3 revealed that while the Spectrophotometric method clearly showed that the capsules has higher iron content than the tonics. As such,capsule A1, A2, A3, A4 and A5presented Fe concentrations of 0.66mg/L, 1.15mg/L, 1.53mg/L, I.16mg/L and 1.33mg/L with their correspondingtonics iron contents estimated as 0.195mg/L, 0.89mg/L, 0.058mg/L, 0.263mg/L and 0.216mg/L respectively. The Colorimetric method showed slightly different result indicating that just three of the capsules (A1, A2 and A5) gave 4.95mg/L, 4.20mg/L and 5.44mg/L concentration values which are more than their tonics 1.30mg/L, 1.05mg/L and 0.88mg/L while the remaining two have lesser content (3.73mg/L and 0.56mg/L) compared to their tonics (4.50mg/L and 4.70mg/L). This further shows that the use of spectrophotometric method in iron analysis could be more advantageousthan Colorimetric method.
4. Conclusions
From the highlight of this research;i. The pH and conductivity measurement clearly showed that the higher the pH, the more intense the color (high absorbance reading).ii. The correlation coefficient was high and positive for both methods showing their good applicability for iron estimation.iii. Spectrophotometric method was found to be more sensitive and also gave more precise and replicate results than the colorimetric method.The high difference between the theoretical and the experimented Fe content could be linked to the fact that the theoretical iron content was presented as total iron and not of specific oxidation states. It should be noteworthy that Total Iron is determined by oxidizing any Iron(II) Iron(III)with Persulfate. A Thiocyanate complex of the Iron(III) isformed in a dilute acid solution. A direct measurement of theIron-Thiocyanate is made using a calibratedspectrophotometer at 474 nm. They are related as the equation below  | (9) |
iv. Finally, the results on this comparative test analysis of the estimated branded tonics and capsules revealed that none of the five tonics Fe contents conforms to their corresponding capsule values, and that none of the capsule and tonics corresponds with the product specification as claimed by manufacturers.
References
| [1] | Salonen J.T., Nyyssonen K., Korpela H., Tuomilehto J.S.R (1992). High stored iron levels are associated with excess risk of myocardial infaction in eastern finnish men. Circulation86:803-11. |
| [2] | Hurell R.F. (1997). Preventing iron deficiency through food fortification Nutri.Rev55:210-22 |
| [3] | Miret S., Simpson R.J. and Mickie A.T. (2003). Physiology and molecular biology of dietary iron absorption. Annu.RevNutri23:283-301 |
| [4] | Heather L.F., (2000) The effect of iron. Research pennstate retrieved on 21/2/2010 from http:www.encyclopedia.org/ entry/iron |
| [5] | Krejcova A., David K., Tomas C., and Milan P. (2006) Determination of macro and trace element in multivitamins preparations by inductively coupled plasma optical emission spectrometry with slurry sample production. Food Chemistry 98:171-178 |
| [6] | Alula M.T., Abdel M. I. and Adhan A. B. (2010). Simultaneous spectrophotometric determination of iron (II) and copper in tablets by chemometric methods. Thai J.Pharm.Sci. 34:93-106. |
| [7] | Balcerzak M., Anna T. and Elzbeita S.F. (2008). Selective determination of Fe(II) and Fe(III) samples by UV-spectrophotometry with the aid of quercetin and morin. Acta Pharm58:372-334. |
| [8] | Chamjangali M.A., Ghadamali B. and Neda S.G. (2009), New induction period based kinetic spectrophotometric method for the determination of iron (II) in pharmaceutical products. ActaChim.Slov56:434-440. |
| [9] | Ali Niazi. (2006). Simultaneous spectrophotometric determination of Fe (II) and Fe (III) in pharmaceuticals by partial least squares with chromagenic mixed reagents. Croactica Chemical and Acta79(4):573-579. |
| [10] | Zahra R., Rahbar N. and Ghanaatian A. (2008). Comparison of flame atomic absorption spectrometry (FAAS) and Cerimetric methods for the determination of ferrous sulfate content of some pharmaceutical products. Pak.J.Pharm. Sci 21(4): 396-399. |
| [11] | Senyuva H.Z., Deniz Y.S. and Tuncel O. (2002). Simultaneous determination of Fe(II) and Fe(III) in pharmaceutical samples by post column derivatization/HPLC. Turk J Chem26:425-430 |
| [12] | David B.V. (1994). Environmental impact of a universal element, National Environmental Journal 5(3):24-25 |
| [13] | Earnshaw A. and Greenwood N.N. (1997). Chemistry of the elements (2nd edition). Oxford :Butterworth-Heinemann ISBN 0-7506-3365-4 |
| [14] | Pedemonte N., Caci E., Sondo E., Caputo A., Rhoden K., Pfeffer U., Di Candia M., Bandetinni R., Ravazzdo R., Zegarra M.O and Galietta L.J. (2007). Thiocyanate transport in resting and IL-4-Stimulated human bronchial epithelial cells: role of pendrin and anion channels. J .Immunol. 178(8): 5144-53 |
| [15] | Rodney B. (2006). Biochemistry laboratory: modern theory and technique, international edition, pearson education inc.(San francisco). |
| [16] | Sandell E.B. (1959). Colorimetric determination of trace metals, 3rd edition interscience publishers inc.Newyork |
| [17] | Hoffman E.D and Stroobant V. (2001) Mass spectrometry: principles and applications, 2nd edition. John wiley and Sons Newyork |
 Abstract
 Reference
 Full-Text PDF
 Full-Text HTML