-
Paper Information
- Previous Paper
- Paper Submission
-
Journal Information
- About This Journal
- Editorial Board
- Current Issue
- Archive
- Author Guidelines
- Contact Us
Advances in Analytical Chemistry
p-ISSN: 2163-2839 e-ISSN: 2163-2847
2012; 2(1): 10-15
doi:10.5923/j.aac.20120201.03
Thermal Analysis and Validation of UV and Visible Spectrophotometric Methods for the Determination of New Antibiotic Tigecycline in Pharmaceutical Product
 Abstract
 Reference
 Full-Text PDF
 Full-text HTML
Lucélia Magalhães da Silva, Adélia Emilia de Almeida, Hérida Regina Nunes Salgado
Department of Drugs and Medicines, School of Pharmaceutical Sciences of Araraquara- UNESP, Rodovia Araraquara-Jaú, km 1, CEP 14801-902, Araraquara, SP, Brazil
Correspondence to: Lucélia Magalhães da Silva, Department of Drugs and Medicines, School of Pharmaceutical Sciences of Araraquara- UNESP, Rodovia Araraquara-Jaú, km 1, CEP 14801-902, Araraquara, SP, Brazil.
| Email: |  |
Copyright © 2012 Scientific & Academic Publishing. All Rights Reserved.
This work has proposed the development and validation of ultraviolet (UV) and visible spectrophotometric methods for determination of tigecycline in lyophilized powder. In UV method tigecycline showed absorption maximum at 245 nm, in aqueous medium, where as in visible spectrophotometric method it reacts with copper acetate reagent, under acid conditions, forming a greenish coloured solution with absorption maximum at 378 nm. Thermogravimetric Analysis and Differencial Scanning Calorimetry (TGA-DSC) techniques were studied to determine the thermal analysis of tigecycline. The methods were completely validated according to the International Conference on Harmonization (ICH) guidelines, showing good accuracy, precision, selectivity, robustness and linearity. Therefore the methods were found to be simple, economic and free of polluting reagents, being suitable for the analysis of the lyophilized powder formulation, contributing to improve the quality control and to assure its therapeutic efficacy.
Keywords: Tigecycline, Spectrophotometric Methods, Thermal Analysis
Cite this paper: Lucélia Magalhães da Silva, Adélia Emilia de Almeida, Hérida Regina Nunes Salgado, Thermal Analysis and Validation of UV and Visible Spectrophotometric Methods for the Determination of New Antibiotic Tigecycline in Pharmaceutical Product, Advances in Analytical Chemistry, Vol. 2 No. 1, 2012, pp. 10-15. doi: 10.5923/j.aac.20120201.03.
Article Outline
1. Introduction
- Tigecycline exhibits robust activity against bacterial isolates resistant to other antibiotic classes, including beta- lactams and fluoroquinolones, while resisting deactivation by most of the known tetracycline resistance mechanisms found in clinically significant bacteria[1]. This antibiotic has been evaluated as monotherapy for serious infections in human clinical trials as a result of its microbiological, pharmacodynamic and pharmacokinetic properties[2,3].Tigecycline is structurally derived from minocycline by adding a tert-butyl-glycylamido side chain to carbon 9 of the D ring of the tetracycline backbone[4]. The Figure 1 depicts the structural formulas of tigecycline[5]. Chemically, tigecycline is [(4S, 4aS, 5aR, 12aS) –9- (2 – tert- Butylami- noacetylamino)-4,7-bis-dimethylamino-3,10,12,12a-tetrahy droxy−1,11-dioxo−1,4,4a,5,5a,6,11,12a-octahydronaph-thacene-2-carboxamide]. Its chemical formula is C29H39N5O8, and its molecular weight is 585.65 Daltons[6,7].There are few methods described to analyze tigecycline and its metabolites in the literature. Four HPLC-UV assays for the determination of tigecycline in biological materials have been described in the literature [6, 8-11]. Besides HPLC-UV, HPLC/MS/MS methods have also been employed to determination of tigecycline in biological fluids and tissues, as serum, urine, bronchoscopy and bronchoalveolar lavage, alveolar cells, gall bladder, bile, colon, bone, synovial fluid, lung and rat bone[6,10,12-14].
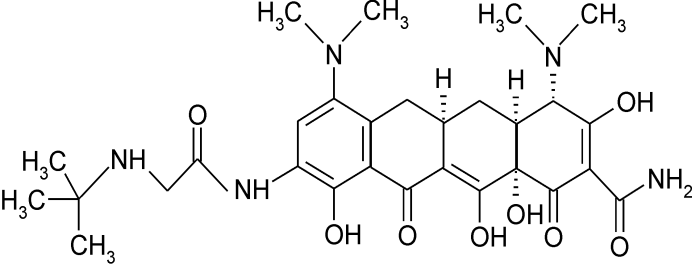 | Figure 1. Chemical structure of tigecycline |
2. Experimental
2.1. Chemical and Reagents
- The tigecycline reference substance was purchased from Sequoia Research Products (Oxford, UK). Batches of Tygacil® (Wyeth, USA) lyophilized powder, containing 50 mg of tigecycline were obtained from commercial sources within their shelf-life period. Copper acetate was purchased from Merck (Darmstadt, Germany) and sodium acetate from Synth (Diadema, Brazil). All chemicals used were of pharmaceutical or special analytical-grade. For all of the analyses, ultrapure water was purified using an Elix 3 coupled to a Milli-Q Gradient A10 system (Millipore, Massachusetts, USA).The placebo solution was prepared in the laboratory by addition of appropriate amount of pharmaceutical grade excipient monohydrate lactose in purified water. The acetate buffer pH 3.0 was prepared by dissolving 4.0 g of anhydrous sodium acetate in 800 mL of water. Sufficient amount of glacial acetic acid (about 130 mL) was added to adjust pH. The solution was transferred into a 1000 mL volumetric flask e diluted to 1000 mL with water. To prepare the copper acetate solution, 5.0 g of copper acetate were weighted and transferred into a 100 mL volumetric flask, 80 mL of water was added and the solution was placed in ultrasonic bath for 30 minutes, then the volume was completed with water.
2.2. Apparatus
- All absorbance measurements were performed on a UV-Vis Recording Spectrophotometer UV-mini 1240 (Shimadzu®, Kyoto, Japan), using 1.0 cm quartz cells. To adjust of buffer pH, in the visible method, a digital pHmeter B474 (Micronal®, São Paulo, Brazil) was used. TGA (thermogravimetric analysis) curves were obtained with a SDT-2960 (TA Instruments) thermal analyzer apparatus using flowing nitrogen 100 mL min−1, temperature range 25−1000℃, at a heating rate of 10℃ min−1. The DSC curves were obtained with a DSC-2910 (TA Instruments) equipment using flowing nitrogen 25 mL min−1. The tigecycline mass applied was 4.00 ± 0.4 mg to the two thermal analysis.
2.3. Preparation of Reference Substance Solution
2.3.1. UV Method
- The stock solution was daily prepared by weighing accurately, 5 mg of tigecycline reference substance, transferred to 100 mL volumetric flask and diluted to volume with water, obtaining a concentration of 50 µg mL−1 of tigecycline.
2.3.2. Visible Method
- The stock solution was daily prepared by weighing accurately, 5 mg of tigecycline reference substance, transferred to 25 mL volumetric flask and diluted to volume with water, obtaining a concentration of 200 µg mL−1 of tigecycline.
2.4. Preparation of Sample Solutions
2.4.1. UV Method
- To prepare the sample solution, vials containing 50 mg of tigecycline were accurately weighed and mixed. An appropriated amount was transferred into an individual 50 mL volumetric flask and diluted to volume with water. The final concentration of 50 µg mL−1 of the active pharmaceutical ingredient was daily prepared, diluted to an appropriate concentration with water, analyzed and the amount of the drug calculated against the reference substance.
2.4.2. Visible Method
- To prepare the sample solution, vials containing 50 mg of tigecycline were accurately weighed and mixed. An appropriated amount was daily transferred into an individual 25 mL volumetric flask and diluted to volume with water, obtaining final concentration of 200 µg mL−1 of the active pharmaceutical ingredient. Aliquots of this solution were transferred to volumetric flask to reaction with copper acetate, in acid pH, and diluted to an appropriate concentration with water, analyzed and the amount of the drug calculated against the reference substance.
2.5. Spectrophotometric Measurements
2.5.1. UV Method
- Aliquots of reference substance and sample solutions were transferred into a 10 mL volumetric flasks and the volume was brought to the volume with water and the absorbance was measured at 245 nm against a reagent blank prepared simultaneously.
2.5.2. Visible Method
- Aliquots of reference substance and sample solutions were transferred into a 10 mL volumetric flasks, followed by addition of 1 mL of acetate buffer, then 1 mL of 5 % (w/v) copper acetate solution and the volume was brought to the volume with water and the absorbance was measured at 378 nm against a reagent blank prepared simultaneously.
2.6. Validation of the RP-LC Method
- The methods were validated using samples of pharmaceutical formulations with the label claim of 50 mg by determinations of the following parameters: specificity, linearity, precision, accuracy, limit of detection (LOD), limit of quantitation (LOQ) and robustness, following the International Conference on Harmonization (ICH) guidelines[18].
2.6.1. Specificity
- Selectivity was evaluated by analysis of the placebo solutions and the tigecycline working standard solution at the concentration of 16 and 22 µg mL−1, to ultraviolet and visible methods, respectively. The placebo solution containing the excipient monohydrate lactose of the pharmaceutical formulation was prepared for this study. It was treated in the same manner as the commercial samples.
2.6.2. Linearity and Range
- The linearity was determined by constructing three independent analytical curves, each one with seven reference substance concentrations of tigecyline in triplicate, in the range of 10-22 and 10-34 μg mL−1, to ultraviolet and visible methods, respectively. The absorbance values were plotted against the respective concentrations of tigecycline to obtain the analytical curve. The results were subjected to regression analysis by a least-squares method to calculate calibration equation and determination coefficient.
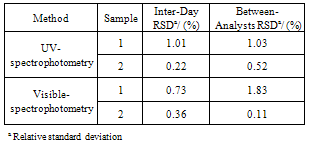
2.6.3. Precision and Accuracy
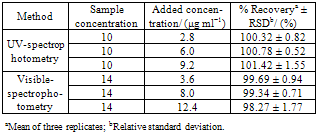
- The precision of the method was determined by the repeatability and the intermediate precision. Repeatability was examined by six evaluations of the same concentration sample of tigecycline, on the same day, and under the same experimental conditions. The intermediate precision of the method was assessed by carrying out the analysis on three different days (inter-days), and also by other analysts performing the analysis in the same laboratory (between- analysts). In the ultraviolet method, the accuracy was evaluated by applying the proposed method to the analysis of known amounts of the reference substance added to sample solution containing 10 μg mL−1 of tigecycline, to obtain solutions at concentrations of 12.8; 16 and 19.2 μg mL−1, equivalent to 80, 100 and 120% of the nominal analytical concentration, respectively. In the visible method, solutions at concentrations of 17.6; 22 and 26.4 μg mL−1 were obtained by addition of known amounts of the reference substance to sample solution containing 14 μg mL−1 of tigecycline. The accuracy of the methods was calculated as the percentage of the drug recovered from the sample.
2.6.4. Limits of Detection and Quantitation
- The limit of detection (LOD) and the limit of quantitation (LOQ) were calculated, as defined by ICH (2005)[18], using the mean values of three independent analytical curves, determined by a linear-regression model, where the factors 3.3 and 10 for the detection and quantitation limits, respectively, were multiplied by the ratio from the standard deviation of the intercept and the slope.
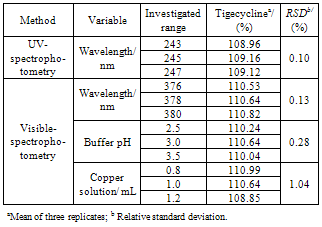
2.6.5. Robustness
- Three sample solutions were prepared and analyzed using the established conditions and by variation of the following analytical parameters: wavelength, volume of copper solution added (0.8−1.2 mL) and buffer pH (2.5-3.5). Tigecycline contents and R.S.D. were determined for each condition.
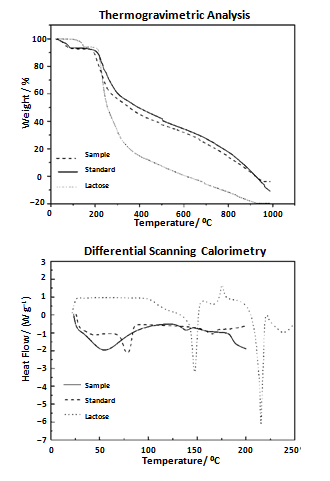 | Figure 2. Thermal analysis of tigecycline |
3. Results and Discussion
3.1. Thermal Analysis
- The thermal analysis of the tigecycline standard and pharmaceutical product and the excipient monohydrate lactose was studied by Thermogravimetric Analysis- Differential Scanning Calorimetry (TGA-DSC) techniques. The TGA-DSC curves of tigecycline and lactose are shown in Figure 2. The tigecycline was heated from 25℃ up to 1000℃. The TGA curves showed that the tigecycline standard was more thermally stable than the pharmaceutical product, since that the standard started its decomposition at 188.6℃ and the sample at 175.3℃. The loss of the water happened between 33 and 127℃ to sample and between 41 and 99℃ to standard. The decomposition of lactose was observed at 198.4℃ and the water loss happened between 89 and 161℃. In the DSC curve of tigecycline sample, a water loss was observed followed by decomposition, indicating its amorphous state, and a melting point peak was not observed. To standard, the DSC curve showed water loss and after a melting point endothermic peak at 78.3℃, followed by its decomposition. The DSC curve of lactose showed water loss and after a melting point endothermic peak at 147.2℃, followed by crystallization verified in the exothermic peak at 175.6℃. It was observed a melting point endothermic peak at 215.1℃ and enthalpy of 71.1 J g− 1. After, an additional endothermic peak at 236.4℃ was formed, related to thermal decomposition of the melted compound.
3.2. Ultraviolet Method
- The proposed UV method allows a rapid and economical quantitation of tigecycline in lyophilized powder without any time-consuming sample preparation. Moreover, the spectrophotometric methods involve simple instrumentation compared with other instrumental techniques. The absorption spectra of tigecycline in aqueous solution is shown in Figure 3. The λ max was found to be 245 nm. This wavelength was used for all measurements.
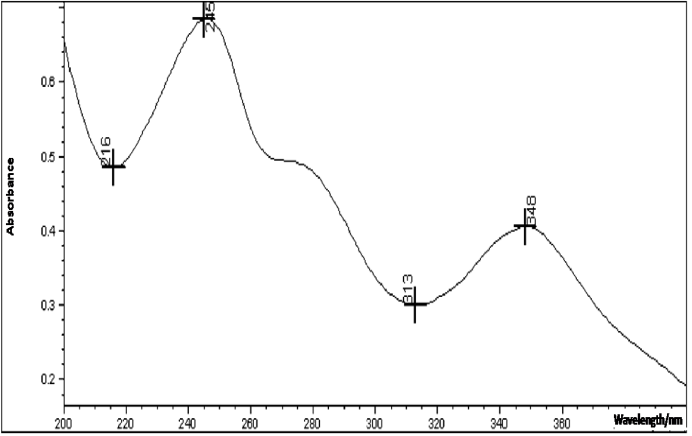 | Figure 3. Ultraviolet absorption spectra of tigecycline in aqueous solution |
|
|
3.3. Visible Method
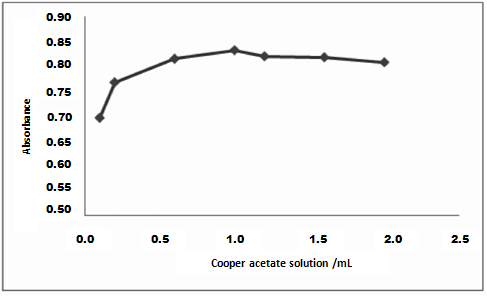
- In the determination of the method conditions different buffer pH and copper concentration were evaluated. Variable amounts of copper solution (0.1-2 mL) were studied with fixed pH and tigecycline concentration. The volume of 1 mL of copper solution showed major absorbance values (Figure 4).
 | Figure 4. Effect of copper solution volume on the absorbance of 34 µg mL−1 of tigecycline |
|
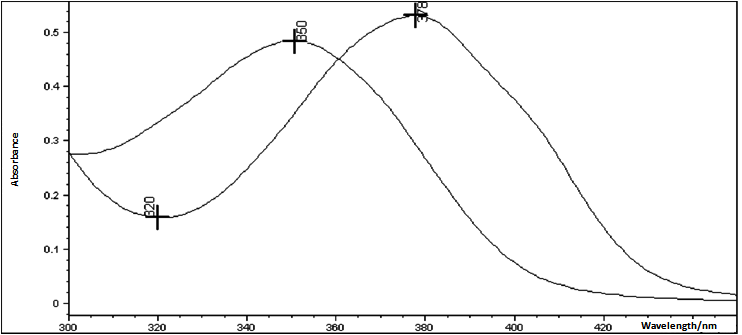 | Figure 5. Absorption spectrum of tigecycline in the presence (λmax = 378 nm) and absence (λmax = 350 nm) of copper solution at pH 3.0 |
|
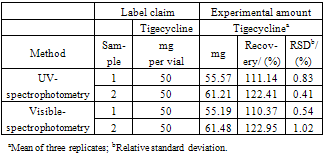
3.4. Methods Application
- The proposed spectrophotometric methods were applied for the determination of tigecycline in lyophilized powder, without prior separation of the excipient of the formulation, showing the applicability of the method for quality control analysis (Table 5). The results demonstrated elevated tigecycline content in the samples, however these results are not considerate irregulars since official reference standard and specifications for tigecycline in lyophilized powder are not established yet.
4. Conclusions
- In this work, analytical ultraviolet and visible spectrophotometric methods were developed for quantitative determination of tigecycline in lyophilized powder. Its advantages over other existing methods are its simplicity, fastness and low-cost conditions. Moreover, it does not use polluting reagents. All validation parameters were found to be highly satisfactory, indicating linearity, selectivity, precision, accuracy, robustness and adequate detection and quantification limits. The method, therefore, can be easily applied in routine quality control laboratories.
ACKNOWLEDGEMENTS
- The authors wish to thank FAPESP (Fundação de Amparo à Pesquisa do Estado de São Paulo, project 2009/53434-2), CNPq (Brasília, Brazil), and PADC-FCF, FUNDUNESP (São Paulo, Brazil) for the financial support.
References
| [1] | Bauer, G., Berens, C., Projan, S. J., Hillen, W., 2004, Comparison of tetracycline and tigecycline binding to ribosomes mapped by dimethylsulphate and drug-direct Fe2+ cleavage of 16S rRNA, J. Antimicrob. Chemother., 53, 592-599 |
| [2] | Chopra, I., 2001, Glycylcyclines: third-generation tetracycline antibiotics, Curr. Opin. Pharmacol., 1(5), 464-469 |
| [3] | Zhanel, G. G., Homenuik, K., Nichol, K., Noreddin, A., Vercaigne, L., Embil, J., Gin, A., Karlowsky, J. A., Hoban, D. J., 2004, The glycylcyclines: a comparative review with the tetracyclines, Drugs, 64(1), 63-88 |
| [4] | Pankey, G. A., 2005, Tigecycline, J. Antimicrob. Chemother., 56(3), 470-480 |
| [5] | Garrison, M. W., Neumiller, J. J., Setter, S. M., 2005, Tigecycline: an investigacional glycylcycline antimicrobial with activity against resistant Gram-positive organisms, Clin. Ther., 27(1), 12-22 |
| [6] | Hoffmann, M., Demaio, W., Jordan, R. A., Talaat, R., Harper, D., Speth, J., Scatina, J., 2007, Metabolism, excretion, and pharmacokinetics of [14C] tigecycline, a first-in-class glycylcycline antibiotic, after intravenous infusion to healthy male subjects, Drug. Metab. Dispos., 35(9), 1543-1553 |
| [7] | Doan, T., Fung, H. B., Mehta, D., Riska, P. F., 2006, Tigecycline: A glycylcycline antimicrobial agent, Clin. Ther., 28(8), 1079-1106 |
| [8] | Li, C., Sutherland, C. A., Nightingale, C. H., Nicolau, D. P., 2004, Quantitation of tigecycline, a novel glycylcycline, by liquid chromatography, J. Chromatogr. B, 811(2), 225-229 |
| [9] | Bradford, P. A., Petersen, P. J., Young, M., Jones, C. H., Tischler, M., O’Connell, J., 2005, Tigecycline MIC testing by broth dilution requires use of fresh medium or addition of the biocatalytic oxygen-reducing reagent oxyrase to standardize the test method, Antimicrob. Agents Chemother., 49(9), 3903-3909 |
| [10] | Muralidharan, G., Micalizzi, M., Speth, J., Raible, D., Troy, S., 2005, Pharmacokinetics of tigecycline after single and multiple doses in healthy subjects, Antimicrob. Agents Chemother., 49(1), 220-229 |
| [11] | Silva, L. M., and Salgado, H. R. N., 2010, Tigecycline: A Review of properties, applications, and analytical methods, Ther. Drug Monitor., 32(3), 282-288 |
| [12] | Conte Jr, J. E., Golden, J. A., Kelly, M. G., Zurlinden, E., 2005, Steady-state serum and intrapulmonary pharmacokinetics and pharmacodynamics of tigecycline, Int. J. Antimicrob. Agents, 25(6), 523-529 |
| [13] | Ji, A. J., Saunders, J. P., Wadgaonkar, N. D., Petersen, P. J., O’Leary, K., McWilliams, W. E., Amorusi, P., Leal, M., Fluhler, E. N., 2007, A novel antibiotic bone assay by liquid chromatography/tandem mass spectrometry for quantitation of tigecycline in rat bone, J. Pharm. Biomed. Anal., 44(4), 970-979 |
| [14] | Ji, A. J., Saunders, J. P., Amorusi, P., Wadgaonkar, N. D., O’Leary, K., Leal, M., Dukart, G., Marshall, B., Fluhler, E. N., 2008, A sensitive human bone assay for quantitation of tigecycline using LC/MS/MS, J. Pharm. Biomed. Anal., 48, 866-875 |
| [15] | Marona, H. R. N., and Schapoval, E. E. S., 2001, Spectrophotometric determination of sparfloxacin in pharmaceutical formulations using bromothymol blue, J. Pharm. Biomed. Anal., 26(3), 501-504 |
| [16] | Kumar, R. S., Manjunatha, D. H., Shaikh, S. M. T., Seetharamappa, J., Harikrishna, K., 2006, Sensitive extractive spectrophotometric methods for the determination of trazodone hydrochloride in pharmaceutical formulations, Chem. Pharm. Bull., 54(7), 968-971 |
| [17] | Amin, A. S., Ahmed, I. S., Dessouki, H. A., Mohamed, H. A., 2010, Spectrophotometric quantification of fluoxetin hydrochloride: application to quality control and quality assurance processes, Chem. Pap., 64(3), 278-284 |
| [18] | ICH Q2(R1). Validation of Analytical Procedures: Text and Methodology, International Conference on Harmonization of Technical Requirements for the Registration of Pharmaceutical for Human Use, Geneva, Switzerland, 2005 |
| [19] | Couto, C. M. C. M., Lima, J. L. F. C., Conceição, M., Montenegro, B. S. M., Reis, S., 1998, Tetracycline, oxytetracycline and chlortetracycline determination by flow injection potentiometry, J. Pharm. Biomed. Anal., 18, 527-533 |
| [20] | Jezowska-Bojczuk, M., Lambs, L., Kozlowski, H., Berthon, G., 1993, Metal ion-tetracycline interactions in biological fluids. 10. Structural investigations on copper (II) complexes of tetracycline, oxytetracycline, chlortetracycline, 4- (dedimethylamino) tetracycline, and 6-desoxy -6- demethyltetracycline and discussion of their binding modes, Inorg. Chem., 32(4), 428-437 |