-
Paper Information
- Previous Paper
- Paper Submission
-
Journal Information
- About This Journal
- Editorial Board
- Current Issue
- Archive
- Author Guidelines
- Contact Us
Advances in Analytical Chemistry
p-ISSN: 2163-2839 e-ISSN: 2163-2847
2011; 1(1): 8-11
doi: 10.5923/j.aac.20110101.02
Analytical Investigation of Pollutants in Coastal , Nigeria
 Abstract
 Reference
 Full-Text PDF
 Full-Text HTML
Eruola 1, A. O. 1, 2, Ufoegbune 1, G. C 1, Ojekunle 1, Z. O. 1, Makinde 1, A. A. 3, Ogunyemi 1, I. O 2
1University of Agriculture, Abeokuta, Nigeria
2Yaba College of Technology, Yaba, Lagos State, Nigeria
3National Horticultural Research Institute, Nigeria
Correspondence to: G. C , University of Agriculture, Abeokuta, Nigeria.
| Email: |  |
Copyright © 2012 Scientific & Academic Publishing. All Rights Reserved.
This paper deals with pollution aspect of environmental management and monitoring of the continental shores of the Lagos Lagoon for its sustainable development. The water quality assessment of coastal waters, at the principal locations of the lagoon susceptible to high level of pollution in the Ebute-Metta and Eti-Osa axis of the Lagos Lagoon was performed. Assessment was undertaken according to different physical and chemical parameters including biological oxygen demand (BOD), Dissolved oxygen (DO), electric conductivity (EC), total suspended solids (TSS), Alkalinity, Acidity, Total hardness (TH), grease content, major cations and anions, and some heavy metals. Results showed that the Shores of the Lagos lagoon at the Iddo and C.M.S axis becomes progressively polluted by the waste materials discharged along its course. Thus, Lagoon at these locations currently faces a number of serious environmental and ecological challenges. Urbanization and high commercial activities at this axis of the Lagoon contributed to the water quality deterioration with regional consequences on the aquatic ecosystem and on the health of the down stream’s user groups. This synergetic effect is of concern for the sustainable use of the resources.
Keywords: Lagos Lagoon, Water Pollution, Ions, Heavy Metals, Water Quality
Cite this paper: Eruola , A. O. , Ufoegbune , G. C , Ojekunle , Z. O. , Makinde , A. A. , Ogunyemi , I. O , "Analytical Investigation of Pollutants in Coastal , Nigeria", Advances in Analytical Chemistry, Vol. 1 No. 1, 2011, pp. 8-11. doi: 10.5923/j.aac.20110101.02.
1. Introduction
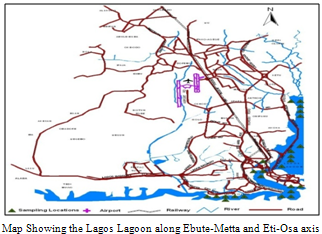
- Oceans are ecosystems, quite susceptible to pollution. The ocean is made up of continental shelf and deep oceans[3]. However, the continental shelf are the most productive in terms of food supply and also most vulnerable to highest pollution load from sediment transported from tributaries. Consequently many estuaries have become so badly polluted that they have been closed to commercial fishing. For instance, Lagos Lagoon along the Ebute-Metta and Eti-Osa axis currently faces a number of serious environmental and ecological challenges. Uncontrolled discharge of untreated wastewater, sewage, sediment carrying runoff as well as solid wastes into the lagoon has degraded the quality of surface water beyond the acceptable limits.[1] and Osibanjo[2] conducted a research on the effect of effluents on Ikopoba River in Benin, Nigeria, where a rise in pH, a decrease in dissolved oxygen and increase in BOD, COD and total suspended solids, were noticed to have their own bearing on the aquatic life of the river. The impacts of water quality deterioration have regional consequences on the aquatic eco-system and on the health and cultural, religious and aesthetic values of the downstream user groups. The overall damage caused by the continuous discharge of unregulated and uncontrolled solid and liquid wastes into the Lagos Lagoon along the Ebute-Metta and Eti-Osa axis has provided impetus to community, environmentalists, policy makers and all other stakeholders to brainstorm on the environmental perspectives for the overall sustainability of the environment. The present study was performed to investigate the pollution extent of the Lagos Lagoon along the Ebute- Metta and Eti-Osa axis. The Lagos Lagoon is located in the area of of . The Lagos Lagoon along the Ebute-Metta and Eti-Osa axis is a coastal terrain and is surrounded by urban development as shown in figure.
 The study area has a typical tropical climate, which is marked by two prominent seasons. The rainy season extends generally from March to November with intermittent dry spells. This is the period when the south-westerly wind prevails. The dry season usually occurs from December and March when the area is under the influence of the north- easterly wind. The Ebute metta and Eti-osa and its environs are typical of the country’s Southern zone with relatively moderate temperature and fairly excessive humidity particularly during the rainy season. The average annual rainfall in Study Area is about 1500 mm. The average slope of natural drainage lines in the present undeveloped regions of the study area is about 1:10,000. Unfortunately, some of these natural drainage lines have been blocked by development in the eastern coastal areas, resulting in the creation of large swamps and a rise in the groundwater table in the neighbouring undeveloped areas. The study area consists of outcrops of two main geological formations. The coastal plain sands which form the low, gently sloping dissected uplands, reaching in places a height of 6 to about 30 meters, and the recent coastal deposits which form the extensive and swampy alluvial plains of the major rivers and creeks along the coast overlying the coastal plain sands.
2. Materials and Methods
- Five sampling points were established for the study, they are the Iddo axis, axis, third axis, Apapa Jetty axis and axis. The choice of five sampling points was based on their accessibility, nearness to urban settlement and their suitability for the future survey. All the stations were accessible through navigation by boats.Water samples at different locations collected for laboratory analyses were taken at the mid-streams of the Lagoon at 5m depth during the humid period with the aid of improvised hallow sampling gauge and labelled immediately on the field. The samples were transported in ice chests to the different laboratories where they were either analysed immediately or stored at 40℃ or less to monitor the present status of source pollution indicative parameters. Water samples for physical and chemical analyses were collected vertically in replicates on boats, midstream at different sampling points along the Lagos Lagoon. This was needed in order to establish an initial baseline of information for the future studies. It is also necessary so as to assess the Lagoon according to its self-purification capacity and to determine the pollution extent. Standard laboratory methods were employed for the analysis.
3. Results
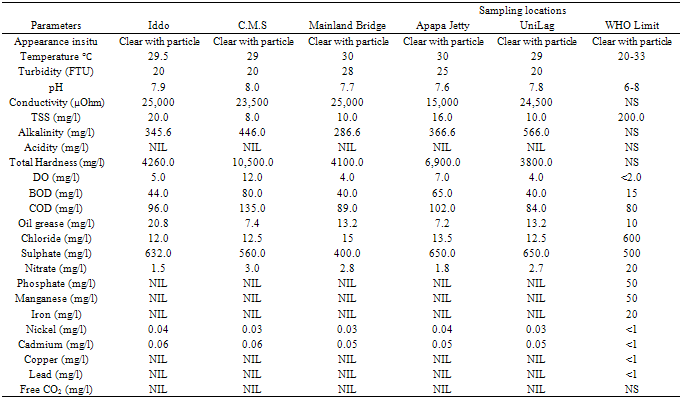
- From water quality analysis results obtained from the field measurements at the five sampling locations presented in table 1, it is found that the physical and chemical parameters such pH (8.0), and alkalinity (566mg/l) upper limit were all within the specified limit by[4] for good fresh water quality.
|
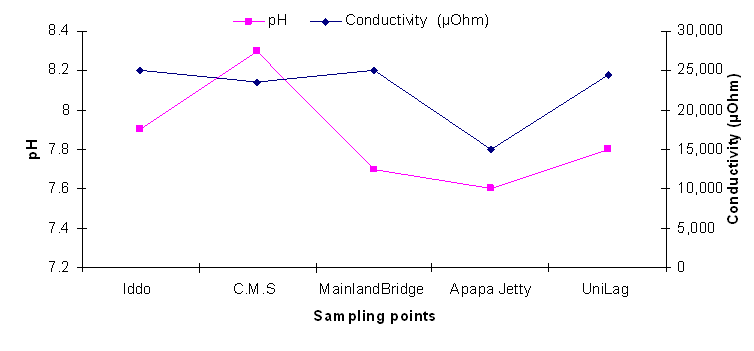 | Figure 1. Map showing the pH and conductivity distribution of Lagos Lagoon at the Ebute-Metta and Eti-osa axis |
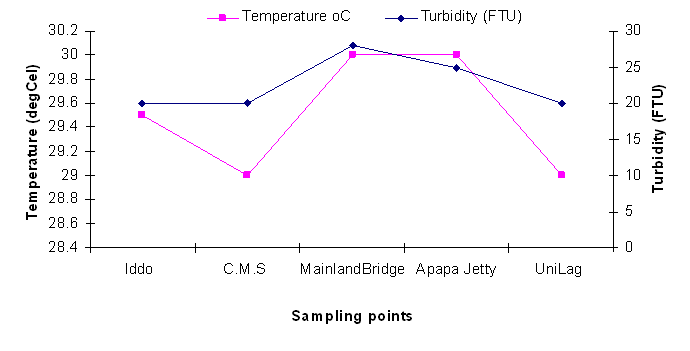 | Figure 2. Map showing the temperature and turbidity distribution of Lagos Lagoon at the Ebute-Metta and Eti-osa axis |
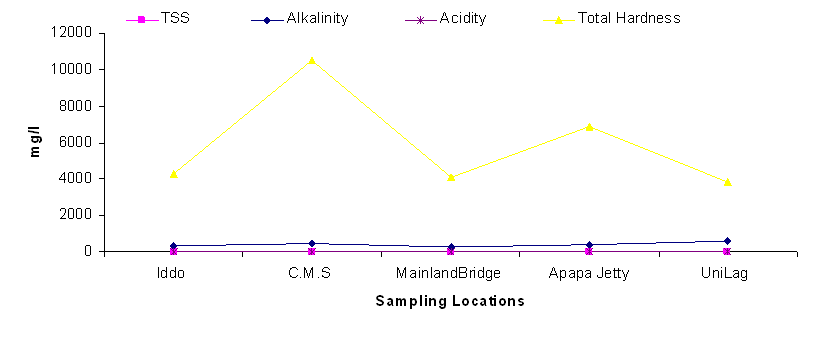 | Figure 3. Map showing the TSS, acidity, alkalinity and total hardness distribution of Lagos Lagoon at the Ebute-Metta and Eti-osa axis |
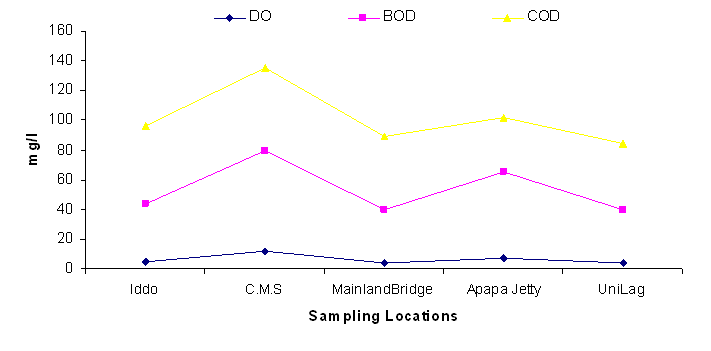 | Figure 4. Map showing the DO, BOD and COD distribution of Lagos Lagoon at the Ebute-Metta and Eti-osa axis |
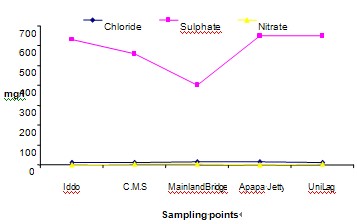 | Figure 5. Map showing the chloride, sulphate and nitrate distribution of Lagos Lagoon at the Ebute-Metta and Eti-osa axis |
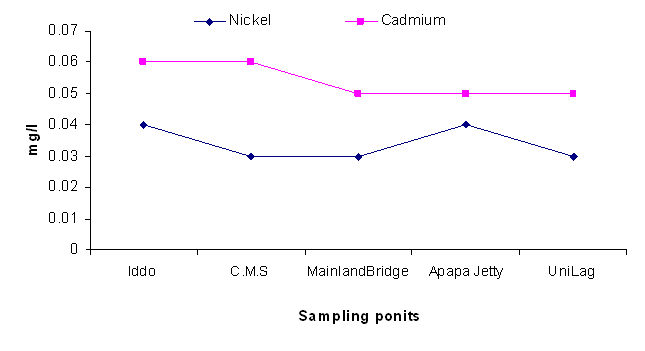 | Figure 6. Map showing the Nickel and Cadmium distribution of Lagos Lagoon at the Ebute-Metta and Eti-osa axis |
4. Discussion
- The study showed that the water quality of Ebute- Metta and Eti-osa axis of Lagos Lagoon are of very good chemical quality and suitable for any freshwater fauna and flora and recreation purposes. However, fairly high value of DO, BOD and COD were observed in these areas of the Lagoon. Furthermore, the vicinity of the Lagoon at Iddo and C.M.S axis were noticed to be the most polluted area. This implies that the Lagoon at this two sampling points is highly polluted with the commercial activity in that location. The water quality in these locations of the Lagoon is rapidly declining, thereby rendering the water unsuitable for any freshwater fauna and flora and recreation purposes.
5. Conclusions
- Uncontrolled disposal of raw sewage, sediment carrying runoff and effluents into the Lagoon system has created serious health concerns for the downstream water user groups. In view of the experiences and the lessons learnt from the past, the concept of Basin-wide planning has been felt necessary for sustainable development in Nigeria.