-
Paper Information
- Next Paper
- Previous Paper
- Paper Submission
-
Journal Information
- About This Journal
- Editorial Board
- Current Issue
- Archive
- Author Guidelines
- Contact Us
Nanoscience and Nanotechnology
p-ISSN: 2163-257X e-ISSN: 2163-2588
2016; 6(1A): 83-87
doi:10.5923/c.nn.201601.16

Enhancement of Optical Absorption by Incorporation of Plasmonic Nanoparticles in PANI Films
 Abstract
 Reference
 Full-Text PDF
 Full-text HTML
Ashwini B. Rohom , Priynka U. Londhe , N. B. Chaure
Electrochemical Laboratory, Department of Physics, Savitrbai Phule Pune University, Pune, India
Correspondence to: Ashwini B. Rohom , Electrochemical Laboratory, Department of Physics, Savitrbai Phule Pune University, Pune, India.
| Email: |  |
Copyright © 2016 Scientific & Academic Publishing. All Rights Reserved.
This work is licensed under the Creative Commons Attribution International License (CC BY).
http://creativecommons.org/licenses/by/4.0/

Recently 1D nanostructured polyaniline (PANI) are the focus of intense research owing to their high mobility, good environmental and chemical stability. PANI has various applications in the areas like solar cell, sensor, electrocatalysis, supercapacitor, electrochemical capacitor, rechargeable batteries, electrochromic displays and anticorrosion coating. Metal nanoparticles (NPs) incorporated in solid materials have received enormous interest in recent years because of the possibility of tuning the optical, electrical and electrocataylic properties. To increase the efficiency of organic-inorganic solar cell, plasmonics phenomenon can be used to trap the light inside the absorber material to increase the absorbance. Here we have studied the light trapping using gold nanoparticles embedded in the emeraldine salt form of PANI. Highly conducting PANI thin films with fibrous morphology have been successfully synthesized by electropolymerization. Gold nanoparticles of size ~ 10-20 nm were used to form the PANI-Au nanocomposites by a simple chemical route. The dose of Au nanoparticles was increased systematically and studied the optical, structural, morphological and electrical properties. XRD pattern confirms the amorphous nature of PANI. The peaks corresponds to emeraldine salt form, π-π* interband transition (317 nm), polaron band transition (371-427 nm) and bipolaron band transition (750 nm) were observed in the UV-Vis absorption spectra for pristine PANI thin films. The PANI has found to be changed from the emeraldine salt to emeraldine base in the presence of Au NP’s. The peaks observed in photoluminescence spectra at 395 nm and 610 nm corresponds to π*-π interband transition and excitonic transition, respectively were found to be increased due to presence of Au nanoparticles. FESEM images reveal the growth of long fibers of diameters ~ 100 nm decorated with gold nanoparticles having size 20-30 nm. This nanocomposite layer can be directly used as absorber layer in hybrid solar cells to form graded band-gap structure.
Keywords: Polyaniline, Electrodeposition, PANI-Au nanocomposite, Absorption spectra and Plasmonic
Cite this paper: Ashwini B. Rohom , Priynka U. Londhe , N. B. Chaure , Enhancement of Optical Absorption by Incorporation of Plasmonic Nanoparticles in PANI Films, Nanoscience and Nanotechnology, Vol. 6 No. 1A, 2016, pp. 83-87. doi: 10.5923/c.nn.201601.16.
Article Outline
1. Introduction
- Conducting polymers are a special class of organic polymers having good conductivity due to presence of alternate single-double bond conjugation. Among them, Polyaniline (PANI) demonstrates outstanding properties due to its unique electrical, electrochemical properties, high mobility, good environmental and chemical stability [1]. PANI has variety of applications [2]. PANI is well known for its ease of synthesis and can be synthesized by either chemical oxidation or electrochemical polymerization [3, 4]. Electrochemical polymerization is preferable than chemical oxidation since a good quality polymer film is formed using electropolymerization. PANI can be found in one of the three oxidation states: fully reduced state Leucoemeridine, half oxidized state Emeraldine and fully oxidized state Pernigraniline. The most common green protonated emeraldine salt (ES) has highest conductivity among all forms of PANI. These emeraldine salt can be converted into non-conducting blue emeraldine base (EB) when treated with base. The EB form of PANI can be again protonated (doped) to form emeraldine salt (ES) by an acid and EB form can be dedoped back by base. The doping process causes a conductivity variation from ~ 10-10 to 10 Ω-1cm-1 [5]. ES form of PANI shows absorption in region of 300 nm to 400 nm and in near IR region. To increase the absorption of in visible region, Au were incorporated in PANI since gold shows strong surface plasmon resonance in visible region. Incorporation of metal nanoparticles into PANI has been proposed as a way of increasing its electrochemical and electrocatalytic activities. PANI-Au nanocomposites are considered to be particularly unique materials because Au NPs have attractive electrical and optical properties. In organic/hybrid solar cell these NPs can be used to increase the efficiency of solar cell by trapping more light inside the absorber layer. Here, PANI thin films were prepared by using electropolymerization. The doses of Au NPs were varied systematically in PANI films and characterized with a range of characterization techniques to study various properties.
2. Experimental Section
- Analytical reagent grade aniline (C6H5NH2) and perchloric acid (HClO4) was used for the electropolymerization of PANI. Chloroauric acid (HAuCl4), sodium borohydride (Na2B4O7) and hexadecyl-trimethyl- ammonium bromide (CTAB) were used for the synthesis of gold nanoparticles. The synthesis procedure for PANI thin films [6] and Au NPs [4] are reported elsewhere. The pristine PANI thin films were functionalized with different doses of Au NPs. The green color of PANI films were then chanced to blue color, indicating the formation of EB form of PANI. These samples were dried under argon flow and used for further characterization. Electropolymerization of PANI was carried out by potentiostat/galvanostat AUTOLAB, μ3AUT 70762. X-ray diffraction (XRD) measurements were performed using a Bruker D8 advance diffractometer. Optical absorption measurements were carried by JASCO UV-vis spectrophotometer. Photoluminescence spectra’s (PL) were recorded using JASCO-photometer. The surface morphology was studied by using HITACHI, S 4800 field emission scanning electron microscope (FESEM). Raman spectra’s were obtained with Invia Renishaw Raman Microscope coupled with Philips CCD camera with 785 nm excitation laser.
3. Results and Discussion
3.1. Electropolymerization of PANI
- PANI films were electropolymerized using cyclic voltammetry technique. Figure 1 (a) shows X-ray diffraction pattern of PANI thin film. Intense bands observed at 2θ ~ 15.40°, 24.20° and ~25.00° confirm the synthesis of emeraldine salt of PANI [7]. Presence of prominent peaks suggests the formation of highly crystalline PANI thin films.
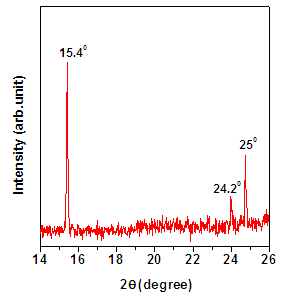 | Figure 1a. XRD pattern for PANI thin film |
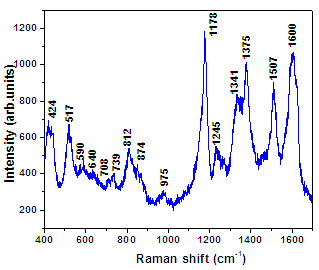 | Figure 1b. Raman spectra for PANI thin film |
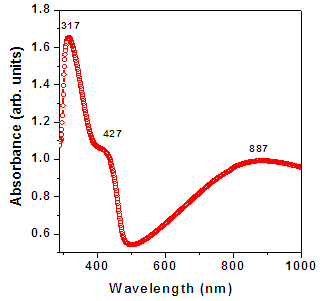 | Figure 2a. Optical absorption spectra for PANI thin film |
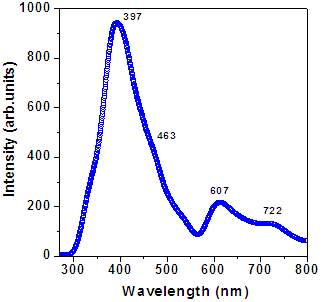 | Figure 2b. Photoluminiscence spectra for PANI thin film |
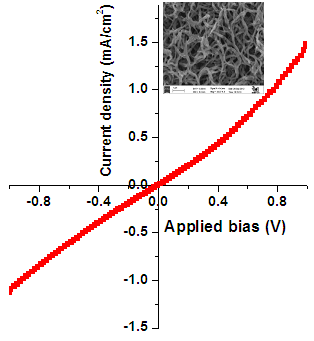 | Figure 3. J-V curve for PANI thin films. Inset shows SEM micrograph of PANI thin film |
3.2. Growth of Au NPs
- Au NPs were synthesized using a simple colloidal route. These nanoparticles were dispersed in aqueous solution and used for further characterization.Optical absorption spectrum for Au NPs prepared with CTAB is shown in figure 4. Absorption spectra attributed sharp SPR peak at 527 nm indicates the narrow size distribution, which is further confirmed by TEM. Inset shows the TEM image of Au NPs. The size of Au NPs observed from TEM was ~ 10 -20 nm.
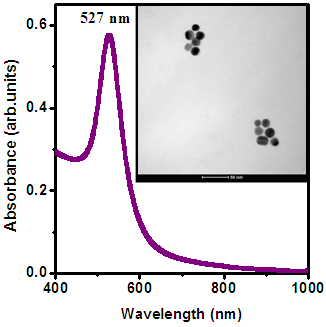 | Figure 4. Optical absorption spectra for Au nanoparticles (Inset shows corrosponding TEM image) |
3.3. PANI-Au Nanocomposite
- Pristine PANI films were embedded by Au NPs with different dose. These samples were characterized by different technique to study their various properties.Figure 5 (a) shows the optical absorption spectra of as-prepared PANI and PANI-Au thin films with different doses of Au NPs. Three peaks observed in pristine PANI films at 317 nm, 427 nm and 887 nm are associated to the formation of emeraldine salt form of PANI. A clear enhancement in the absorption of PANI in visible area is observed upon increasing the dose of Au NPs in PANI films. Conversion of PANI from emeraldine salt to emeraldine base takes place as the dose of Au NPs implemented onto PANI films. The peak attributed around 600 nm in the nanocomposites sample dipped in Au solution for 30 mins is due to the excitonic transition.
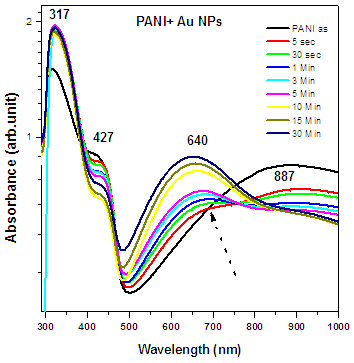 | Figure 5a. Optical absorption spectra of as-prepared PANI and PANI-Au nanocomposites with different doses of Au NPs |
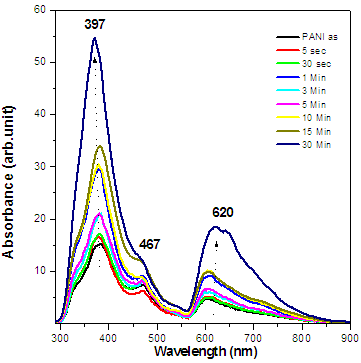 | Figure 5b. Photoluminescence spectra of as-prepared PANI and PANI-Au thin films with different doses of Au NPs |
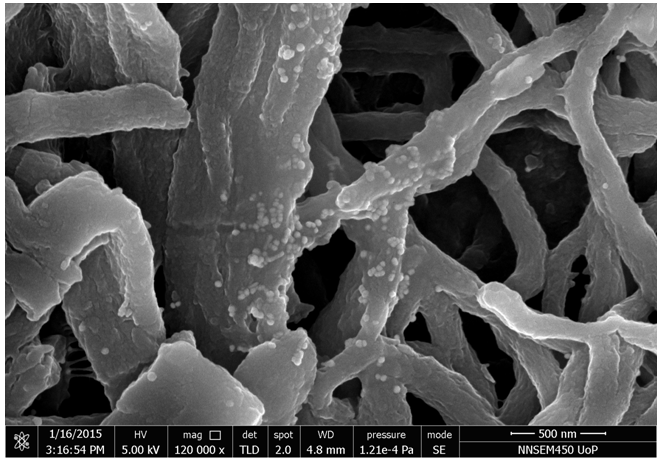 | Figure 6. FESEM image for PANI-Au nanocomposite (Au dose for 3 mins) |
4. Conclusions
- Polyaniline with fibrous morphology were successfully electropolymerized using perchloric acid. The effect of different Au doses on PANI films was studied. Optical absorption spectra showed absorption peak for π-π*, polaron and bipolaron transition for pristine PANI films, while the excitonic transition related peak was observed with Au NPs. The emeraldine form of PANI has been changed to emeraldine base form after the incorporation of Au NPs in PANI. Photoluminescence study shows the formation of PANI in emeraldine salt form, with increase in Au doses the emission intensity was found to be increased. FESEM micrographs shows presence of around 10-20 nm gold NPs along side with PANI fibers. The prepared PANI-Au nanocomposite layer with increase in absorption in visible region can be directly used as absorber layer in hybrid/organic solar cells.
ACKNOWLEDGEMENTS
- The authors are thankful for the financial support received from Defence Research and Development Organisation, New Delhi, India under the major research project, ERIP/ER/10003866/M/01/1388.