Sailender M.1, G. Chandra Mohan Reddy2, S. Venkatesh3
1ARDC, Hindustan Aeronautics Limited, Bangalore, India
2Mahatma Gandhi Institute of Technology, Gandipet, Hyderabad, India
3Department of Mechanical Engineering, University College of Engineering, Osmania University, Hyderabad, India
Correspondence to: Sailender M., ARDC, Hindustan Aeronautics Limited, Bangalore, India.
| Email: |  |
Copyright © 2016 Scientific & Academic Publishing. All Rights Reserved.
This work is licensed under the Creative Commons Attribution International License (CC BY).
http://creativecommons.org/licenses/by/4.0/

Abstract
Carbon steel is one of the most widely used materials in the industry for moderate and service requirements. For strong and continuous weld, widely used welding process in manufacturing industry is submerged arc welding (SAW). SAW has a large number of process parameters, act together in an intricate manner and influence the output performance. It is important in selecting process parameters to maintain the desired quality. The present work, parametric optimization of main parameters, such as open circuit voltage (OCV), wire feed rate (WFR), welding speed (WS) and nozzle-to-plate distance (NPD) and thereby to study influences on the output, heat affected zone (HAZ) of the weldments. Taguchi’s L9 orthogonal array is been adopted to conduct experiments. The study is made by conducting experiments in ‘purging with gas’ condition and compared with ‘as weld’ experiments. The performance measure of control levels to select is observed through S/N ratio. The significance of the parameter and their contribution is calculated by ANOVA. Correlations are established between process parameters and performance outputs using regression analysis. Models developed and checked for their adequacy with the F-test, determined quantitatively and presented graphically. Validated models through confirmation tests and the predicted results are within the limits.
Keywords:
Submerged Arc Welding, Taguchi, Analysis of Variance and Regression Models
Cite this paper: Sailender M., G. Chandra Mohan Reddy, S. Venkatesh, Influences of Process Parameters on Heat Affected Zone in Submerged Arc Welding of Low Carbon Steel, American Journal of Materials Science, Vol. 6 No. 4A, 2016, pp. 102-108. doi: 10.5923/c.materials.201601.20.
1. Introduction
Steel is one of the world’s most essential materials most widely used metals in our modern world and is fundamental to every aspect of our lives, from infrastructure to the humble tin-plated steel can that preserves food. It is strong, versatile durability, strength, affordable and infinitely recyclable [1]. ASTM A516 Gr.70 is a carbon-manganese steel and is suitable for the fabrication of welded pressure vessels designed for moderate and lower-temperature service, which require a continuous strong joint. Submerged arc welding (SAW) is one of the most widely used automatic welding process in manufacturing industry, due to deep penetration, smooth bead with high quality and reliability [2]. SAW has various notable input parameters and operating conditions, which influence together in an intricate manner on weld quality, physical characteristics as well as metallurgical characteristics [3]. It needs to be controlled to attain the required weld quality characteristics. Insufficient weld bead dimensions will cause to malfunction of the welded structure. The output responses in SAW are mainly influenced by parameters such as arc voltage, weld current, weld speed, electrode feed and gap between weld plate & electrode. In many applications, engineers are facing the difficulty in predicting appropriate combinations of parameters to attain better weld quality. It requires number of experiments, which consumes time and expensive. To attain with better weld quality and to optimize the process parameters at a low cost, a designed experiment is the concurrent evaluation of two or more parameters for their ability to affect the resultant mean of particular process characteristics. Taguchi’s philosophy is an efficient tool and explained design of experiments (DOE) through parametric optimization of process [4]. Involves orthogonal arrays and systematize the parameters affecting the process, at which levels to be varied instead to test all combinations. Fisher [5] is made use of the factorial methods for achieving the interaction effects on response parameters through the statistically designed experiments. Robert et al. [6] are conferred with rich examples by means of actual engineering and scientific studies on experimentation strategy, data analysis and experimental results interpretation. The statistics, which is an integral component of experimentation, used to demonstrate the planning phase to the conclusions presentation. Douglas [7] enlightened the methods of descriptive statistics, the normal distribution and basics of confidence intervals and hypothesis testing for means and variance. Alberry et al. [8] are developed a computer program model for heat-affected zone (HAZ)’s for single and multi-pass mechanized tungsten-inert-gas weldments. Their model is based on semi-empirical correlations to explain the effects of major welding variables on the weld bead dimensions; classical heat flow to the welding conditions and the component geometry and finally basic metallurgy includes phase transformations, grain growth, and precipitate dissolution kinetics. Murugan et al. [9] enlightened the selection process of design matrix for the required process parameters to their optimization through central composite rotatable factorial design of response surface method. Chandel et al [10] investigated theoretical predictions of the effect of current, electrode polarity, electrode diameter and electrode extension on the melting rate, bead height and width and weld penetration in SAW. Gunaraj et al. [11, 12] studied the effects of process variables and heat input on the HAZ for bead-on-plate and bead-on joint welding of SAWs by building mathematical models in structural steel pipes and comparative study made between the area of the HAZ between these weld joints. Also proposed the solution for the input parameters selection of the optimum combination through the developing the models by means of effective strategic planning and the execution of experiments to avoid pipes fabrication problems [13]. Tušek [14] employed mathematical modelling of melting rate in twin-wire welding and figured that the models are accurate practically. Saurav Dutta et al. [15] are used Taguchi philosophy for obtaining optimal parametric combinations to achieve desired weld bead geometry and dimensions related to the heat-affected zone, such as HAZ width in submerged arc welding and aimed at integrating statistical techniques into the engineering process. Shen et al [16] examined that the weld bead geometry characteristics, HAZ size, deposition area and penetration area increased with increasing heat input but decreased the bead contact angle by his series of observations on specimens in submerged arc welded plates of ASTM A709 Grade 50 steel. Hari Om et al. [17] studied the effect of polarity and other SAW parameters on HAZ size and dilution. The correlations are also carried out and influences of heat input on dilution and HAZ. Patricia Sheilla Costa et al. [18] are studied the impact of the parameters on mechanical strength and hardness of the heat affected zone (HAZ) of the submerged arc welding using a central composite design of response surface methodology.
2. Material and Methodology
2.1. Material
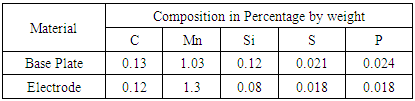
ASTM A516 Grade70, low carbon steel, is chosen as base plate material which requires continuous welding for long service. It is in plate form with 8 mm thick. ESAB-OK Autrod 12.40 L brand with 3.15 mm diameter copper coated electrode, in coil form (AWS Code: A5.17: EH14 DIN 8557: S4) along with basic-fluoride-type granular flux is used for the experimentation. Table 1 represents the chemical composition of both base plate and electrode material.Table 1. The Chemical Composition of Base Plate and Electrode
 |
| |
|
2.2. Methodology
Taguchi’s technique, a robust design, is intended to make high quality product to the manufacturer at economical and extensively used for engineering applications. It is to investigate the influences of different parameters with mean and variance of a process performance characteristic to describe the functioning of process. Proposed experimental designs use of orthogonal arrays to systematize the parameters, variations in them and affecting at which levels, on the process instead to test all possible combinations. It also allow to collect the required data, for defining the most effecting factor on the product quality with a minimum number of experimentations, thus saves time and resources. To find out any nonlinear effect, three levels are considered to be sufficient and the same is taken. Since there are four parameters considered in the present work, the minimum number of experiments is calculated based on the equation 1. 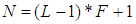 | (1) |
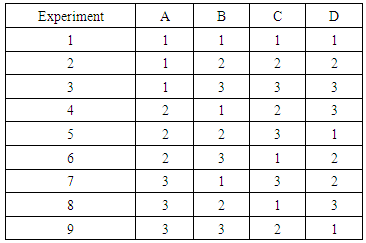
Where N is minimum number of experiments, L is the number of levels (3) and F is number of factors (4). From the equation, the minimum number of experiments is calculated as 9. Hence the orthogonal array L9 is selected, as shown in Table 2.Table 2. L9 - Orthogonal Array
 |
| |
|
2.2.1. S/N Analysis
The signal to noise (S/N) ratio is for significant parameters identified and optimum input parameter for each characteristic is predicted through S/N values and the mean response. It is a performance measure to select control levels that best manage with the noise. In simple, S/N ratio is the mean of standard deviation. S/N ratio depends on the criterion for which characteristic to be optimized. S/N analysis consists (i) higher the better, (ii) smaller the better and (iii) nominal the better criteria. In the present work, the criterion is smaller the better, selected for HAZ, S/N is calculated.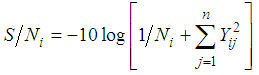 | (2) |
Where Yij is measured value of quality property characteristic of ith trail jth experiment and N is number of experiments in a trail.
2.2.2. Development of Mathematical Model
The mathematical models are generated for determining the effects of parameters and build correlations between the experimental and model values. The functional relationship y = f (OCV, WFR, WS, NPD) is considered, where y is the response. The predictor variable such as open circuit voltage (OCV), wire feed rate (WFR), weld speed (WS) and nozzle-to-plate distance (NPD) are represented as V, F, S and D respectively. This relation can be expressed using linear regression model, shown in equation 3.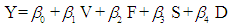 | (3) |
where β0 is the intercept constant for the response; β1, β2, β3 and β4 are the parameter coefficients.
2.2.3. Analysis of Variance (ANOVA)
ANOVA determines the adequacy of the models and the contribution of the significant parameter(s) identified. New experimental runs are carried out as confirmation tests to ensure correctness of the analysis. Minitab 17 is used for the analysis and also for the graphical representation.
2.3. Experimentation
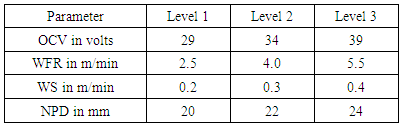
Before the actual experiments, trail runs are made to fix the upper and lower limits of the identified process parameters such as open circuit voltage (OCV), wire feed rate (WFR), welding speed (WS) and nozzle-to-plate distance (NPD), for achieving quality weldment. Welding Procedure Specification is followed as per ASME IX code and the parameters fixed at three levels, shown in Table 3 and fitted in the design matrix shown above in Table 2 for experiments.Table 3. Fixed Parameters at Three Levels
 |
| |
|
The experiments are conducted on ADORE PS-800 semiautomatic welding equipment with a capacity of 800A power source, shown in Figure 1(a).A V-butt joint with 1.2mm land having work-piece dimensions as 150 x 300 x 8 mm is selected to weld in flat position, keeping the electrode positive and perpendicular to the plate. All the surfaces are buffed and cleaned for oxide free material. Weld base plates are placed on copper backup strip, which is arranged within the calibrated fixture of MS plate by making a groove.The author is attempted experiments using ‘purging with Co2 gas’ in submerged are welding (SAW) instead traditional ‘as weld’ of SAW, shown in Figure 1(b) with a provision for gas along with electrode.After the experiments, from each weld coupon three specimen’s cross-sectioned using power hacksaw. Specimens are polished and etched in 2% Nital for recording the responses like HAZ width and HAZ area features using callipers. Specimens from the weld coupons are presented in Figure 1 (c & d).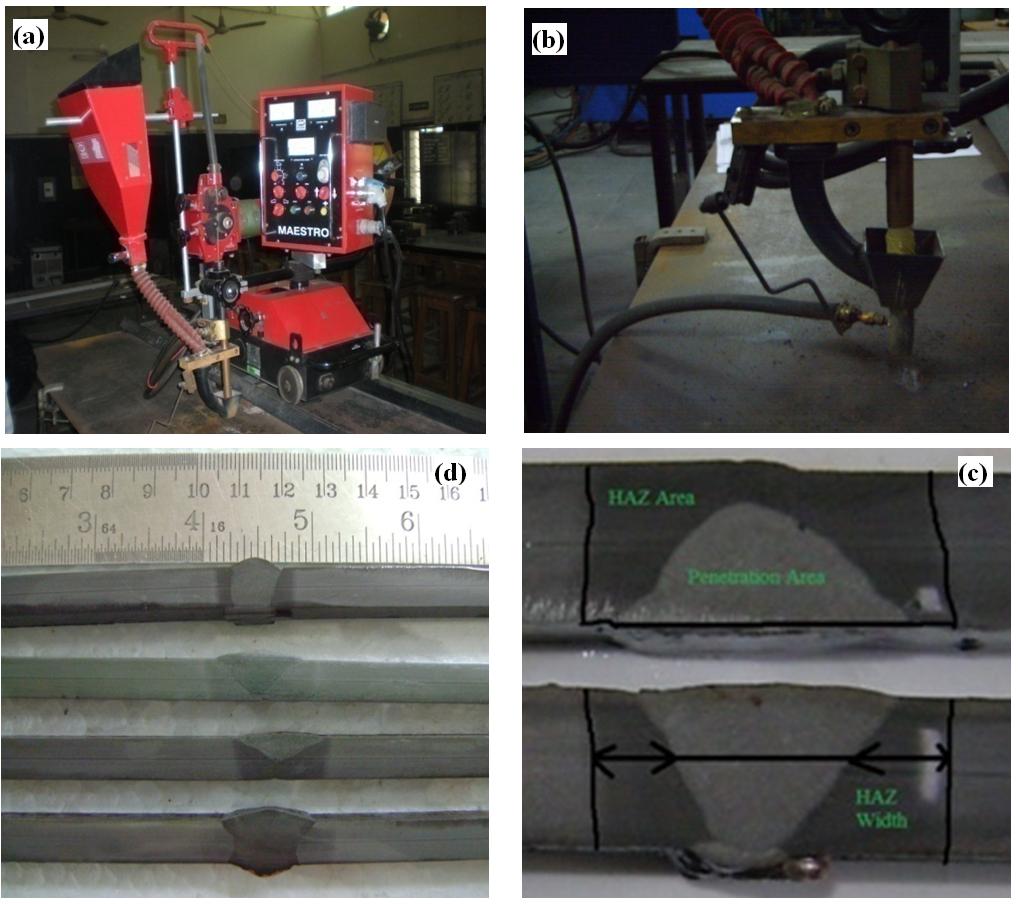 | Figure 1. Experimental Setup (a) for ‘as-weld’ condition; (b) ‘purging with gas’ condition; (c) and (d) are the specimen for HAZ characteristics |
3. Results and Discussions
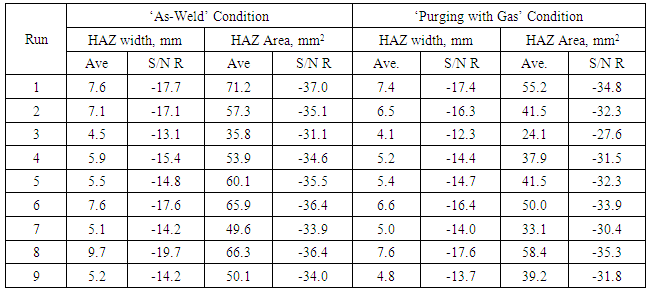
The recorded responses such as HAZ width and HAZ area for each experimental run are measured through the standard procedures and represented in Table 4 for both weld conditions with s/n ratio.Table 4. Response values in 'as weld' and 'Purging' condition
 |
| |
|
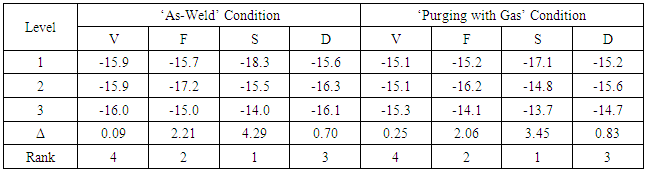
S/N ratio is for each characteristic(s) is calculated, significant parameter(s) is identified and optimum condition is predicted through S/N values and the mean response. S/N ratios the responses for each parameter of both weld conditions, at three levels are calculated and are presented in Table 5 (a) and 5 (b) for HAZ width and HAZ area respectively. Higher the difference between their maximum and minimum values designates higher relative effect of parameter on the responses.Table 5(a). Signal to Noise Ratio for HAZ Width
 |
| |
|
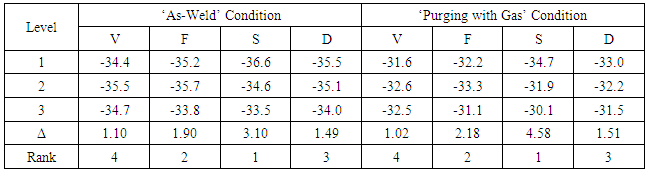
Table 5(b). Signal to Noise Ratio for HAZ Area
 |
| |
|
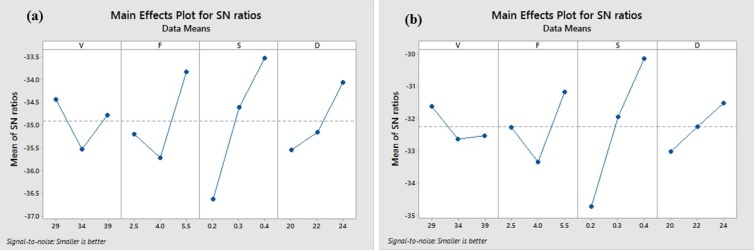
3.1. Effect of Parameters on HAZ Width
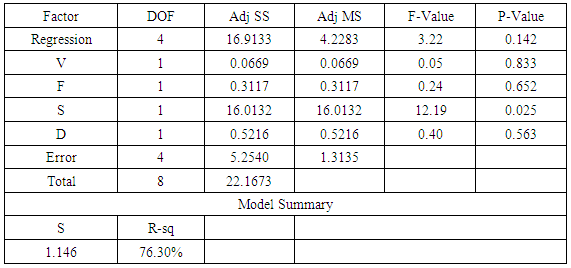
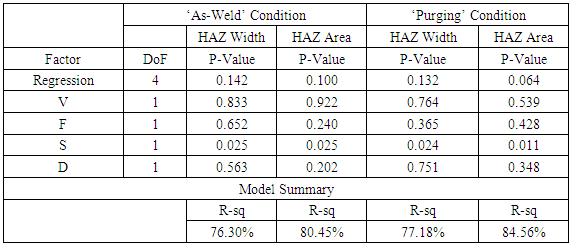
From the calculation, shown in Table 5(a), it is observed that the most significant parameter that effects in both ‘as weld’ and ‘purging with Co2 gas’ conditions is wire feed rate followed by weld speed. From the average S/N values of these characteristics for process parameters at three levels indicates the optimum condition. At OCV-1, WFR-3, WS-3, NPD-3 is noted the optimum condition for both ‘as weld’ and ‘purging with gas’ conditions. Here 1, 2 and 3 represents the levels.The variations in the process variables at three levels of S/N ratios are represented in Figure 2 for both weld conditions. Table 6 shows the results of analysis of variance of HAZ width for T-sample, which is calculated at 95% confidence. Similarly, for P-sample is calculated. The consolidated F-test values i.e. p-values and R-sq values of model are shown in the Table 7. This is showing the parameter adequacy. The weld speed and wire feed rate are contributing 69% and 22% respectively in ‘as weld’ condition and where as in ‘purging’ condition, 71% and 24% respectively. The final models with coefficient values are shown in equation 4.Table 6. Analysis of Variance of HAZ Width for T Sample
 |
| |
|
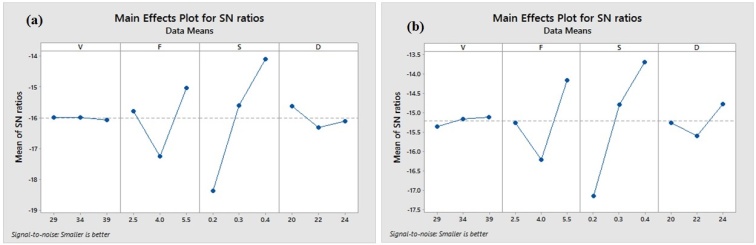 | Figure 2. Signal to Noise Ratios of (a) ‘as-weld’ and (b) ‘purging’ condition for HAZ Width |
3.2. Effect of Parameters on HAZ Area
Table 5(b) is showing the calculated results of s/n analysis and observed the most significant parameter that effects in both ‘as weld’ and ‘purging with CO2 gas’ conditions is wire feed rate followed by weld speed. From the average S/N values of these characteristics for process parameters at three levels indicates OCV-1, WFR-3, WS-3, NPD-3 as the optimum condition for both the weld process conditions. The variations in the process variables at three levels of S/N ratios are represented in Figure 3 for both weld conditions. Analysis of variance is calculated at 95% confidence, shown the F-test values in Table 7, which represents the parameter adequacy. The weld speed with 64% followed by wire feed rate with 20% are contributing in ‘as weld’ condition and in case of ‘purging’ condition their contributions are 70% and 21% respectively. The final models with coefficient values are shown in equation 5.Table 7. The Results of Analysis of Variance
 |
| |
|
 | Figure 3. Signal to Noise Ratios of (a) ‘as-weld’ and (b) ‘purging’ condition for HAZ Area |
3.3. Final Regression Models
The correlation between the factors is determined from the following linear regression equations 4 and 5. The R2 values, coefficients of determination values, of developed models have a very good correlation between the experimental and predicted values. The normal probability plots of the residuals versus the predicted response for HAZ width and HAZ area are plotted in Figure 4 and Figure 5 respectively for both weld conditions. From them, it is revealing that the data closely follows the straight line. That is the data obeying the normal distribution law, which is observed when the p value is greater than the level of significance and it implies that the models proposed are adequate. | (4.1) |
 | (4.2) |
 | (5.1) |
 | (5.2) |
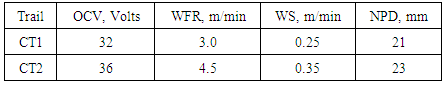
3.4. Confirmation Tests
New experiments are conducted to validate, with two new combinations of process parameters. The process parameters used for confirmation tests are illustrated in Table 8.Table 8. Process Parameters for Confirmation Test
 |
| |
|
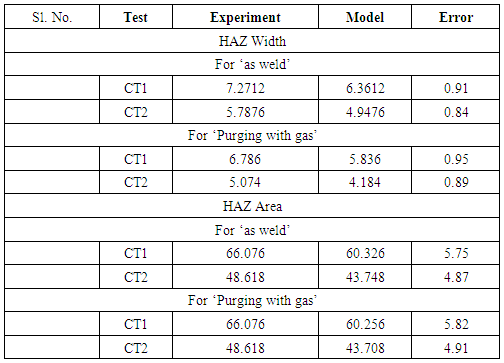
The results obtained, where a comparison is done between the foreseen values from the model developed in the present work equation 4 and equation 5; with the values obtained experimentally are shown in Table 9. From this analysis, we can observe that the calculated error for process parameters such as open circuit voltage, wire feed rate, weld speed and nozzle-to-plate distance. Therefore, equation 4 and equation 5 correlate the relationship of the process parameters with the output responses with reasonable degrees of approximation.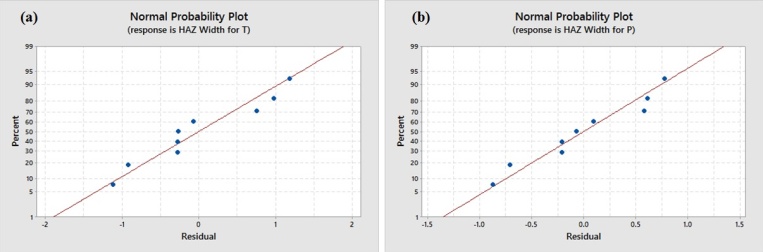 | Figure 4. Normal Plots of (a) ‘as-weld’ and (b) ‘purging’ condition for HAZ Width |
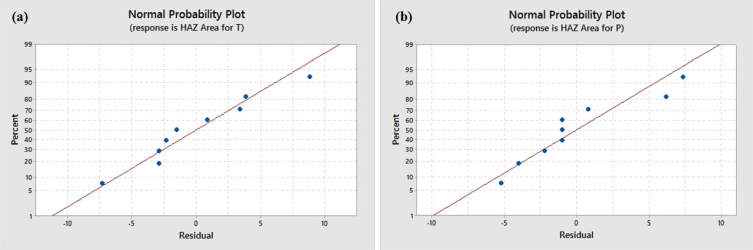 | Figure 5. Normal Plots of (a) ‘as-weld’ and (b) ‘purging’ condition for HAZ Area |
Table 9. Comparison of Results obtained from Confirmation Test Runs with Models
 |
| |
|
4. Conclusions
The significant parameters are identified and the optimum conditions for heat affected zone (HAZ) characteristics are predicted. In most of the incidents it is observed that the most significant parameter that effects in both ‘as weld’ and ‘purging with CO2 gas’ conditions is wire feed rate followed by weld speed. The optimum condition for both HAZ width and HAZ area is at OCV-29v, WFR-5.5m/min, WS-0.4m/min and NPD-24mm in ‘as weld’ and ‘purged’ conditions. The analysis of variance has revealed that the rate of contributions of the parameter is significantly by weld speed followed by wire feed rate in both weld conditions. Predicted values from the linear regression models at experimental values are verified by confirmation test values and are found that are in agreement. It is also observed that the ‘purged’ weld condition results revealed through regression models that the coefficients of determination values are on better side than the ‘as weld’ condition.
References
| [1] | Nicholas Walters, 2012, The white book of steel, Belgium, World Steel Association. |
| [2] | AWS, 1992, Welding Handbook- Welding Process SAW (Chapter6), USA, American Welding Society. |
| [3] | G.E. Linnert, 1994, Welding Metallurgy, Miami, American Welding Society. |
| [4] | Phillip J Ross, 1996, Taguchi Techniques for Quality Engineering, Singapore, McGraw-Hill. |
| [5] | R.A. Fisher, 1952, Statistical Methods for Research Workers, Edinburgh, Oliver and Boyd. |
| [6] | Robert L. Mason, Richard F. Gunst and James L. Hess, 2003, Statistical Design and Analysis of Experiments With Applications to Engineering and Science, New Jersey John Wiley & Sons, Inc. |
| [7] | Douglas C. Montgomery, 2004, Design and Analysis of Experiments, Singapore, John Wiley & Sons, Inc. |
| [8] | P.J. Alberry, R.R.L. Brunnstrom and K.E. Jones, 1983, Computer model for predicting heat affected zone structures in mechanized tungsten inert gas weld deposits, Journal of Metals Technology, 10, 28-38. |
| [9] | N. Murugan and R.S. Parmar, 1994, Effects of MIG process parameters on the surfacing of stainless steel, Journal of Materials Processing Technology, 41, 381–398. |
| [10] | R.S. Chandel, H.P. Seow and F.L. Cheong, 1997, Effect of increasing deposition rate on the bead geometry of submerged arc welds, Journal of Materials Processing Technology, 72(1), 124–128. |
| [11] | V. Gunaraj and N. Murugan, 1999, Prediction and comparison of the area of the heat-affected zone for the bead-on-plate and bead-on-joint in submerged arc welding of pipes, Journal of Materials Processing Technology, 95(1–3), 246–261. |
| [12] | V. Gunaraj and N. Murugan, 2002, Prediction of heat affected zone characteristics in submerged arc welding of Structural Steel Pipes, Welding Journal, American Welding Society, 94s-102s. |
| [13] | N. Murugan and V. Gunaraj, 2005, Prediction and control of weld bead geometry and shape relationships in submerged arc welding of pipes, Journal of Materials Processing Technology, 168(3), 478–487. |
| [14] | Tušek, J., 2000, Mathematical modeling of melting rate in twin-wire welding., Journal of Materials Processing Technology, 100(1–3), 250–256. |
| [15] | Saurav Datta, Asish Bandyopadhyay and Pradip Kumar Pal, 2008, Application of Taguchi philosophy for parametric optimization of bead geometry and haz width in submerged arc welding using a mixture of fresh flux and fused flux, International Journal of Advanced Manufacturing Technology, 36, 689–698. |
| [16] | S. Shen, I.N.A. Oguocha and S. Yannacopoulos, 2012, Effect of heat input on weld bead geometry of submerged arc welded ASTM A709 Grade 50 steel joints, Journal of Materials Processing Technology, 212(1), 286–294. |
| [17] | Hari Om and Sunil Pandey, 2013, Effect of heat input on dilution and heat affected zone in submerged arc welding process, Journal Sadhana-Academy Proceedings in Engineering Sciences, Indian Academy of Sciences, 38 (6), 1369–1391. |
| [18] | Patricia Sheilla Costa, Felipe Arturo Reyes-Valdés, Rocio Saldaña-Garcés, David Salvador González-González and Erick Rafael Delgado Albavera, 2015, Optimization of welding parameters in hsla steel using saw process: a pipeline manufacturing approach, Journal of Soldagem & Inspeção, 20(4), 456-466. |

 Abstract
 Reference
 Full-Text PDF
 Full-text HTML