-
Paper Information
- Next Paper
- Previous Paper
- Paper Submission
-
Journal Information
- About This Journal
- Editorial Board
- Current Issue
- Archive
- Author Guidelines
- Contact Us
American Journal of Materials Science
p-ISSN: 2162-9382 e-ISSN: 2162-8424
2016; 6(4A): 82-87
doi:10.5923/c.materials.201601.16

Study of Wear Behaviour of Recycled Metal Powder Filled Epoxy Composites Using Factorial Analysis
M. Sudheer
Department of Mechanical Engineering, St Joseph Engineering College, Mangaluru, Karnataka, India
Correspondence to: M. Sudheer, Department of Mechanical Engineering, St Joseph Engineering College, Mangaluru, Karnataka, India.
| Email: |  |
Copyright © 2016 Scientific & Academic Publishing. All Rights Reserved.
This work is licensed under the Creative Commons Attribution International License (CC BY).
http://creativecommons.org/licenses/by/4.0/

Epoxy composites were prepared by using reprocessed metal dust powder as filler by varying the filler content. The basic mechanical properties such as density and hardness and dry sliding wear performance were evaluated as per ASTM standards. Wear tests were conducted on samples using pin-on-disc machine for different parameters as per full factorial design approach. It was found that filler has contributed to the density and hardness of the epoxy polymer. Factorial analysis indicated that both friction and wear were predominantly influenced by the metal powder content. The study demonstrated that waste metal powders have good potential to be used as filler for thermosets like epoxy.
Keywords: Metal filler, Epoxy, Friction, Wear
Cite this paper: M. Sudheer, Study of Wear Behaviour of Recycled Metal Powder Filled Epoxy Composites Using Factorial Analysis, American Journal of Materials Science, Vol. 6 No. 4A, 2016, pp. 82-87. doi: 10.5923/c.materials.201601.16.
Article Outline
1. Introduction
- The friction and wear study of polymer composites have been of practical interest for over a half century. Polymers are usually compounded with various fillers on micro and nano-scale to improve its performance under different wear conditions [1]. Recently low cost fillers from industrial waste such as fly ash, red mud, flue dust, paper waste, recycled metals and alloy particles etc. are used as fillers for polymers and resulted in the improvement of properties of base polymers. Such an attempt also reduces cost of the final product as these fillers replace the costly polymer portion in the composites [2]. Several literatures are available on use of metal particles as fillers for polymers which has provided special functionalities such as optical [3], electrical [4-6], magnetic [7], thermal [6, 8, 9], mechanical [5, 6, 10-12] and tribological properties [8, 9, 12-16]. Metal polymer composites are also used in sensors and actuators in biomedical applications [17, 18]. The issues specific to the formation of metal polymer composites and their interfaces which are critical to its application are also addressed in the literatures [19]. The current study is concerned with the mathematical approach to the wear study of recycled cast iron powder filled epoxy composites.
2. Experimental Details
2.1. Materials
- Room temperature curing epoxy resin (LY556) belonging to the diglycidyl ether of bisphenol A (DGEBA) family along with the amino based hardener (HY951) supplied by Huntsman Advanced Materials India Pvt., Ltd., Bengaluru, India was used as the matrix material. Cast iron powders collected from the machine shop are first segregated in sieve shaker to obtain fine sized powders (≤ 50 µm) and are then heated at 400°C in muffle furnace for two hours. This heating is done to ensure the removal of foreign particles from the powders.
2.2. Sample Preparation
- Composites are prepared with the varying percentage of metal powders (0, 10 and 20 wt%) using casting procedure. The large difference in density of cast iron powders and epoxy posed a great challenge in casting process. Extreme care is taken to avoid the settling effect of metal particles in epoxy by continuously keeping it under stirring condition. The procedural steps in the casting process are presented elsewhere [20]. Test samples are coded as C0, C10 and C20 where numerals indicate the percentage of metal filler in composite.
2.3. Characterization of Test Samples
- All tests were performed at room temperature and as per ASTM standards. Density was measured according to ASTM D792 using Archimedes Principle. Hardness of developed test samples was measured using Rockwell’s Hardness Tester on M-Scale as per ASTM D785. Wear tests were conducted on pin-on-disc wear apparatus and wear test results are presented in terms of specific wear rate and coefficient of friction as per ASTM G99-05 (2016). Three parameters, namely, sliding velocity (A), normal load (B), and filler content (C) each at three levels, are considered in the full factorial design. Control parameters and their levels are indicated in Table 1. A statistical analysis of variance (ANOVA) was performed to identify the control parameters and their interactions that are statistically significant. The statistical analysis was performed using MINITAB 14 statistical software package.
|
3. Results and Discussion
3.1. Density and Hardness
- The density and the hardness of the hybrid composites are listed in Table 2. It can be observed that the inclusion of the metal filler has contributed to improve the density and the hardness of the epoxy polymer. This is an expected behaviour that metal fillers being denser and harder will obviously improve the density and hardness of the base polymer.
|
3.2. Effect of Control Parameters on Friction and Wear
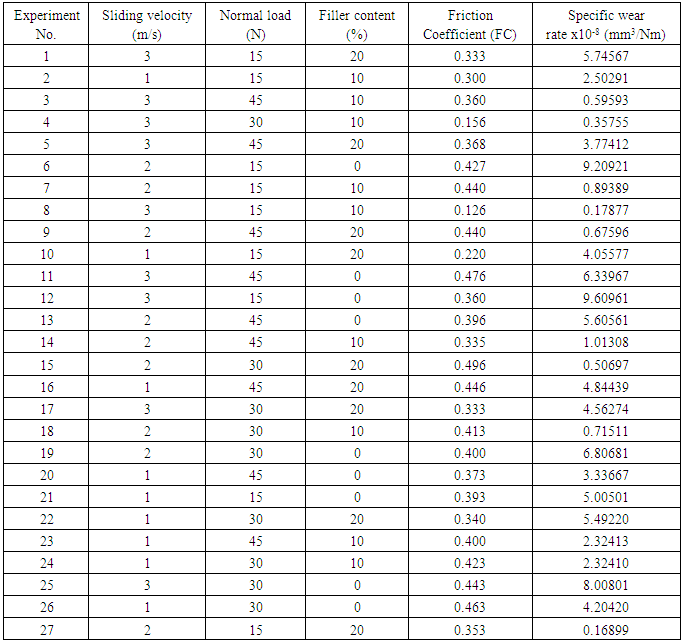
- The design matrix for three control factors each at three levels along with the results of the wear tests are presented in Table 3. The influence of each control factor on the wear behaviour can be analysed with the main effects plot and interaction plot. The best combination of the control factors to optimize the performance output can be easily evaluated from this plot. In the main effects plot, if the line for a particular parameter is nearly horizontal, the parameter has a little effect. A parameter for which the line has the highest inclination has a greater effect [21]. The main effects plot for the parameters affecting the friction is presented in Figure 1. It is clear from the plot that all the three control parameters have shown considerable influence on friction coefficient. The increase in the sliding velocity has shown increasing and decreasing trend in the friction coefficient, whereas metal filler content has shown decreasing and increasing trend. However, normal load is found to continuously increase the friction coefficient. The effect of control parameters on the friction is a complex phenomenon in polymer tribology and is governed by many factors acting simultaneously. The effect of sliding velocity on friction coefficient can be explained as follows. With the increase of the speed from 1 m/s to 2 m/s, material loss from the composite surface increases and this result in the increase of the abrasive force due to the presence of hard cast iron particles at the sliding interface. This contributes to increase the friction coefficient values. With the further increase of the velocity up to 3m/s, the plastic deformation of the epoxy matrix dominates and forms a thin transfer layer between the sliding materials. The metal fillers aid in the retention of the friction film for a longer time. This results in the easy shear during the sliding and reduces the friction. It is seen that increase in normal load has increased the friction coefficient. This may be due to more loads required to cause the shearing with the increase in normal load. It can also be noted from Figure 1 that metal fillers have reduced the friction coefficient values. The presence of metal fillers may reduce the real contact area during sliding and more such fillers may cause less area in contact between the tribo-couples and result in low friction values. From the main effects plot is clear that parameters A3B1C2 resulted in minimum friction coefficient. The two-way interaction plot for friction coefficient is presented in Figure 2. It is well understood that interactions do not occur when the lines on the interaction plots are parallel and strong interactions occur when the lines cross [21]. This plot shows that the interaction effect of sliding velocity and filler content is the highest followed by sliding velocity × normal load. Normal load and filler content has shown less interaction effects. The physical interpretation of these interactions is still a mystery.
|
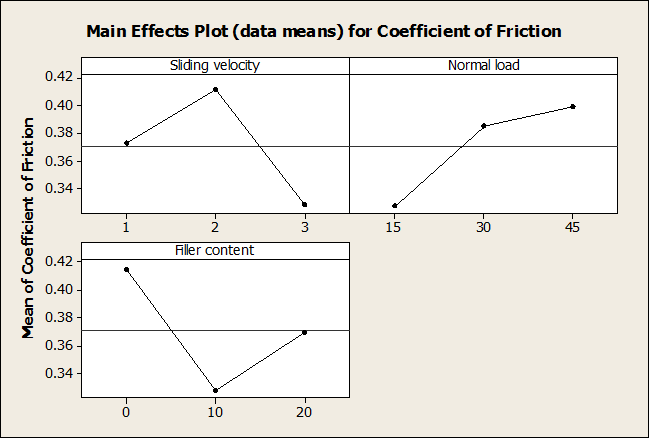 | Figure 1. Main effect plot for friction coefficient of test samples |
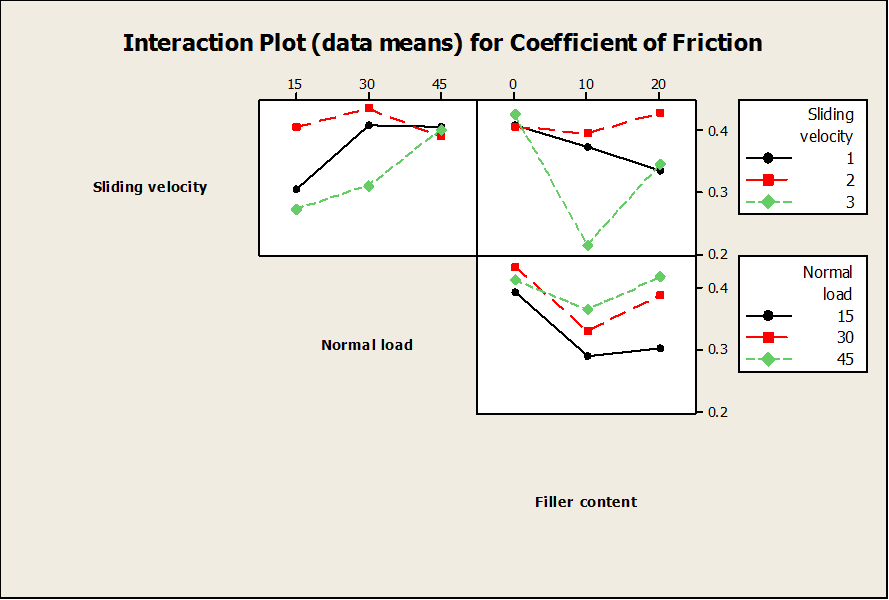 | Figure 2. Interaction plot for friction coefficient of test samples |
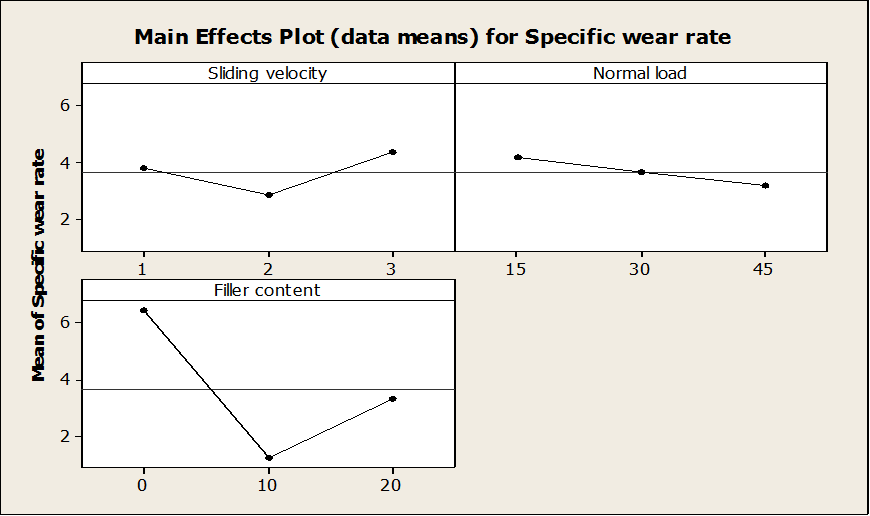 | Figure 3. Main effect plot for wear rate of test samples |
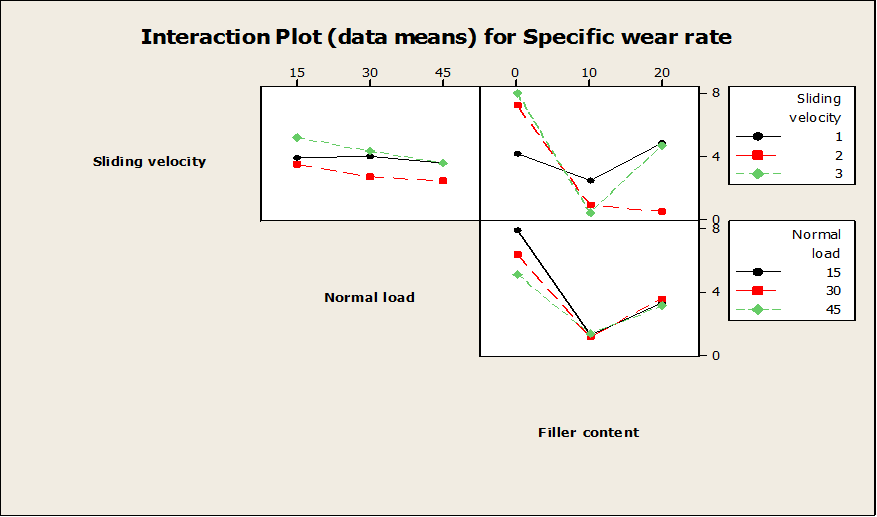 | Figure 4. Interaction plot for wear rate of test samples |
3.3. Analysis of Variance (ANOVA)
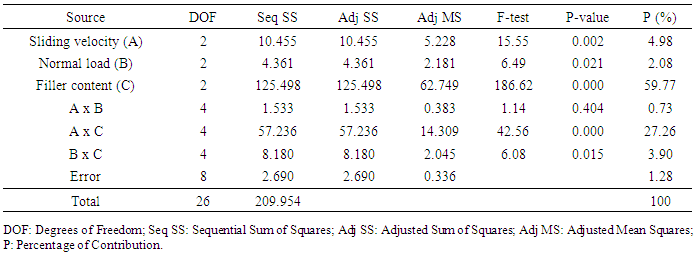
- Table 4 indicates ANOVA table for friction coefficient of test samples. The last column in Table 4 shows the percentage of contribution of each parameter and their interactions. It can be observed that filler content (P =16.36%), sliding velocity (P =15.03%) and normal load (P = 12.49%) are the factors that control frictional behavior of test samples. The interaction between the velocity and filler content (P = 21.99%) is the predominant interaction model term, and other interaction models are comparatively less significant, and the error contribution in the ANOVA for friction coefficient is 18.25%. The error in the Table 4 is considerable and this kind of errors is common during the statistical analysis of friction phenomena in case of composites. It is clear that sliding velocity and filler content as individual factors and also their interactions are the predominant factors that control the friction coefficient of the test samples.
|
|
4. Conclusions
- The present work includes details of extensive study on tribological performance of metal particulate filled epoxy composites. Following are the important observations from the study.1. The addition of recycled cast iron powder to epoxy has considerably exaggerated the properties of epoxy polymer. Density and hardness of epoxy was found to increase appreciably with the addition of metal filler. It was also observed that filler content greatly influenced the friction and wear behavior of epoxy polymer under dry sliding conditions. 2. ANOVA results indicated that metal filler content is the major contributing factor controlling the friction and wear performance of thermoset epoxy.From the full factorial analysis, it can be can be concluded that the metal fillers such as recycled cast iron powders can be used as a tribological additive to thermoset polymers such as epoxy to produce low cost composites.
 Abstract
 Reference
 Full-Text PDF
 Full-text HTML

