Mahesha N. S., Hanumantharaya R., Mahesh B. Davanageri, Ramakrishna Devananda P., Shivakumar K. M.
Department of Mechanical Engineering, Sahyadri College of Engineering and Management Adyar, Mangalore, India
Correspondence to: Hanumantharaya R., Department of Mechanical Engineering, Sahyadri College of Engineering and Management Adyar, Mangalore, India.
| Email: |  |
Copyright © 2016 Scientific & Academic Publishing. All Rights Reserved.
This work is licensed under the Creative Commons Attribution International License (CC BY).
http://creativecommons.org/licenses/by/4.0/

Abstract
The aim of this present work is to investigate the dry sliding wear behavior of 17-4 PH stainless steel or AISI 630 hardened by precipitation hardening. The sliding wear tests were conducted with the use of a pin-on-disc tribometer by considering three factors viz., normal load (20N, 40N and 60N), sliding distances (400m, 600m and 800 m) and sliding velocity (3, 5 and 7 m/s). The analysis of wear volume loss and specific wear rate has been defined by the Taguchi methodology and analysis of variance using statistical software MINITAB 15. Signal to noise ratio shows that, among the factors the load is the most significant factor that affects wear volume loss and specific wear rate.
Keywords:
Wear, Precipitation hardening, Volume loss, Wear resistance
Cite this paper: Mahesha N. S., Hanumantharaya R., Mahesh B. Davanageri, Ramakrishna Devananda P., Shivakumar K. M., Tribological Wear Behavior of AISI 630 (17-4 PH) Stainless Steel Hardened by Precipitation Hardening, American Journal of Materials Science, Vol. 6 No. 4A, 2016, pp. 6-14. doi: 10.5923/c.materials.201601.02.
1. Introduction
Steel is an important engineering alloy that is extensively used in various industries owing to its superior mechanical properties. It is an alloy of iron along with the other elements, primarily carbon. The addition of alloying elements enhances the properties of steel. Further the mechanical properties viz., hardness, tensile strength and ductility greatly depend on the amount of alloying elements. Steels come in variety of forms which includes PH Steels. The 17-4 PH stainless steels is a martensite stainless steel that finds extensive application in many industries owing to excellent properties that include corrosion resistance, excellent weldability, high strength [1, 2]. The good heat treatment characteristic of PH steels makes it one of the most indispensable materials used by the designers that increase the accuracy of the products during fabrication thus reduces the fabrication costs to a great extent.The performance of a material depends on several parameters. Wear is one critical parameter that has been studied extensively. Wear refers to the gradual removal of particles from the contacting surface due to the relative motion [3]. The affect of wear depends on several factors viz., condition of contact between surface, contact temperature, pressure, frictional force and hardness of the material. Several works have been done to study the wear behavior and to optimize the process parameters using Taguchi method [4-11]. In the present work an attempt is made in understanding the wear behavior of 17-4 PH stainless steel by conducting wear tests using pin on disc tester and the experimental plan were prepared by Taguchi orthogonal array.
2. Materials and Experimental Work
2.1. Material and Specimen Preparation
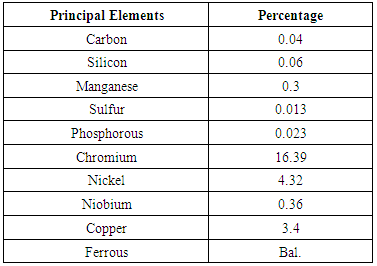
The chemical composition of commercially available 17-4 PH steel used for the present work is shown in Table 1.Table 1. Chemical composition of 17-4 PH stainless steel [12]
 |
| |
|
The specimens of size ϕ12×30 mm were prepared to conduct the wear test. Further the specimen was faced using lathe machine which was followed by grinding.
2.2. Design of Experiment
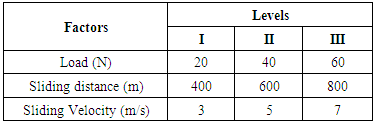
DOE is an experimental methodology in which influence of multiple factors are studied by conducting tests at different levels of the factor. The factor is a variable or parameter that affects the wear. Levels of factors are the descriptions that characterize the state of the factor held during running of the tests [13]. The wear tests are completed under working conditions as specified in the Table 2.Table 2. Operating conditions
 |
| |
|
In this current study the L27 array design is utilized as the experimental design. The test observations were converted into signal to noise ratio (S/N ratio).
3. Experimental Procedure
The two body wear behavior of the 17-4 PH stainless steel, was conducted by the pin on disc test apparatus as shown in Fig 1. The tests were carried in a track diameter of 100 mm. Appropriate values of load, sliding velocity and sliding distance were selected. The surface of the test sample of diameter 12 mm and length 30 mm makes contact with the counter surface. In the present experimentation, single pan electronic weighing machine was used to ascertain the initial weight of the test specimen. The least count of the weighing machine was 0.0001gm. The experiment was conceived by forcing the pin against the counterpart rotating disc by the application of load. The tested sample was cleaned with acetone, and further dried. The difference in the weight of the sample is obtained before the test and weight at the end of the test was indicated in determining the weight loss. Further the volume loss and specific wear rate was determined using specific wear rate equation.The wear was determined by the weight loss following which the volume loss was calculated. The specific wear rate was determined by using the following equation: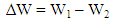 | (1) |
Where ∆W is the weight loss of the specimen.W1 is the initial weight of the specimen.W2 is the final weight of the specimen.Volume loss of the specimen is calculated in the following manner ks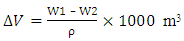 | (2) |
Where ∆V is volume loss of the specimenρ is the density of the specimenThe specific wear rate is obtained by the following equation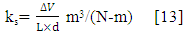 | (3) |
Where, d is the sliding distance, L is the normal load.
4. Results and Discussions
4.1. Taguchi Analysis of Volume Loss
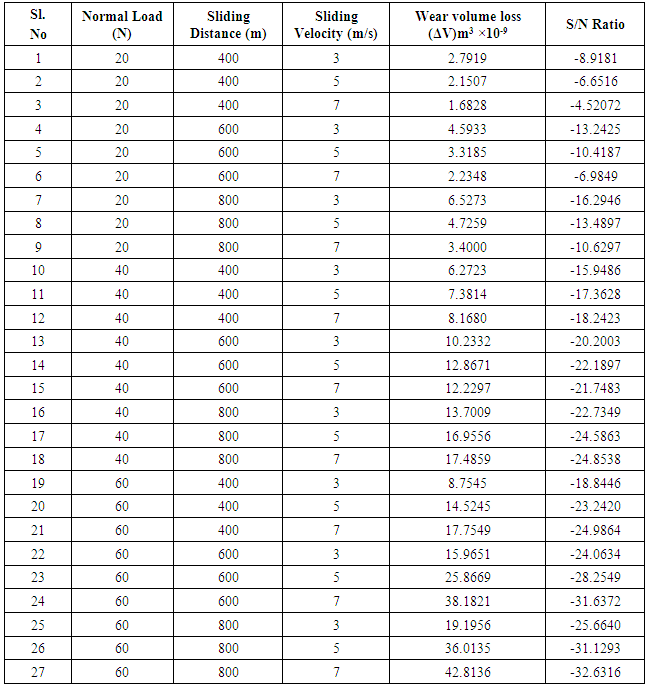
In the present investigation, the experimental wear test results were investigated by using Taguchi’s design of experiment method. Further the effect of various process parameters on the wear volume loss was studied by analysis of variance (ANOVA). The analysis is done using MINITAB 15. The test results are tabulated in the Table 3.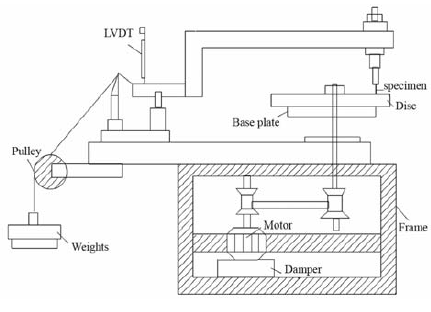 | Figure 1. Set up of pin-on-disc wear tester machine [14] |
Table 3. Taguchi set of experiments for 17-4 PH stainless steel using L27 array
 |
| |
|
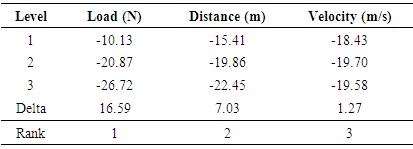
The objective of the experimental arrangement is to ascertain the necessary factors in addition to the factors affecting the wear process that results in minimum wear rate. The investigations have been developed taking into account orthogonal array, with the objective of relating the affect of normal load, sliding distance and sliding velocity.The effect of factors such as normal load, sliding distance and sliding velocity have been analyzed. Further the rank of individual factors such as load, sliding distance and velocity on wear volume loss was studied. Wear volume loss supports S/N ratio response as shown in Table 4. Table 4. Response for Signal to Noise Ratio - Smaller is better
 |
| |
|
From table 4, it is evident that the load is the most significant factor that affects the wear volume loss with delta value 16.59 followed by the sliding distance having delta value of 7.03. Further the velocity is the least significant factor with 1.27 delta value.Main effect plots for means and S/N ratioThe Fig.2 and Fig 3 shows the main effect plot for mean and SN ratio. Horizontal line indicates the absence of main effect. The Fig. 2 and Fig 3 indicates that the combination of load, sliding distance and sliding velocity of 20N, 400m and 3m/s respectively results in minimum wear loss.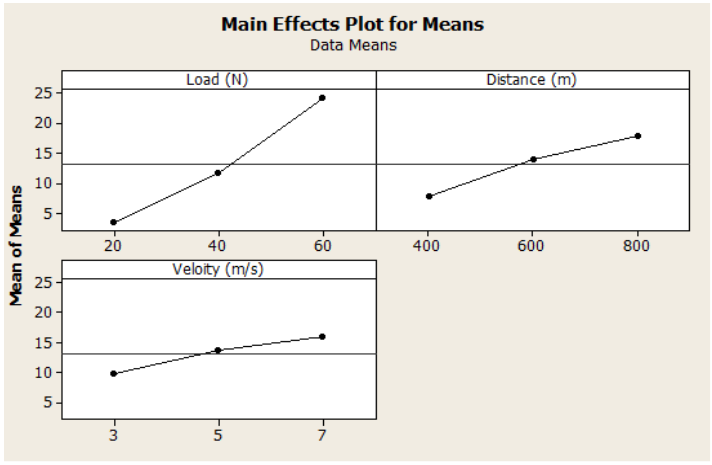 | Figure 2. Main effects plot for means |
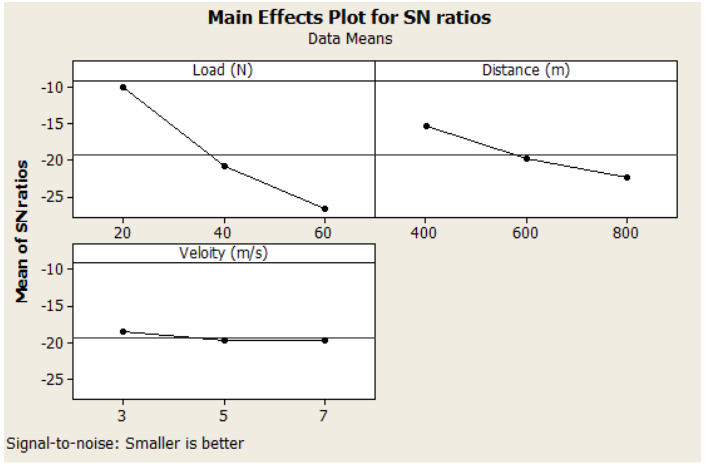 | Figure 3. Main effects plot for SN ratios |
It is evident from the Fig. 4 that at constant load, the increase in the sliding distance leads to the increase in wear volume loss. This may be attributed to the generation of heat. At 20N loading, heating up of the material increases as the sliding distance increases. Similar pattern is observed at 40N loading. Further it was observed that at 60N loading, high amount of heat is generated due to the influence of high frictional force on the pin and disc.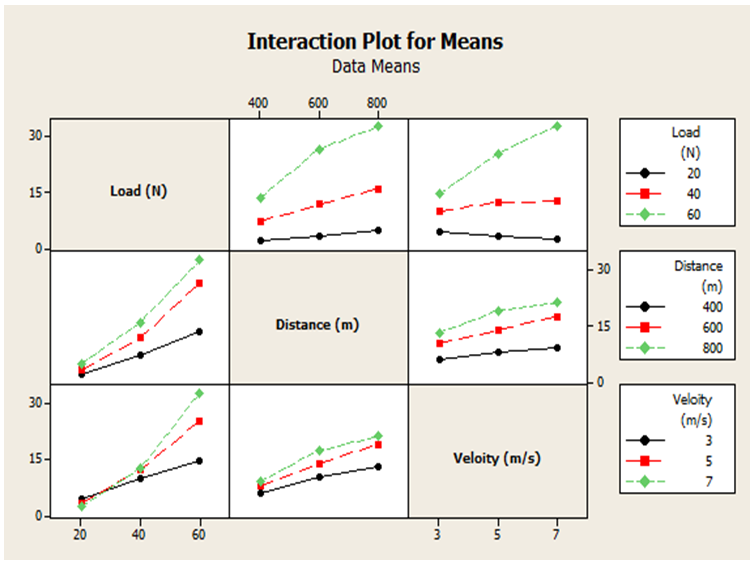 | Figure 4. Interaction plot for means |
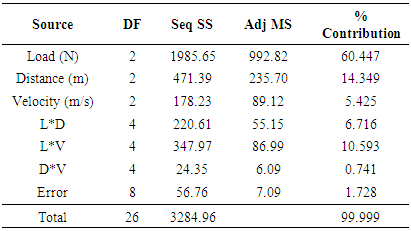
In the case of constant load of 20 N and by varying velocity from 3 m/s to 5 m/s, negative slope is observed. Variation of velocity from 5 m/s to 7 m/s shows similar results. Further at 60N constant load coupled with the increase in the sliding velocity result in the increased wear volume loss.When distance is constant and load is varying, gradual increment in the wear volume loss is observed for 400m sliding distance. For 600 m sliding distance, wear volume loss increases gradually as the load raises from 20N to 40N and as the load increases from 40N to 60N, immediate increment in the positive slope of volume loss is obtained. Similar effect is obtained for 800m sliding distance.In the case of constant distance and varying velocity, at 400m sliding distance, a slight increase in the positive slope of wear volume loss is obtained and this is due to the less contact period of pin and disc. Further for sliding distance of 600m and 800m, any increment in the sliding velocity results in the increase of wear volume owing to the increased amount of heat generated at the pin and disc interface.For constant sliding velocity and varying load, for 3 m/s velocity wear volume loss increases gradually as the load is increased from 20N to 40N and this increment continues with increase in the load because of the formation of frictional forces. A gradual linear increment in the wear volume loss is obtained with the increase in the load for a velocity of 5 m/s. However in the case of 7m/s velocity, initially a small increment in the wear volume loss is observed as the load is increased from 20N to 40N and an abrupt raise in the positive slope of wear volume loss is observed for the increase in the load from 40N to 60N.Similar specific wear rate effect is observed for constant sliding velocity and by varying sliding distance from 400m to 800m. Due to the increase in the period of contact between the pin and disc, the increase in sliding distance results in increase of wear volume loss.Analysis of varianceThe influence of different factors on the wear volume loss of 17-4 PH stainless steel material was determined by ANOVA. Table 5 demonstrates the outcomes of the analysis of variance (ANOVA) with the wear volume loss of 17-4 PH stainless steel test specimen.From the table 5, it can be observed that the load is the most significant factor with the statistical effect of 60.447% followed by the sliding distance of 14.349%. It is also evident that the statistical effect of sliding velocity is about 5.425%. In the case of interaction terms, interaction between the Load (N) and sliding velocity (m/s) shows the significant effect (10.593%) on wear volume loss followed by the interaction between the load and the sliding distance (6.716%). Interactions of other factors are below the confidence level (S=0.05). It is also evident from the table that the error is significantly low with a contribution of 1.728%. Signal to Noise ratio and ANOVA indicates that Normal load has the maximum affect on the wear volume loss followed by the sliding distance and sliding velocity.Table 5. Analysis of Variance for volume loss (10¯⁹m³)
 |
| |
|
4.2. Taguchi Analysis of Specific Wear Rate
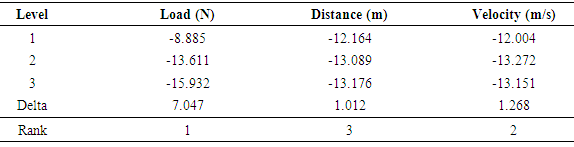
Table 7 infers that the load is the significant factor that affects specific wear rate vis-à-vis sliding distance and sliding velocity with sliding distance affecting the least.Main effect plots for Mean and S/N ratiosFig. 5 and Fig 6 shows that a combination of load, sliding distance and sliding velocity of values 20N, 400m and 3m/s respectively yield the minimum wear loss.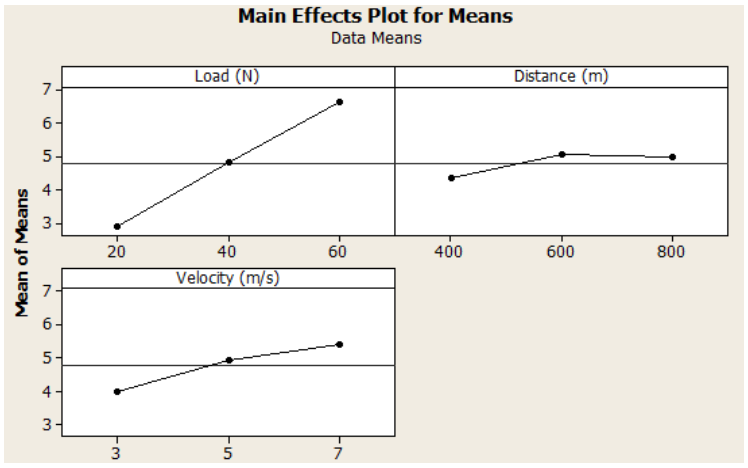 | Figure 5. Main effects plot for means |
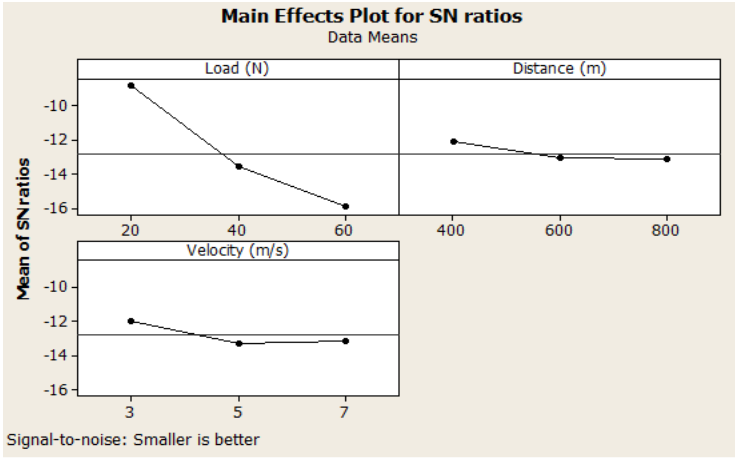 | Figure 6. Main effects plot for SN ratios |
Figure 7 indicates that, at constant load, the specific wear rate at 20N and 40N load increases slightly with increase in the sliding distance from 400m to 600m and from 600m to 800m due to the generation of heat by the more contact period between the pin and disc. Further at 60N load, significant amount of heat is generated between the interface as the distance increases from 400m to 600m owing to the influence of high frictional force which in turn results in specific wear rate compared to 20N and 40N load. As the distance increases from 600m to 800m, specific wear rate slope decreases as this may be due to formation of burr at the pin and disc interface.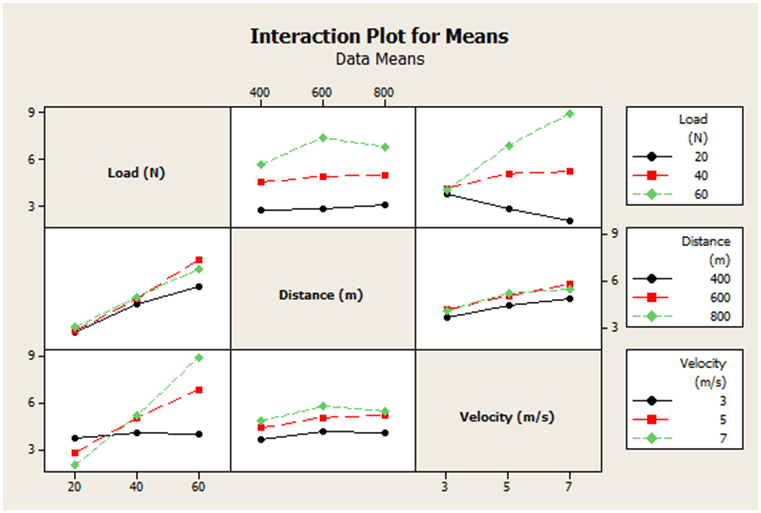 | Figure 7. Interaction plot for means |
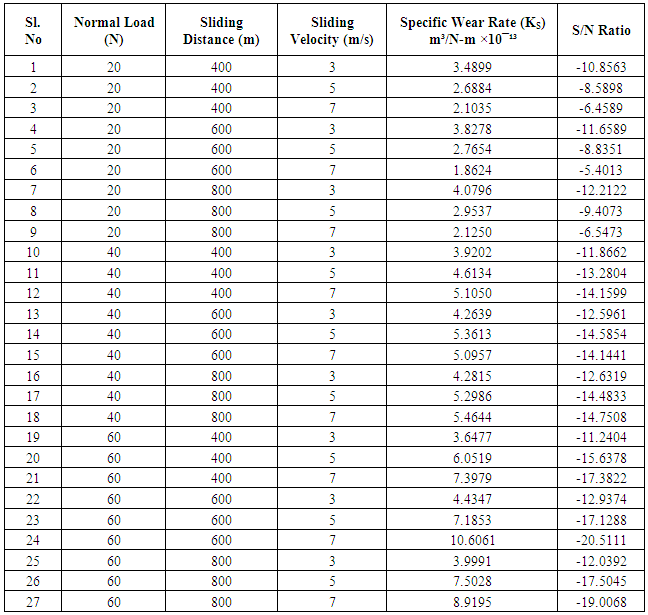
In the case of constant loading and varying velocity, at 20N load, with gradually increasing velocity from 3 m/s to 5 m/s, negative slope is observed and is due to the formation of burr at the end of the material. Similar effect is also observed when the velocity is further increased from value of about 5 m/s to 7 m/s. Similarly at 40N load, wear volume loss increases with increase in the velocity from 3 m/s to 5 m/s, further slight increase in the wear volume loss is observed as the velocity increases from 5 m/s to 7 m/s. Similar trend was observed with increased loading.Gradual increase in the specific wear rate was observed with constant distance and varying load. This increase in the wear continues for further constant distance of 600 m and 800 m.For constant distance and varying velocity and at sliding distance of 400 m, a slight increase in the positive slope of specific wear rate is obtained and this is due to the less contact period of pin and disc. Further for 600 m and 800 m sliding distance, the increase in sliding velocity results in increase of wear volume due to the increase in the generation of heat at the pin and disc interface.Table 6. Taguchi set of experiments for 17-4 PH stainless steel using L27 array
 |
| |
|
Table 7. Response for Signal to Noise Ratio - Smaller is better
 |
| |
|
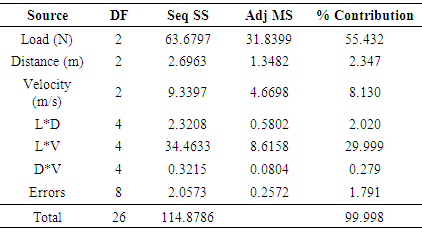
For constant velocity and varying load, at sliding velocity of 3 m/s, the specific wear rate takes small linear increment in the positive slope with the increment in the load due to the generation of small frictional forces. At 5 m/s sliding velocity, a sharp rise in the rate of wear is identified with the increase in the load due to the increased frictional forces. This effect is much more severe at sliding velocity of 7 m/s.Analysis of varianceFrom the table 8, it can be concluded that for dry sliding wear of 17-4 PH stainless steel, the load is the most significant factor with the statistical effect of 55.432% followed by the sliding velocity of 8.130%. It is also evident that the statistical effect of sliding distance is about 2.347. In the case of interaction terms, interaction between the Load (N) and sliding velocity (m/s) shows the significant effect (29.999%) on the specific wear rate. Interactions of other factors are below the confidence level (S=0.05). The error is low, having only 1.791% contributions. Signal to Noise ratio and ANOVA indicates that Normal load has the maximum contribution on specific wear rate followed by the sliding distance and sliding velocity.Table 8. Analysis of Variance for Specific Wear Rate (10-¹³m³/N-m)
 |
| |
|
5. Conclusions
Following conclusions have been drawn from the experimental and statistical analysis for the dry sliding abrasive wear test on 17-4 PH stainless steel material:1. Dry sliding wear behaviour of the 17-4 PH stainless steel under different loads, sliding distance and sliding velocity have been successfully analysed by using Taguchi design of experiment.2. Smaller the better S/N ratio has been selected, since wear rate has to be reduced in the material. From the S/N ratio response for wear volume loss it is observed that, the load most significant factor that affects the wear volume loss with delta value (16.59) followed by the sliding distance (7.03) and sliding velocity is the least significant factor (1.27).3. From the S/N ratio response for specific wear rate it can be inferred that, the load is most significant factor that affects the specific wear rate followed by the sliding velocity and sliding distance is the least significant factor.4. From the main effect plot for mean and S/N ratio, it can be concluded that the combination of load, sliding distance and sliding velocity of values 20N, 400m and 3m/s respectively yield the minimum wear loss.5. The ANOVA analysis for wear volume loss indicates that load has the maximum percentage contribution (60.447%) followed by the sliding distance (14.339%). Also interaction between load and sliding velocity shows maximum contribution on wear volume loss (10.593%). 6. The ANOVA analysis for specific wear rate indicates that load has the maximum contribution (55.432%) followed by the sliding velocity (8.130%). Also interaction between load and sliding velocity shows maximum contribution on specific wear rate (29.999%).
References
| [1] | J.D. Bressan, D.P. Daros, A. Sokolowski, R.A. Mesquita, C.A. Barbosa, “Influence of hardness on the wear resistance of 17-4 PH stainless steel evaluated by the pin-on-disc testing” journal of materials processing technology, 205 (2008); 353–359. |
| [2] | C.N. Hsiao, C.S. chiou, J.R Yang “Aging reactions in a 17-4 PH Stainless steel” Materials Chemistry and Physics 74 (2002) pp. 134-142. |
| [3] | Jack A. Collins, “Failure of Materials in Mechanical design” Analysis Prediction Prevention Second edition, A Wiley- Interscience Publication. |
| [4] | Dr.Yadavalli Basavaraj, Pavan Kumar B. K, Purushotham B C, “Analysis of wear behaviour of dual phase steel using taguchi method” International Journal of Engineering Research and Reviews, 2015; Vol. 3, No. 3; pp: (84-89). |
| [5] | Vikas Kamboj, Mr. Brij Bhushan, Mr. Kuldeep Kumar, “Optiomization of process parameters and study of wear during hard facing of mild steel using Taguchi method” International Journal of Engineering Sciences & Research Technology, march 2015. |
| [6] | Y. Sahin, “Optimal testing parameters on the wear behaviour of various steels” Materials and Design 27, 2006; pp. 455–460. |
| [7] | D. Philip Selvaraj, P. Chandramohan, “Optimization of surface roughness of AISI 304 austenitic stainless steel in dry turning operation using Taguchi design method” Journal of Engineering Science and Technology, 2010; Vol. 5, No. 3; pp. 293 – 301. |
| [8] | Ganpat B. Jambukar, Dr. Y. R. Kharde, “Dry Sliding Wear Behaviour of Al-Si-Ti Alloys Using Taguchi Method” International Journal of Science and Research (IJSR), November 2014; Vol. 3, No. 11. |
| [9] | Hanumantharaya R, Vikas G, Prem Kumar B G, Ramakrishna Devananada P, “Taguchi approach for the dry sliding wear behavior of granite and flyash filled glass epoxy composites” International Journal of Advanced Technology in Engineering and Science, March 2015; Vol. 03, No. 01. |
| [10] | T R Hemanth Kumar, R P Swamy & T K Khandrashekar, “An experimental investigation on wear parameters of metal matrix composites using Taguchi technique” Indian Journal of Engineering & Material Sciences, August 2013; Vol. 20, pp. 329-333. |
| [11] | Hanumantharaya R, Ananda Kumar K M, Prem Kumar B G, Vikas G, Ashok Kumar G P, ‘Friction and Dry Sliding Wear Behaviour of Granite - Fly Ash Filled Glass Epoxy Composites” International Journal of Innovative Research in Science, Engineering and Technology, 2007; Vol. 3, No. 7. |
| [12] | Wang Jun, Zou Hong, Wu Xiao-yong, Li Cong, Qiu Shao-yu and Shen Bao-luo, “The Effect of Long-Term Isothermal Aging on Dynamic Fracture Toughnessof Type 17-4 PH SS at 350°C” Materials Transactions, 2005; Vol. 46, No. 4, pp. 846-851. |
| [13] | Pavitra Ajagol, Hanumantharaya R, S. S. Balakrishna, Prem Kumar B. G, “Taguchi Approach for Characterization of Three-Body Abrasive Wear Behavior of Granite Epoxy Composite with and Withooput SiC Filler” The International Journal Of Science & Technoledge, September 2014; Vol. 2, No. 9. |
| [14] | Hemanth Kumar.T.R, Swamy. R.P and Chandrashekar T.K, “Taguchi Technique for the Simultaneous Optimization of Tribological Parameters in Metal Matrix Composite” Journal of Minerals & Materials Characterization & Engineering, 2011; Vol. 10, No.12; pp.1179-1188. |

 Abstract
 Reference
 Full-Text PDF
 Full-text HTML