-
Paper Information
- Next Paper
- Previous Paper
- Paper Submission
-
Journal Information
- About This Journal
- Editorial Board
- Current Issue
- Archive
- Author Guidelines
- Contact Us
American Journal of Materials Science
p-ISSN: 2162-9382 e-ISSN: 2162-8424
2015; 5(3C): 175-182
doi:10.5923/c.materials.201502.34
Effect of Accelerated Chemical Degradation on the Surface Roughness Parameters and Morphology of Fuel Cell Membranes
 Abstract
 Reference
 Full-Text PDF
 Full-text HTML
K. K. Poornesh 1, Chongdu Cho 2, Yongsug Tak 3
1Department of Mechanical Engineering, St Joseph Engineering College, Mangalore, India
2Department of Mechanical Engineering, Inha University, Incheon, South Korea
3Department of Chemical Engineering, Inha University, Incheon, South Korea
Correspondence to: K. K. Poornesh , Department of Mechanical Engineering, St Joseph Engineering College, Mangalore, India.
| Email: |  |
Copyright © 2015 Scientific & Academic Publishing. All Rights Reserved.
Nafion® membranes are proton conducting membranes that are widely used in fuel cells. This study investigates the surface roughness evolution and morphology change in the Nafion® 212 membrane (N212) subjected to two types of artificial degradation. Although some previous investigations have clearly observed the difference in morphological changes of the membrane subjected to different accelerated degradation techniques, very scant information available on the roughness parameters of the membrane. Given the rough surface nature of the catalyst layer (CL), information obtained from the present investigation can be helpful in understanding the interfacial stability of the membrane electrode assembly (MEA). We distinguish and compare the morphological changes in the membrane with the published observations and note that different accelerated degradation mechanisms lead to distinguished changes in the N212 morphology. Two chemical degradation techniques adopted here are – Ion exchange method and Solution method. Tapping mode - AFM (TM-AFM) and SEM is used in investigating the roughness parameters and surface morphology of the fresh as well as degraded N212.
Keywords: Accelerated degradation, Surface roughness, Solution method, Ion-Exchange method, Nafion® membrane, Tapping mode – AFM, Surface morphology
Cite this paper: K. K. Poornesh , Chongdu Cho , Yongsug Tak , Effect of Accelerated Chemical Degradation on the Surface Roughness Parameters and Morphology of Fuel Cell Membranes, American Journal of Materials Science, Vol. 5 No. 3C, 2015, pp. 175-182. doi: 10.5923/c.materials.201502.34.
Article Outline
1. Introduction
- Durability, stability, and reliability requirement of the PEM fuel cell layers are demanding innovative researches on the new materials, mostly MEA. MEA draws considerable interest among researchers, as it is vulnerable for damage and degradation under fuel cell working conditions [1-3]. Therefore, analyzing and understanding the root causes of performance decay or electro-chemical or mechanical degradation will give much justice in finding answers in terms of alternative materials as well as ideal stack design. Low temperature membranes used in PEM fuel cells are susceptible for electro-chemical or mechanical degradation and is generally unavoidable. And under fuel cell operating conditions membrane is subjected to severe durability issues that are compounded by mechanical and hygrothermal stresses, cracking and interfacial delaminations and are realized in the form of fuel cross over and water management problems. Hence, to shed a light on the fundamentals of membrane degradation, multi-disciplinary approaches and breakthroughs are needed and in the process, recently, many researchers have proposed various mechanisms that are mainly related to chemical [4-13] and mechanical [14-21] degradation.It has long been known that the chemical degradation lead to structural (chemical) as well as morphological changes in the membrane. Chemical degradation of membrane is understood to be due to hydroxyl radicals attack on the carboxylic end groups of nafion membrane. Literature has witnessed in following the artificial degradation procedures that induce same effect like what happens under real situation, but in a shorter amount of time, and is termed as accelerated degradation. There are two major accelerated chemical degradation methods, namely, solution method and ion exchange method. Although two of these methods claimed to induce same chemical changes, distinguished morphological features in the membrane can be observed. On a most important note, morphological changes in the degraded membrane not only differ for degradation mechanisms but also membrane type. For example, Kundu et al. [11] performed two of the above mentioned degradation methods on Nafion® 112 membrane (N112) and they observed significant differences in the degradation methods in terms of membrane’s morphological structure. Further, Fernandes and Ticianelli [12] performed ion exchange degradation on Nafion 112 and Nafion 212 and reported that N212 was subjected to severe morphological changes as opposed to N112. Interestingly, observable morphological changes on N212 induced by ion exchange method [12] were similar to the changes on N112 induced by solution method [11].Apart from the degradation methods on different membrane types, morphological changes in the degraded membrane require more explanations in terms of their influence on damage initiation and propagation in the membrane as well as near interfaces. Researchers have investigated nafion membrane in different forms and under different conditions (dry or humid) using AFM in order to recognize and differentiate the hydrophilic and hydrophobic domains [22-29]. Although several experimental results focused on nano-structural changes in the membrane, evolution of roughness parameters in the degraded membranes are not clear. This is because, artificial degradation, in general, leads to bubble or hole or damage evolution in the membrane surface which makes inadequate for AFM to probe under large scan dimension, that means, scanning ability entirely depends on how severe the membrane is degraded and again it depends on the membrane types and the degradation methods. There can be two simple observations drawn from literature outcomes. High-resolution AFM scan (refers to nm scan dimension) is generally used to observe the nano-structural changes in the membrane. While low resolution AFM scan (refers to µm scan dimension) of the membrane can be used to estimate the tribological parameters (here roughness) that can effectively be used to explain the effect of membrane degradation on the interface characteristics in future studies.
2. Experimental
- We perform chemical degradation technique using two of the generally known methods on N212 membrane in order to understand their effect on surface morphologies.
2.1. Solution Method
- This method is similar to the method proposed by Kundu et al. [11] and Healy et al. [13]. The solution method used 30% H2O2 mixed with FeCl2·4H2O to produce a 16 mg/L solution of Fe2+ ions. This solution (40 mL) was placed in a closed vial containing Nafion samples. The Nafion and solution were kept in 80°C oven for 24 h or 48 h or 72 h and the solution of peroxide and iron was replaced by fresh solution at every 12 h. After these times, the samples were removed from the solution, rinsed and saved for AFM or SEM investigation.
2.2. Ion Exchange Method
- This method is similar to the method proposed by Fernandes and E. A. Ticianelli [12] and Kinumoto et al. [30]. Samples of Nafion 212 were soaked in a saturated solution of FeCl2·4H2O for 24 h. The samples were then rinsed with highly purified water for at least 1 h. Next, they were left in vials to which 40 mL of hydrogen peroxide solution was added, for 24 h or 48 h or 72 h at a temperature of 80°C. After these times, the samples were removed from the solution, rinsed and then conditioned in 1 M H2SO4 to remove any residual iron and then the membrane was returned into the H+ form.
2.3. Tapping Mode AFM
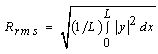
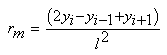
- Degraded membrane samples were subjected to TM-AFM (TM-AFM has an edge over contact AFM in that the pressure applied by the former is much lower and hence sample surface is less perturbated by the tip.) using Nanoscope IV Multimode scanning probe. Membrane samples (about 5×5mm) are mounted on microscope slides using epoxy, such that the glue does not seep out from underneath the membrane film. For the reasons mentioned in section 1, scan size dimension was chosen to be around 4×4µm. Roughness parameters investigated are defined as follows: (a) Mean roughness (Ra): It is defined as the average absolute deviation of the roughness irregularities from the mean line over one sampling length L as shown in Fig. 1(a). It is also referred as Centerline average (CLA). This parameter is insensitive to small changes in profile although it is easy to measure [31]. The mathematical definition of Ra is as follows:
 | (1) |
 | (2) |
 | (3) |
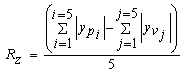 | (4) |
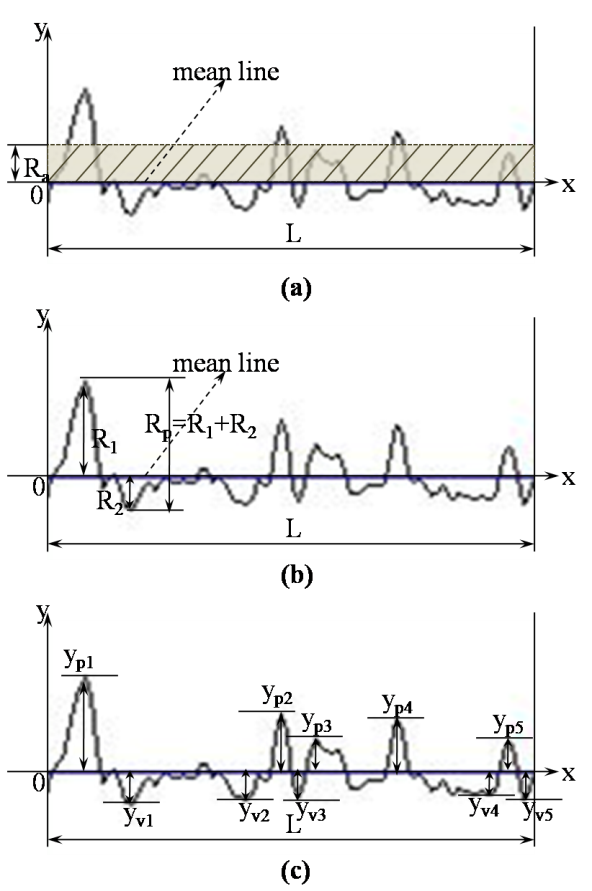 | Figure 1. (a) Definition of Mean roughness (Ra). (b) Definition of Maximum peak height (Rp). (c) Definition of Ten-point mean roughness (Rz) |
3. Results and Discussion
3.1. TM-AFM
- Fig. 2(a) shows the AFM image of fresh N212 membrane along with the sectional line analysis. On the right side of Fig. 2(a), small variations in the surface heights can be observed which corresponds to the actual surface morphology of the membrane characterized by nodular aggregates. For comparison purpose, images are taken at same scan dimension (4×4µm), although the nanostructure of membrane can be explored under high resolution (e.g. under 1×1µm). Contrary to this observation, Fig. 2(b) shows the surface image of degraded membrane (solution method for 24 h) with higher density of bright spots corresponding to the distribution density of asperity heights. Sectional analysis of the degraded sample (on the right side) indicates a remarkable increase in the roughness parameters as opposed to fresh membrane with RMS roughness value of 5.14 nm. Roughness parameters described in section 2.3 are estimated in Table 1 for fresh as well as degraded membranes (degraded by solution method). Further, degradation using solution method of membrane for 72 h results in an increased level of roughness with a RMS value 12.3 nm as plotted in Fig. 2(c). Further, 3-dimensional scan of fresh membrane as represented in Fig. 2(d) roughly shows the spherically shaped nodular aggregates, which is characteristic of molecular structure of the ionomeric materials [23]. (Although nodular aggregates claimed to induce surface roughness as investigated by Lehmani et al. [23], they are negligible at least in reference to the CL/membrane interface toughness instability). Since, many researchers have already made significant progress on this observation; it is not repeated here. Our interest is on Fig. 2(e) that shows the 3-dimensional evolution and distribution of asperity heights which covers the basic structure of the membrane and hence it is no more possible to observe nodular structure. This image corresponds to the 2-D surface scan as shown in Fig. 2(b). As the degradation time increases roughness also increases and is again evident from Fig. 2(f).
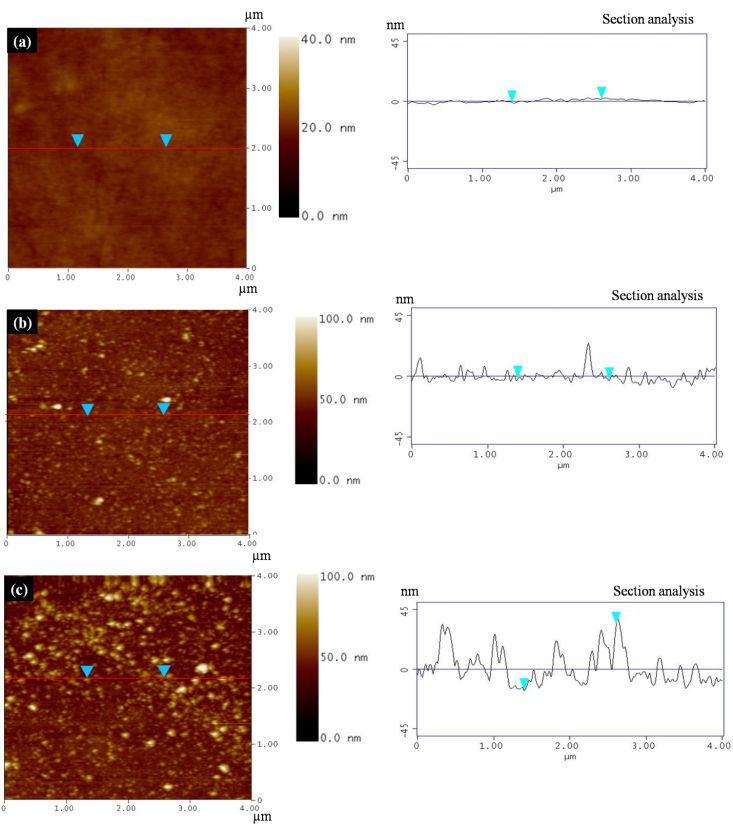 | Figure 2. TM-AFM sectional analysis on (a) Fresh N212 membrane. (b) Degraded membrane using solution method (exposure time – 24 h). (c) Degraded membrane using solution method (exposure time – 72 h) |
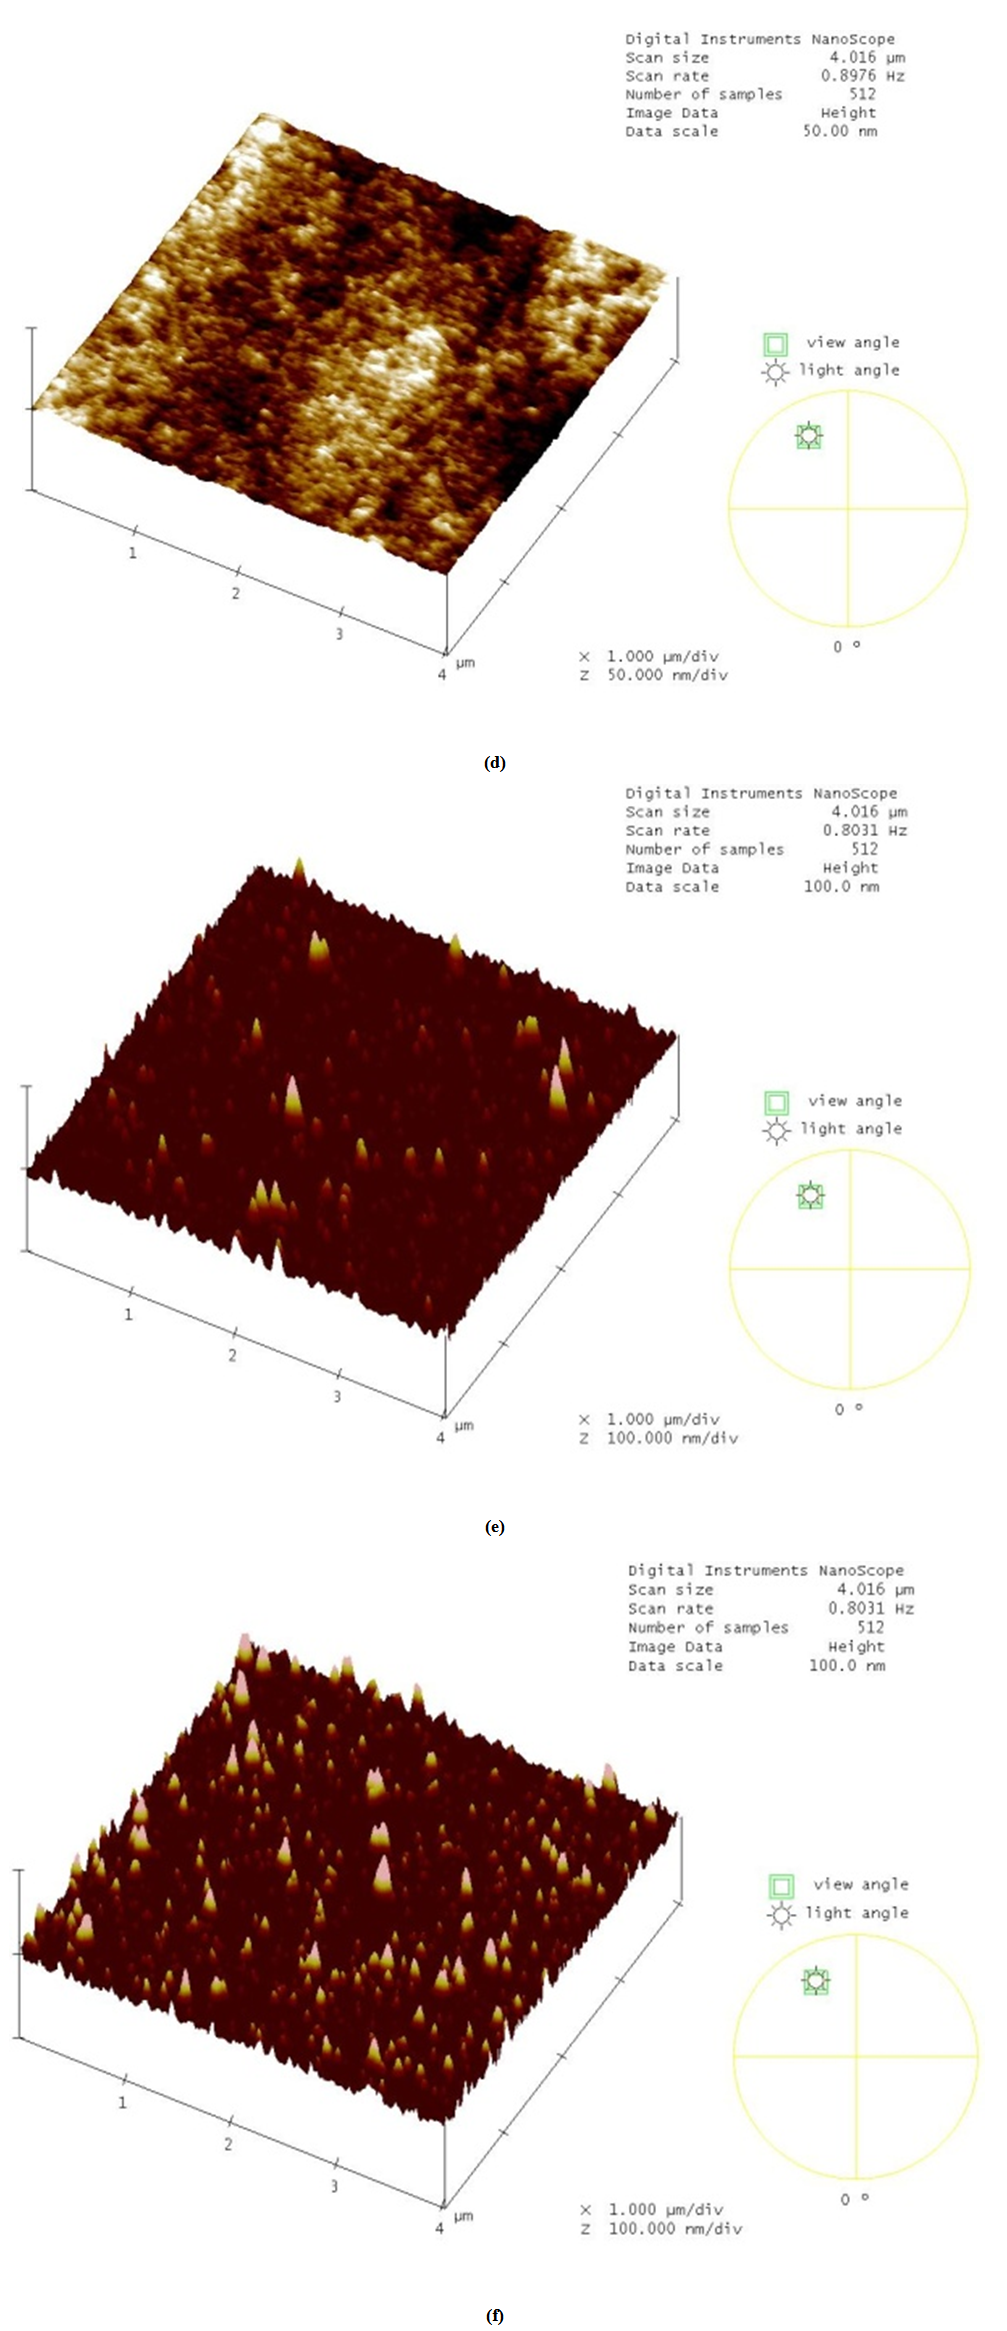 | Figure 2. TM-AFM 3-D scan of (d) Fresh N212 membrane. (e) Degraded membrane using solution method (exposure time – 24 h). (f) Degraded membrane using solution method (exposure time – 72 h) |
3.2. SEM
- Fig. 3(a) shows the SEM surface image of the membrane degraded by ion exchange method. Bubble formation and the circumferential tears around the bubbles are observed. It is noted that this observation on N212 membrane is similar to the findings of Fernades and Ticianelli [12] on N212 (ion exchange degradation) and Kundu et al. [11] on N112 (solution method of degradation). However, magnified image of Fig. 3(a) shows the nodular aggregates separated by a micro-crack as shown in Fig. 3(b). Further, as the exposure time increases, small bubbles transforms into larger ones followed by tears as well as tiny fractures as shown in Fig. 3(c) and (d). This is also marked by a bulging of a surface that can roughly be observed. This bulging of surface comes from the membrane bursting from the center, which is characterized by a centerline crack in the SEM cross section image as shown in Fig. 3(e).All these discussed observations are found to make a negative impact in accessing the roughness parameters by TM-AFM, nevertheless it highly indicates that damage induced by ion exchange method on N212 is severe than the solution method of degradation. This is further clarified in Fig. 3(f), where the membrane surface is characterized by very small particles that appear to have loosely distributed and this corresponds to high-density peaks explored by TM-AFM study (Figs. 2(e) and (f)). It is further noted that the magnification of Fig. 3(b) and Fig. 3(f) is same but surface appears to be different, indicating that the different degradation methods induces distinguished morphological results.Thus, revelation of damage evolution in a membrane in relation to the surface roughness is better understood by solution method of degradation on N212, while the mechanical damage propagation or mitigation in the membrane can be estimated by ion exchange method of degradation on N212. Moreover, such high-density evolution of nano-sized asperity peaks in the chemically degraded membrane are highly vulnerable to plastic deformation, which can trigger a damage accumulation and then propagation, which can then become catastrophic for interfacial toughness between the membrane and CL. On the other hand, observable valleys in the degraded membranes may play a crucial role in mass transport loss in the membrane. This is because, degradation of catalyst layer leads to the disintegration of its constituents, which subsequently settles into valleys of the membrane leading to valley clogging. This might become obstacle in smooth electro-chemical performance of membrane as it might affect the water or proton flux rates.
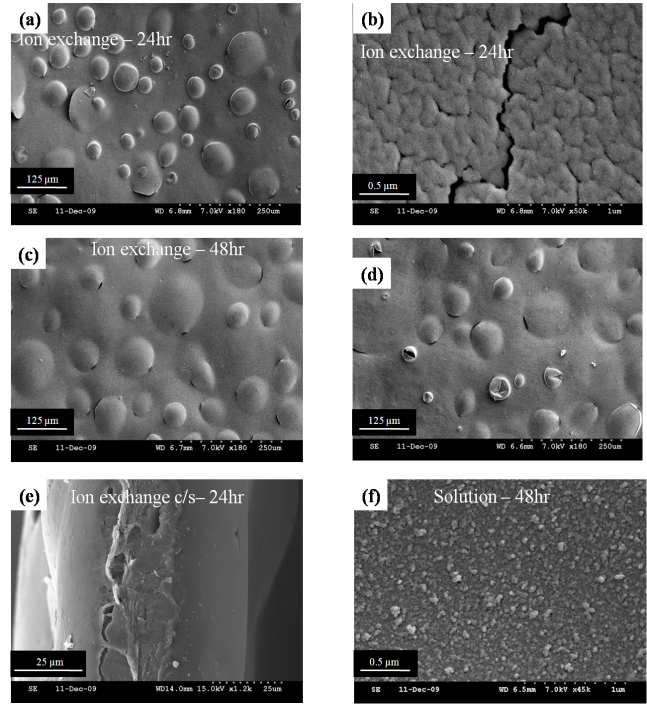 | Figure 3. SEM micrographs of N212 for (a) ion exchange degradation – 24 h. (b) enlarged image of (a) showing a micro-crack. (c) ion exchange degradation – 48 h. (d) ion exchange degradation – 72 h. (e) cross section of degraded membrane induced by ion exchange method – 48 h. (f) solution method of degradation – 24 h |
4. Conclusions
- This study investigates the surface roughness evolution and surface morphology of N212 membrane subjected to two types of artificial degradation techniques. Interestingly, solution method and ion exchange method of degradation results in distinguished surface morphology of the membrane. The membrane samples of N212 degraded by solution method is found to be useful in extracting the surface roughness parameters, while the samples degraded by ion exchange method can be useful in understanding the damage evolution and propagation in the membrane. This also means that solution method of degradation produces less severe damage than the ion exchange method on N212 and this contradicts the previous outcomes on N112 membranes [11]. Evolution of surface roughness parameters in the degraded membrane obtained from solution method marked by the evolution of asperity peaks and valleys can be used in predicting the interfacial toughness of membrane/CL interface, in the future study.
ACKNOWLEDGEMENTS
- This work is supported Inha University, South Korea and St. Joseph Engineering College, Mangalore, India.