Ravikantha Prabhu , Abishek K. Amin , Dhyanchandra
Dept. of Mechanical Engineering, St Joseph Engineering College, Mangaluru, India
Correspondence to: Ravikantha Prabhu , Dept. of Mechanical Engineering, St Joseph Engineering College, Mangaluru, India.
| Email: |  |
Copyright © 2015 Scientific & Academic Publishing. All Rights Reserved.
Abstract
This work is mainly focused on development and evaluation of physical, mechanical, tribological and hydrophilic behavior of epoxy based composites filled with different percentage of coconut fibers (CF 0-15% by wt in steps of 5% by wt). Composite panels were made by hand lay-up process and properties are tested as per ASTM standards. Density of the composites was found to increase and hardness found to decrease with the increase in percentage of coconut fiber. Tensile test revealed that the composite CF10% has the maximum strength and it was found to reduce as we increased the percentage of coconut fiber. Water absorption test reveal that, the minimum water absorption was observed for the composite CF5%. It is also found that with the increase of coconut fiber, the water absorption rate increases. Abrasive wear test revealed that, composite CF15% has the minimum wear loss. Dry sliding wear test reveals that for composite CF10% and CF15%, wear loss is found to reduce, but for CF20% composite the wear loss slightly increases and composite with CF15% has the minimum wear loss.
Keywords:
Coconut Fiber, Epoxy, Mechanical Properties, Wear Loss
Cite this paper: Ravikantha Prabhu , Abishek K. Amin , Dhyanchandra , Development and Charaterization of Low Cost Polymer Composites from Coconut Coir, American Journal of Materials Science, Vol. 5 No. 3C, 2015, pp. 62-68. doi: 10.5923/c.materials.201502.13.
1. Introduction
Polymer resins are one of the most important classes of thermosetting polymers which are widely used as matrices for fiber-reinforced composite materials and as structural adhesives. They are amorphous, highly cross-linked polymers and this structure results in these materials possessing various desirable properties such as high tensile strength and modulus, uncomplicated processing, good thermal and chemical resistance, and dimensional stability. However, it also leads to low toughness and poor crack resistance, which should be upgraded before they can be considered for many end-use applications, one of the most successful methods of improving the toughness of polymers. Resin is to incorporate a second phase of dispersed rubbery particles into the cross-linked polymer.Using natural fillers to reinforce the composite materials offers the following benefits in comparison with mineral fillers strong and rigid, light weight, environmental friendly, economical, renewable and abundant resource. On the other hand, the disadvantages of the materials are degradation by moisture, poor surface adhesion to hydrophobic polymers, non-uniform filler sizes, not suitable for high temperature application, susceptibility to fungal and insect attack Various works on the application of natural fillers and fibers in composites like pineapple, sisal, coconut coir, jute, palm, cotton, rice husk, bamboo, and wood as the reinforcements in composites have been reported in the literature. Sisal fiber is fairly coarse and inflexible. It has good strength, durability, ability to stretch, affinity for certain dye stuffs, and resistance to deterioration in seawater. Sisal ropes and twines are widely used for marine, agricultural, shipping, and general industrial use.
2. Materials and Methods
2.1. Materials
Epoxy resins are the major composite material for low-temperature application [usually under 2000F (93ºc)] and generally provide outstanding chemical resistance, superior adhesion to fibers and superior dimensional stability. Epoxy can be formulated to a wide range of viscosities for different fabrication processes and cure schedules. They are free from void forming volatiles, have long shelf lives and provide relatively low cure shrinkage. Araldite LY556 is the epoxy resin that was used for the processing of the composite in the presence study. Its density is around 1.15 to 1.20g/cc with viscosity between 10000-12000MPa-s at 25°C. The hardener used for the LY556 epoxy resin was Ardur HY951 with a boiling point greater than 200°C and a density of 1g/cc at 20°C. The epoxy resin and hardener were purchased from a local supplier in Bangalore.
2.2. Fabrication of Composites
The hybrid composites with different percentage of coconut fibers were fabricated by hand lay-up process. The essential steps in the process involve chemical treatment of fibre, hand layup, rolling and curing. The composite laminate has a size of 300x300x3 mm. First the coconut fibers are removed from the outer cover of coconut. Then the impurities and dust particles are removed and the coconut fibers are cleaned. Then the coconut fibers are soaked in water for a day, the next day chemical treatment is done by soaking the coconut fibers with NaOH (Sodium hydroxide) for 24hours. Then the fibers are washed with water and again chemically treated i.e. fibers are soaked with CH3COOH (Acetic acid) for 24 hours and again washed with water. Then the fibers are kept for drying. Once the fibers are dried it is cut to the required length. Initially the mold box has to be cleaned to remove the dust particles and other particles. Then upon the plastic sheet is fixed in order to obtain better surface finish. Upon plastic sheet a thin layer of Wilson wax should be applied using a brush. This layer prevents the sticking of the composite to the plastic sheet during curing; hence the composite can be removed easily from the mold cavity. Then the required percentage of coconut fiber, epoxy and hardener are found out. The required amount of epoxy and hardener is measured using a measuring jar. Then pour the measured epoxy resin into a mug and stir well for some time and then add the measured quantity of coconut fiber. Stir well till all fibers are immersed with the resin. Then proportionate hardener is added into that mixture, stir well again until all the resin and hardener are spread uniformly on the coconut fibers. Then the mixture is added to the mould box. The fibers are spread by using hand rollers. Once the fibers are spread uniformly in the mould box, it’s kept for curing. Once curing is done the composite is separated from the mould box. Once it is properly cured then the specimen is ready for further testing.
2.3. Preparation of Samples for Testing
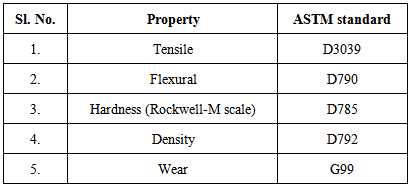
Once the composite material is prepared, next important step is to cut them into test samples of sizes according to ASTM standards. Cutting was carried out using high speed cutter and 24TPI hacksaw blade. Five samples of each type were cut and prepared for the test. The list of ASTM standards used is mentioned in Table 1.Table 1. Sizes of Specimens as Per ASTM Standards
 |
| |
|
2.4. Physical Characterization of the Composites
Density: The densities of composites were measured by the displacement method based on Archimedes’s principle. In this method distilled water was taken in the measuring jar having graduations in milliliters and the initial level of water was noted. Then each of the samples was weighed using an electronic balance of AY220 type (Shimadzu Corporation, Japan with 0.1mg accuracy). The weighed samples were then dropped into the water in the measuring jar. This resulted in rise of water level in the jar. The final level of water was noted and the difference in the final and initial readings gave the volume of water displaced. The volume of water displaced was equal to the volume of the sample dropped into it. The ratio of the weight of the sample to its volume as obtained by the above procedure yielded the density of the composites.
2.5. Mechanical Characterization of Composites
2.5.1. Hardness
Hardness of a material is defined as the resistance to deformation, particularly permanent deformation, indentation or scratching. The hardness of the different composite specimens was determined on a Rockwell Hardness testing machine using M-scale.
2.5.2. Tensile Test
Tensile tests were conducted using universal testing machine with across head speed of 5mm/min. In each case, five samples were tested and average value tabulated. Tensile test samples were cut as per ASTM D3039 test procedure. Tests were carried out at room temperature and each test was performed until tensile failure occurred.
2.5.3. Flexural Strength Test
Flexural analysis was carried out at room temperature through three-point bend testing as specified in ASTM D 790, using universal testing machine. The speed of the crosshead was 2 mm/min. five composites specimens were tested for each sample and each test was performed until failure occurred.
2.6. Wear Testing Details
The wear properties of different samples were tested on the wear and friction monitor DUCOM TR-201C commonly known as Pin-on-Disk machine. The samples were cut according to the ASTM standard G99. The test samples were then glued to the mild steel pins of 10mm square cross-section and 40mm length. The track radius of 40mm was set, the specimen is held stationary and the disk is rotated while a normal force is applied through a lever mechanism. A series of tests were conducted with three different sliding velocities of 1.5, 2 and 2.5 m/s under three normal loading 50N, 60N and 70N at different speed. Frictional force is noted down and the material loss from the composite surface is measured using a precision electronic balance with accuracy ±0.1mg.
3. Results and Discussion
This chapter presents the physical, mechanical and wear characterization of the class of polymer matrix composite developed for the present investigation. They are natural fiber composites with reinforcement percentage 10%, 15% and 20% respectively. The results of various characterization tests are reported here. The properties discussed include density, hardness, coefficient of friction, abrasive wear loss, dry sliding wear loss and water absorption rate of composites.
3.1. Density
It is the simplest property which can be measured when the composites are developed. Density of a material is its mass per unit volume. The density of the neat epoxy was found to be 1.165g/cc. The addition of the coconut fiber resulted in increase in the density of the composite. Increase in density is an obvious effect due to the high density of coconut fibers. The variation is as shown in Figure 1.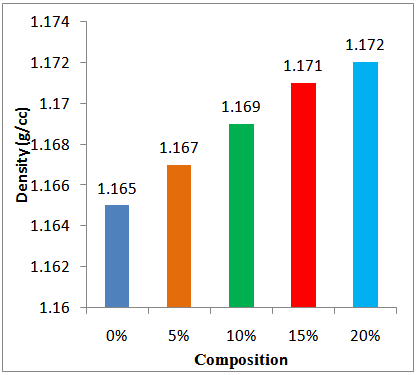 | Figure 1. Comparison between densities of different composite specimens |
3.2. Mechanical Properties of Composites
Development of Bio-fiber composites made from natural fibers with increased strength, stiffness and durability requires necessary understanding of mechanical behaviors. The mechanical properties of Bio-fiber composites depend on the fiber strength, fiber modulus, fiber length, fiber orientation, and fiber–matrix interfacial bond strength. A strong fiber–matrix interface bond plays a vital role in establishing high mechanical properties of composites. A good interfacial bond is required for effective stress transfer from the matrix to the fiber by which maximum utilization of the fiber strength in the composite can be obtained. This leads to developing an alternative material to wood. The analysis of mechanical properties of composites is important for understanding the behavior of composite materials. It is a well-known fact that the mechanical properties of fiber-reinforced composites depend on the nature of matrix material, the distribution and orientation of the reinforcing fibers and the nature of the fiber matrix interfaces. A change in the physical and chemical structure of the fiber for a given matrix will result in drastic changes in the overall mechanical properties of composites.
3.2.1. Hardness
Hardness is measured by the resistance which a smooth surface offers to indentation. The graph is plotted using the results of hardness test is as shown in Figure 2. The density of the neat epoxy was found to be 90 RHN. The addition of the coconut fiber resulted in decrease in the density of the composite. This may be due to formation of micro voids during fabrication process.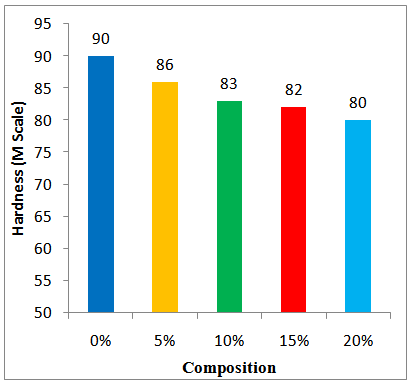 | Figure 2. Comparison between hardness of different composite specimens |
3.2.2. Tensile Strength
Figure 3. Gives clear picture of specimen before and after the tensile testing. Fiber pullout can be clearly observed in the figure.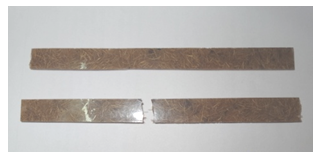 | Figure 3. Specimen before and after tensile testing |
Comparison of Ultimate Tensile Strength of Composites is as shown in the Figure 4. It is observed that CF 10% composite is having maximum tensile strength; this can be used for product applications.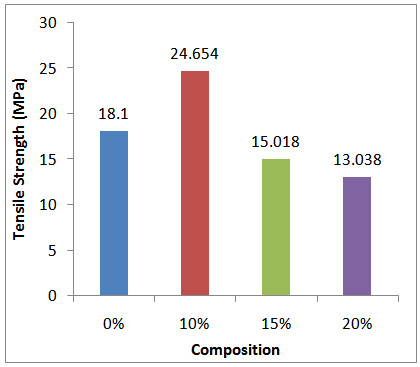 | Figure 4. Comparison between the tensile strength of different composite specimens |
Comparison between the tensile modulus of different composite specimens is as shown in the Figure 5. Tensile modulus was found to be maximum for CF 10% composite. The tensile modulus was found to reduce as we increase the percentage of coconut fiber. 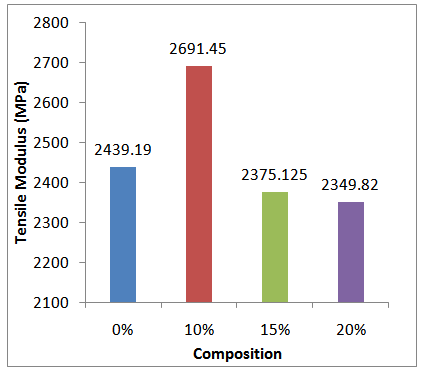 | Figure 5. Comparison between the tensile modulus of different composite specimens |
3.2.3. Flexural Strength of Composites
Flexural strength of the coconut fiber composites as a function of fiber loading (weight percentage) is shown in Figure 7. The stresses induced due to the flexural load are a combination of compressive and tensile stresses. The Flexural strength of CF10% composite is found to be maximum and decrease with further increase in weight fraction of fiber in the natural composites. It was found that the natural fiber composites show maximum mechanical properties between 5% - 10% of the fiber reinforcements. The enormous availability cheaper and good strength Coconut fibers leads way for the fabrication of lightweight materials that can be used in office furniture, packaging industry, partition panels, and others compared to wood based plywood or particle boards.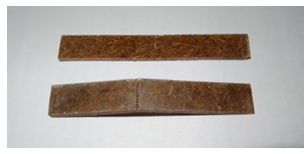 | Figure 6. Specimen before and after Flexural testing |
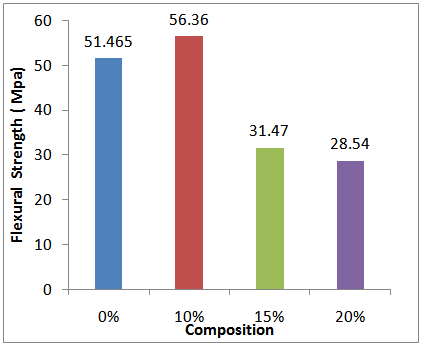 | Figure 7. Comparison between the flexural strength of different composite specimens |
As the composition of the coconut fiber particulate increases the elongation of the composite decreases, hence it infers that as the percentage of coconut fiber particulate increases the composite becomes more brittle.Comparison between the flexural modulus of different composite specimens is shown in the Figure 8. Flexural modulus is found to be maximum for CF 10% composite. As we increase the percentage of coconut fiber the flexural modulus is found to reduce. It is found to be lowest for CF 20% composite.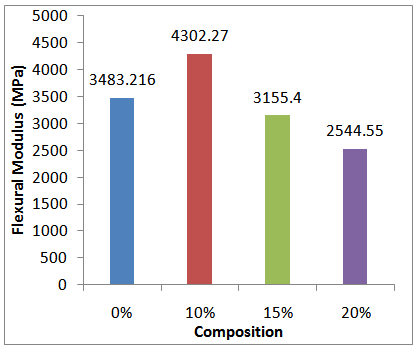 | Figure 8. Comparison between the flexural modulus of different composite specimens |
3.3. Wear Property
3.3.1. Abrasive Wear Property
Abrasive wear occurs when a hard rough surface slides across a softer surface. ASTM International (formerly American Society for Testing and Materials) defines it as the loss of material due to hard particles or hard protuberances that are forced against and move along a solid surface.The grid size of abrasive paper used is 400. The wear loss is found to be maximum for plain epoxy and as we increased the percentage of coconut fiber the wear loss was found to reduce. Among the coconut fiber composites the composite having 15% of coconut fiber was found to have the minimum wear loss.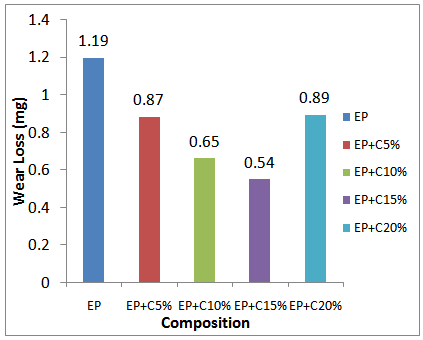 | Figure 9. Comparison between the wear losses of different composite specimens (Abrasive wear test) |
3.3.2. Dry Sliding Wear Property
The effect of war loss for different composites at a constant load of 70N and 2000m sliding distance for varying sliding velocities (i.e. 1.5, 2, 2.5m/s) is as shown in the Figure 10.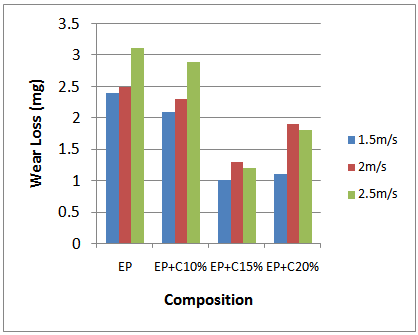 | Figure 10. Comparison between the wear losses of different composite specimens (Load 70N, 2000M sliding distance) |
As we experimented we found that the wear loss was found to increase with increase in sliding velocity at a constant load and sliding distance. The wear loss was found to be maximum for epoxy. For CF 10 and CF 15% composite the loss was found to reduce. But for CF 20% composite the wear loss slightly increases. The lowest wear loss among all is for CF15% composite.The effect of war loss foe different composites at a constant sliding velocity of 2.5m/s and 2000m sliding distance for varying load (i.e. 50, 60, 70N) is as shown in the Figure 11. As we experimented we found that the wear loss was found to increase with increase the load at a constant sliding velocity and sliding distance. The wear loss was found to be maximum for epoxy. For CF 10% and CF 15% composite the loss was found to reduce. But for CF 20% composite the wear loss slightly increases. The lowest wear loss among all is for CF 15% fiber composite. 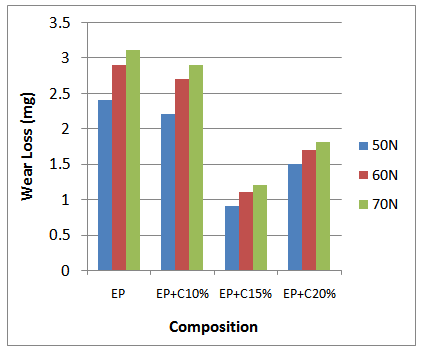 | Figure 11. Comparison between the wear loss of different composite specimens (Sliding velocity 2.5m/s and 2000m sliding distance) |
3.3.3. Frictional Force
The graph of frictional force verses time for neat epoxy and different percentage of coconut fiber composites is as shown Figure 12. The frictional force is found to be highest for neat epoxy and the lowest was found to be for CF 15% composite, also it shows varying trend.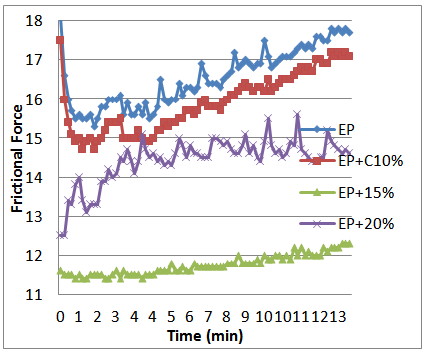 | Figure 12. Comparison between frictional force of different composite specimens (maximum load 70N) |
3.4. Water Absorption Test
Effect of Fiber Percentage (Weight Fraction)The percentage of water absorption in the composites was calculated by weight difference between the samples immersed in water and the dry samples using the following equation.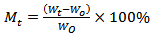 | (1) |
Where, Mt is the moisture content in the specimen, Wt is the weight of the specimen at the immersion time and Wo is the weight of the specimen before the water absorption test. The water absorption results for various samples which are prepared with coconut shell particulate with different volume fraction were plotted in figure 13. It was found that water absorption was found to reduce for treated coconut fiber composite, because the impurities are removed by chemical treatment. The water absorption curve illustrates that the minimum water absorption is for the composite prepared with CF 5% composite volume fraction and the water absorption was to be maximum for CF 20% composite. As we increase the percentage of coconut fiber, the corresponding water absorption percentage increases.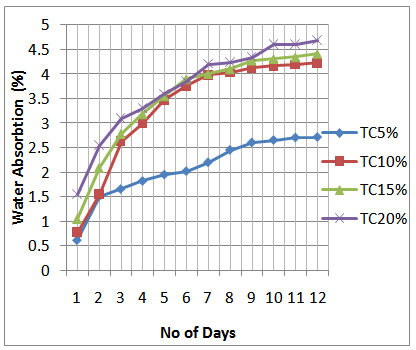 | Figure 13. Comparison of water absorption of different treated composite specimens |
4. Conclusions
Based on the results the following conclusions were drawn.i. It is found that by the addition of coconut fiber increased the density of the composite. This is because of highly dense coconut fibers.ii. The abrasive wear loss is found to be maximum for plain epoxy and as we increased the percentage of coconut fiber the wear loss was found to reduce. Among the coconut fiber composites the composite having CF 15% was found to have the minimum abrasive wear loss. The dry sliding wear loss was found to be maximum for epoxy. The lowest wear loss among all is for CF 15% composite. The frictional force is found to be highest for neat epoxy and the lowest was found to be for CF 15% composite.iii. Ultimate Tensile Strength and tensile modulus is found to be maximum for CF10% composite, further increase in fiber resulted in tensile modulus. Flexural strength and modulus is found to be maximum for CF 10% composite. As we increase the percentage of coconut fiber the flexural properties found to reduce. It is found to be lowest for CF 20% composite.iv. The water absorption test e illustrates that as we increse the percentage of fiber the absorbtion rate increases and it is found to be maximum for CF 20%.
ACKNOWLEDGEMENTS
The authors extend heartfelt thanks and appreciations to Director and Principal of St Joseph Engineering College, Mangaluru for their continuous support and encouragement during research work.
References
| [1] | Khin Aye Tue and Moe Moe Thwe, “Recycle of Plastic Waste and Agricultural Waste” Energy Research Journal, vol. 4, no. 1, pp. 24-29, 2013. |
| [2] | B. Aldousiri, A. Shalwan and C. W. Chin “Mechanical Properties of Palm Fibre Reinforced Recycled HDPE”, Advances in Materials Science and Engineering, Volume 2013, Article ID 508179, 7 pages, 2013. |
| [3] | B. Aldousiri, A. Shalwan and C. W. Chin “A Review on Tribological Behaviour of Polymeric Composites and Future Reinforcements”, Advances in Materials Science and Engineering, Volume 2013, ID 645923, 8 pages, 2013. |
| [4] | Jia Ying Tong, Nishata Royan Rajendran Royan, Yong Chuen Ng, Mohd Hafizuddin Ab Ghani and Sahrim Ahmad “Study of the Mechanical and Morphology Properties of Recycled HDPE Composite Using Rice Husk Filler”, Advances in Materials Science and Engineering Volume 2014, Article ID 938961, 6 pages, 2014. |
| [5] | Bao-feng Pan, Nan-ying Ning, Jun Liu, Lan-ying Bai and Qiang Fu “Mechanical Properties Of Smc Whisker Reinforced High Density Polyethylene Composites”, Chinese Journal of Polymer Science, Vol. 27, No. 2, pp. 267−274, 2009. |
| [6] | Zhao-Bin Chen, Tong-Sheng Li, Yu-Liang Yang,1 Yu Zhang and Shi-Quan Lai “The Effect of Phase Structure on the Tribological Properties of PA66/HDPE Blends”, Macromolecular Material and Engineering, Vol. 289, pp. 662–671, 2004. |
| [7] | Yakubu Dan-mallam, Mohamad Z. Abdullah and Puteri S. M. Megat Yusoff “Predicting The Tensile Properties Of Woven Kenaf/Polyethylene terephthalate (PET) Fiber Reinforced Polyoxymethylene (POM) Hybrid Laminate Composite” IOSR Journal of Mechanical and Civil Engineering (IOSRJMCE), ISSN: 2278-1684, Vol. 2, Issue 3 , pp.06-13, 2012. |
| [8] | Liping Zhao, Ping’an Song, Zhenhu Cao, Zhengping Fang and Zhenghong Guo “Thermal Stability and Rheological Behaviors of High Density Polyethylene/Fullerene Nanocomposites” Volume 2012, Article ID 340962, 6 pages, 2012. |
| [9] | Shahrzad Khoramnejadian, “Enhance mechanical and thermal properties of recycled Poly ethylene terephetalat (PET) from used bottle”, Advances in Environmental Biology, ISSN: 1995-0756, Vol. 5, No. 13, pp. 3826-3829, 2011. |
| [10] | Masahiro Shinoda and Richard J. Bathurst, “Lateral and axial deformation of PP, HDPE and PET geogrids under tensile load”, Wear, Geotextiles and Geomembranes, Vol. 22, pp. 205–222, 2004. |
| [11] | D. Verma1, P.C. Gope, A. Shandilya, A. Gupta and M.K. Maheshwari, “Coir Fibre Reinforcement and Application in Polymer Composites: A Review”, J. Mater. Environ. Sci., ISSN: 2028-2508, Volume. 4, No. 2, pp.263-276, 2013. |
| [12] | Henry C. Obasi, “Properties of Raphia Palm Interspersed Fibre Filled High Density Polyethylene” Advances in Materials Science and Engineering, Volume 2013, Article ID 932143, 5 pages, 2013. |
 Abstract
 Reference
 Full-Text PDF
 Full-text HTML