American Journal of Materials Science

p-ISSN: 2162-9382    e-ISSN: 2162-8424

2015;  5(3C): 12-18

doi:10.5923/c.materials.201502.03

Photocatalytic Behaviour of Nanocomposites of Sputtered Titanium Oxide Film on Graphene Oxide Nanosheets

Sunil Meti , Udaya Bhat K. , Rahman M. R. , Jayalakshmi M.

Department of Metallurgical and Materials Engineering, NITK Surathkal, Srinivasnagar, India

Correspondence to: Udaya Bhat K. , Department of Metallurgical and Materials Engineering, NITK Surathkal, Srinivasnagar, India.

Email:

Copyright © 2015 Scientific & Academic Publishing. All Rights Reserved.

Abstract

In this investigation, fabrication, characterization and photocatalytic properties of graphene oxide nanosheets (GONs) and titanium oxide (TiO2) thin film composites, has been reported. Graphene oxide nanosheets were prepared by using a bottom-up approach, namely, hydrothermal route. Sucrose and de-ionized water were the constituents and synthesis was carried out by using an autoclave. GONs were scooped on a glass substrate. GON-glass substrate combination was annealed in argon to restore the conductivities. Deposited GONs were coated with TiO2 using reactive magnetron sputtering. The as-deposited TiO2 was amorphous and another annealing treatment was given to convert it into crystalline phase. The composites were characterized using X-ray diffractometry (XRD), Fourier transform infrared spectrometry (FTIR), Scanning electron microscopy (SEM), Atomic force microscopy (AFM), Raman spectroscopy and Transmission electron microscopy (TEM). Their photocatalytic properties were investigated by using UV-Visible spectroscopy. Photocatalytic behaviour was compared with bare TiO2. Methyl orange solution was used as a model solution. It was observed that GONs provided a good support for TiO2. The graphene oxide layer enhances the photocatalytic activity of TiO2 by at-least three times compared to bare TiO2.

Keywords: Graphene oxide, Hydrothermal route, Bottom-up synthesis, Sputter deposited TiO2 films, Annealing

Cite this paper: Sunil Meti , Udaya Bhat K. , Rahman M. R. , Jayalakshmi M. , Photocatalytic Behaviour of Nanocomposites of Sputtered Titanium Oxide Film on Graphene Oxide Nanosheets, American Journal of Materials Science, Vol. 5 No. 3C, 2015, pp. 12-18. doi: 10.5923/c.materials.201502.03.

1. Introduction

Composites containing carbon nanotubes (CNT’s), graphene and its oxide (GO) show unique properties such as, theoretically high charge carrier mobility and surface area [1]. Graphene oxide (GO) is environmentally friendly and cheap and hence, vastly studied in recent years to apply it in almost each and every field [2]. The carbon nanotubes have the capability of string one electron per 32 carbon atoms in their conjugated sp2 networks [1]. Titanium oxide (TiO2) has excellent chemical stability, mechanical hardness and optical transmittance with high refractive index. Hence, titanium oxide thin films are promising in the fields, such as, solar cells, optical and protective coatings. TiO2 thin films are being considered as the most promising materials in environmental cleaning such as photocatalytic purifier and photochemical solar cells [3]. In this context, nanocomposites of GO and TiO2 are highly promising. These nanomaterials owing to their physical and electronic properties have made significant contributions in the research of photocatalytic enhancement. Focus is also on enhancing light absorption range of TiO2 (which is otherwise limited to only UV region) and overcoming the problem of fast recombination of photogenerated charge carriers [1]. There are different routes to synthesize graphene and convert into graphene oxide (GO). Few of them are chemical vapour deposition (CVD) [4], SiC pyrolysis [5], graphite oxide reduction [6], mechanical exfoliation method (also called the‘‘Scotch tape method’’) [7] etc. In this paper, design, fabrication, and performance of model nanocomposites of graphene oxide–TiO2 thin film with an aim to understand the role of graphene oxide prepared using the Tang Lau method via hydrothermal route has been reported. This method was selected due to ease of synthesis and requirement of mild chemicals compared to top-down approach. Also, this can produce relatively coarse graphene oxide nanosheets (GONs) [8]. TiO2 thin films can be prepared by different techniques such as sol-gel process [9], chemical vapour deposition (CVD) [10, 11] sputter depositions [1], and ion beam-assisted processes [12]. In this investigation DC magnetron sputtering technique was used for the deposition of TiO2 thin films.

2. Experimental Section

Glass (soda lime glass plates, dimensions: 10×2.5×0.5 cm) and aluminium foils were used as substrates for deposition. The substrates were cleaned by repeated ultrasonication, washing in acetone and by drying. Graphene oxide nanosheets (GONs) are grown by using hydrothermal route [8]. A solution of 0.5 molarity was prepared by using sucrose (make: Sigma-Aldrich) and deionised water. 50 ml of prepared solution was poured into a Teflon lined autoclave and kept in an oven at a temperature 180 ± 1°C for time duration of 90 minutes. After the set time, the autoclave was cooled to room temperature, GONs were scooped and then transferred onto substrates (either glass or aluminium foil) and annealed. The synthesis parameters were selected from the work of Tang et al. [8].

2.1. Annealing

Annealing of GONs was carried out under argon atmosphere at 1 cubic centimetre per minute (ccpm), at 450 °C for 5 minutes [8]. To minimize oxidation of the GONs during heating, GONs and substrate were wrapped with Cu foils. Upon increase in temperature, the edge-plane–COOH (carboxyl) groups become highly unstable, whereas >C=O (carbonyl) are more difficult to be removed. The most stable among the oxygen species is C-OH (hydroxyl) group in the GONs. Annealing of GONs at a temperature greater than 400°C leads to decomposition of –COOH group. Changes during annealing treatment are schematically shown in Fig. 1. For nanoelectronics applications, the annealing temperature should cross 1000°C [13].
Figure 1. Presence of traces of phenolic groups after annealing GON in presence of argon at 450°C [13].

2.2. Sputtering

Glass substrate with coated graphene oxide was used as substrate for TiO2 thin film deposition. TiO2 thin film was deposited by DC reactive magnetron sputtering method (360 V, 0.35 A). The deposition was performed at room temperature in vacuum of 3×10⁻⁵ mbar and for 45 minutes. The oxygen and argon flow rates were set as 4 ccpm and 30 ccpm, respectively. Annealing of TiO2 was carried out at 450°C in argon atmosphere for 2 hours to convert amorphous TiO2 into the predominantly anatase structure [1, 14]. Both deposition time and annealing promote formation of anatase phase. The annealing parameters for sputtered TiO2 were narrowed down as in [1].

2.3. Photocatalytic Experiment Using Methyl Orange

Photocatalytic experiments were carried out at 25°C in a chamber which is positioned with a UV source lamp with maximum power of 32 W. A glass cell containing 5 µM solution of methyl orange (MO) in de-ionized (DI) water, is used as test sample [15]. The solution is magnetically stirred during photocatalytic experiment. Glass substrates with GON-TiO2 composite and bare TiO2 films (after heat treatment) were dipped in the bath solution separately and exposed to UV light for 5 hours duration. The effective area of the TiO2 film / composite, used for photocatalytic experiment was 10 cm2. The concentration of the methyl orange before and after exposing it to UV was estimated using UV-Visible spectrometer and they are used for estimating photocatalytic degradation [16, 17]. If Co and Cf are initial and final concentration of methyl orange in the solution, photocatalytic degradation is given by equation (1)
(1)

3. Characterization Techniques

Phase identification in the samples was carried out by using X-ray diffraction (XRD, machine-JEOL-JPX 8) technique using copper target (1.54Å). A scan rate of 0.5° min-1 was used. The structure of the synthesized GONs was studied using Fourier transform infrared (FTIR, machine-JASCO-4200) spectrometer using KBr pellets. Band energy was studied using Raman spectroscopy with 325 nm and 514 nm LASER (machine-Horibajobin Yvon-LabRAM HR). The thickness and roughness (topography) of the samples were characterized by an Atomic force microscope (AFM, machine-A.P.E. Research-A100). The absorption spectrum of GONs and bare TiO2 film were obtained separately using UV-Visible spectrometer (machine-Analytikjena-S600). The average transmittance of the sputtered film in the visible region is ~80%. Scanning electron microscope attached with an energy dispersive spectroscope (SEM, machine-JEOL-JSM-6380LA, equipped with EDS from Oxford instruments) was used to investigate chemical composition of the composite. Transmission electron microscope (TEM, machine-JEOL-JEM-2100) images were taken to study the morphology of GONs.

4. Results and Discussion

Fig. 2 shows XRD plots of bare GONs and TiO2 film (after heat treatment) separately. The XRD plot of GON [Fig. 2 (a)] shows reflection corresponding to (001) plane at 10.06°. Predominant (001) reflection also indicates that the synthesized GON has layered structure. The calculated interplanar spacing is 0.87 nm against a reported value of 0.80 nm [12]. Similarly, the XRD plot of a TiO2 film [Fig. 2 (b)] indicates that TiO2 has anatase phase (data file No JCPDS FILE: 21-1272). Formation of anatase phase after heat treatment of sputtered TiO2 is reported by Ghasemi et al. [18]. During heat treatment, anatase predominantly grows along (101) orientation.
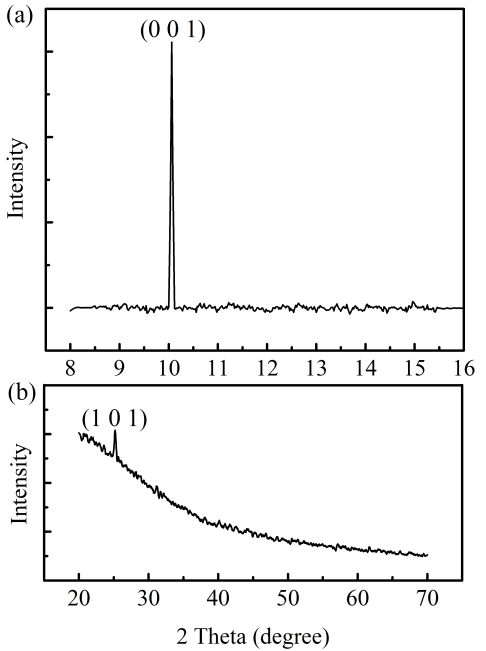
Figure 2. XRD graph of (a) GO and (b) TiO2 sputtered film
Fig. 3 shows FTIR plot of the GONs, after annealing treatment. The plot shows high levels of absorption at 1699.9 cm-1 and 1621.2 cm-1. This is attributed to the presence of a large number of C=O and C=C bonds after annealing. C=C and C=O are intrinsic characteristics of GONs [8]. A small peak at 1358.6 cm-1 is attributed to the wagging of C-H bonds present at edges of GONs. The broad absorption peak of –OH centred at 3354.6 cm-1 is shown and it indicates that –OH is present in the honeycomb framework of carbon. The peak at 2926.5 cm-1 is attributed to stretching of C-H bond. Above observations reveal that only C, H and O are the elements present in GONs and C=C and C-C forms the honeycomb structure. O and H decorate the honeycomb frame and are present in the form of –OH, C-H, and –C=O. A schematic of the structure presented by Ganguly et al. [13] is presented in Fig. 1. The presence of oxygen groups reveal that oxidized graphene layer is present. The absorption band ranging from 1000-1200 cm-1 shows presence of γCC and γCO groups [8]. It shows that even when annealed at 450 °C, the GON still contains O.
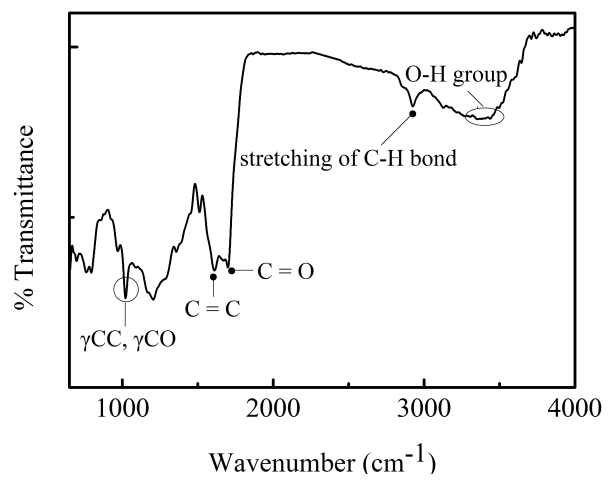
Figure 3. FTIR spectrum of graphene oxide
Fig. 4 shows the Raman spectrum of GON+TiO2 thin film after annealing at 450°C. There are two distinct sets of peaks, separately corresponding to annealed TiO2 and annealed graphene oxide layers. Peaks with wave numbers less than 1000 cm-1 are from TiO2 and peaks with wave numbers greater than 1000 cm-1 are from graphene oxide. The peaks corresponding to 144 and 401 cm-1 indicate the presence of the anatase and peaks at 264 and 610 are due to the presence of TiO2 film [19]. It is also observed that the fluorescent background radiation is strong as compared to the source sample radiation. In the Raman spectrum, the peaks corresponding to 1374, 1595, 2646 and 2874 cm-1 represents D, G, 2D and D+G bands, respectively. These results are in good agreement with the already published results for GO [8]. G band gives us the information on the in-plane vibration of sp2 bonded carbon atoms and is common to all sp2 carbon forms. G band also suggests the stretching modes of C-C bonds in sp2 rings. D band originates due to defects at the sheet edges and due to the breakdown of translational symmetry. Its intensity indicates the amount of defects present in the lattice [1, 20]. It is reported that increase in annealing temperature decreases carbon related defects and increases sp2 bonded carbon atoms [8]. The intensity value of peaks gives an estimation of disorderness or defects in the sample species [21] and in the present profile the ratio is ID / IG = 0.89. The ratio shows that in-plane sp2 domain is stronger and it also attributed to the larger size of the GON sheets. In larger sheets, edge defect concentration would be less.
Figure 4. Raman spectrum of graphene oxide and TiO2 film
Fig. 5 presents results of AFM investigations on the GONs. Fig. 5(a) gives topographic image. The GONs are relatively smooth except for a step in one side. On the step side there are small hills like features indicating nanometric scale surface features in otherwise smooth graphene layers. Roughness profiles were obtained along two lines, marked 1 and 2. It has been observed that maximum height differences along two profiles are 210 and 290 nm. The Ra value of the graphene sheet is measured as 121 nm. GON of nanometer scale thickness is reported by [8], but their synthesis temperature was 165°C and carried out for lesser time.
Figure 5. (a) AFM images of graphene oxide, (b) Roughness scans along two lines marked 1 and 2 in Fig. 5(a)
The temperature was intentionally kept higher and the time was longer to obtain GONs of larger size and covering the entire glass substrate. This was essential to get good coverage of TiO2 thin film during DC sputtering.
Fig. 6 shows UV-Vis absorption spectra for GON and TiO2, respectively. In Fig. 6(a), a characteristic absorption peak at 235 nm is observed and it is attributed to π-π* transition of C-C bonds in aromatic ring and shoulder peak at ~302 nm is due to n-π* transitions of aromatic C-C bonds [22]. Room temperature UV-Vis absorption spectra of TiO2 nanofilm [Fig. 6(b)] exhibits strong absorption below 400 nm [17, 19].
Figure 6. (a) UV- Vis spectrum of graphene oxide, (b) UV- Vis spectrum of TiO2 film
Fig. 7(a)-(d) shows scanning electron micrographs of GONs (as deposited), annealed GONs, GON+TiO2 composite (as sputtered) and GON+TiO2 composite after annealing. As deposited GON sheets are of hundreds micrometers in dimensions. Also, after annealing, the GON sheets are intact (marked I) except for isolated cracking and peeling off (marked P). In Fig. 7(c), GO nanosheets along with sputtered TiO2 are presented. A thin layer of TiO2 covers the top of GON and on that additional TiO2 globules are observed. Some of these globules are as big as 6-8 μm in diameter. Fig. 7(d) shows morphology of the composite after annealing treatment. Most of the globules are disappeared and a single surface is observed. The morphology of sputtered TiO2 altered during annealing treatment. EDS analysis was carried out on the region presented in Fig. 7(d) and it is presented in Fig. 8. The plot shows peaks corresponding to C, O and Ti elements. Their atomic percentages are 64.8, 34.6, 0.6 respectively.
Figure 7. SEM micrographs of (a) GON sheet, (b) GON annealed sheet (c) GO/TiO2 film and (d) GO/TiO2 annealed film
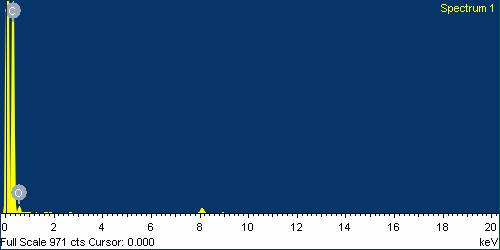
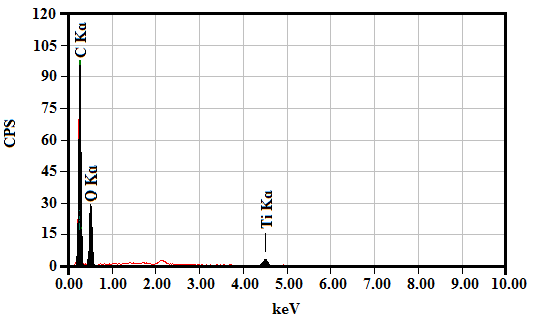
Figure 8. EDX spectrum of GON and TiO2 film
Fig. 9 shows a couple of TEM micrographs of bare GONs after heat treatment. The micrographs clearly show that the GONs are quite large in size, in tens of micrometers. GONs are deposited in a lamellar fashion and this provides a large specific surface area for the deposition of TiO2 during sputter deposition. Tang et al. [8] have reported GONs, but they are smaller in size (in nanometers). The EDS analysis in this film (Fig. 10) shows that the bare GON consists of C and O only. Their atomic percentages are 97.6 and 2.4 respectively.
Figure 9. TEM micrographs of graphene oxide nanosheets
Figure 10. TEM EDX pattern of GONs
Fig. 11 shows UV-Visible spectra of the plain solution (methyl orange before exposure to UV radiation), Solution + glass coated with TiO2 and Solution + GON-TiO2 composite, after exposure to UV radiation for 5 hours. Spectrum was also collected after 2 hours to study the trend. The characteristic absorption peak for methyl orange is at 463 nm [16, 19]. The plots show that the absorption is minimum for GO+TiO2 composite at this wavelength amongst three samples selected. It indicates that the decomposition of methyl orange is maximum in this sample and the sample is relatively clean.
Figure 11. UV-Vis spectra indicating extent of degradation of methyl orange solution
The photocatalytic degradation rates are explained through pseudo first order kinetics using Langmuir-Hinshelwood model [23]
(2)
The above equation can be rewritten as
(3)
where k is the rate constant for pseudo first order reaction. The reaction rate is calculated from the relation (Equation 3) and the plot of ln(Co/Cf) against irradiation time was plotted and shown in Fig. 12(a). The calculated rate constant was found to be 0.17 hour-1 and 0.054 hour-1 for GO-TiO2 and bare TiO2, respectively. A rate constant of 0.03012 hour-1 is reported by Steng et al. [20]. They employed modified Hummers’ method [20] to fabricate GO nanosheets and composite was made by using TiO2 nanopowder.
The plot shows that the degradation of methyl orange (MO) is faster with GO-TiO2 composite compared to bare TiO2 sample. About 60% degradation is achieved by exposing the MO with catalyst and 32% for that of bare TiO2 to UV light for 5 hours duration (Fig. 12(b)). TiO2 is a semiconductor with a band gap of ~3.0 eV for rutile and ~3.2 eV for anatase [1] and the UV light with wavelength shorter than 400 nm can excite a pair of electrons and holes. Electrons from the valence band of TiO2 will jump to the conduction band to valence band of GO surface leading to formation of holes in the valence band of TiO2. These liberated electrons can reduce oxygen molecules to form O2-* radicals. And the holes can oxidize H2O resulting in *OH radicals. These effectively degrade the methyl orange molecules [17]. These are effectively adsorbed by the coated composite which enhances photocatalytic ability.
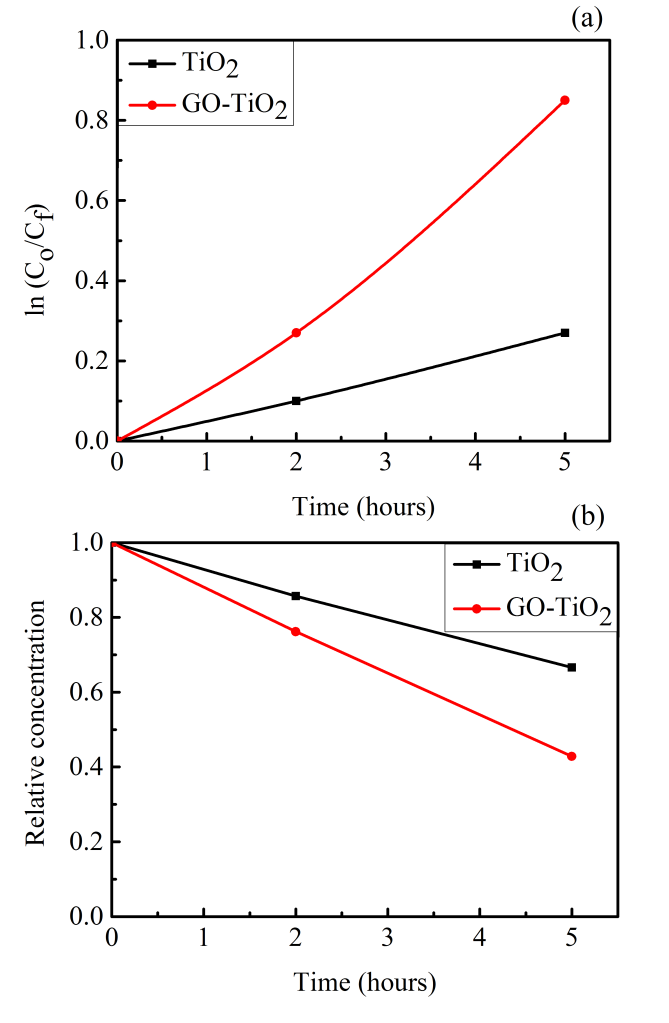
Figure 12. (a) Plot indicating a pseudo first order reaction (b) relative concentration of methyl orange at different time scales

5. Conclusions

Graphene oxide nanosheets-TiO2 thin film nanocomposites were prepared using a combination of hydrothermal route and DC magnetron sputtering. Volatile species were minimised by a set of annealing treatment. The graphene oxide nanosheets were relatively coarse and surface roughness was negligible. The samples were characterised for their bonding behaviour by using Raman spectroscopy, FTIR and UV-Vis spectroscopy. Their ability to degrade methyl orange was tested and observed that the layered composite shows three times improved behaviour compared to bare TiO2 thin film, deposited and annealed under similar conditions.

ACKNOWLEDGEMENTS

The authors gratefully acknowledge the help rendered by Dr. Anandhan S., Met. & Matls. Engg. Dept., NITK Surathkal in FTIR spectroscopic studies, Dr. Sathyanarayana, Physics Dept., NITK Surathkal in annealing treatments and Dr. Ramachandra Bhat, Chemistry Dept., NITK Surathkal in UV-Vis spectroscopic studies.

References

[1]  R. Sellappan, J. Sun, A. Galeckas, N. Lindvall, A. Yurgens, A. Y. Kuznetsov and D. Chakarov, 2013, Influence of graphene synthesizing techniques on the photocatalytic performance of graphene-TiO2 nanocomposites, Phys. Chem., 15(37), 15528—15537.
[2]  P. Song, X. Zhang, M. Sun, X. Cui and Y. Lin, 2012, Graphene oxide modified TiO2 nanotube arrays: enhanced visible light photoelectrochemical properties, Nanoscale, 4(5) 1800–1804.
[3]  S. Takeda, S. Suzuki, H. Odaka and H. Hosono, 2001, Photocatalytic TiO2 thin film deposited onto glass by DC magnetron sputtering, Thin Solid Films, 392, 338-344.
[4]  Xuesong Li, W. Cai, J. An, S. Kim, J. Nah, D. Yang, R. Piner, A. Velamakanni, I. Jung, E. Tutuc, S. K. Banerjee, L. Colombo and R. S. Ruoff, 2009, Large-area synthesis of high quality and uniform graphene films on copper foils, AAAS Science, 324, 1312-1314.
[5]  S. W. Fong, M. C. Hersam, J. M. P. Alaboson, J. A. Kellar and Q. H. Wang, 2011, Patterning atomic layer deposition thin films on graphene by atomic force microscope field-induced oxidation, Nanoscape, Appl. Phys. Lett., 8(1), 1-7.
[6]  S. Park, J. An, I. Jung, R. D. Piner, S. J. An, X. Li, A. Velamakanni, and R. S. Ruoff, 2009, Colloidal suspensions of highly reduced graphene oxide in a wide variety of organic solvents, Nano Lett., 9(4), 1593-1597.
[7]  K. S. Novoselov, A. K. Geim, S. V. Morozov, D. Jiang, Y. Zhang, S. V. Dubonos, I. V. Grigorieva and A. A. Firsov, 2004, Electric field effect in atomically thin carbon films, Science, 306, 666-669.
[8]  L. Tang, Xueming Li, Rongbin Ji, K. S. Teng, G. Tai, Jing Ye, C. Wei and S. P. Lau, 2012, Bottom-up synthesis of large-scale graphene oxide nanosheets, The Royal Society of Chemistry, J. Mater. Chem., 22, 5676–5683.
[9]  K. Ishibashi, Y. Nosaka, K. Hashimoto and A. Fujishima, 1998, Time-dependent behavior of active oxygen species formed on photo-irradiated TiO2 films in air, J. Phys. Chem., 102, 2117-2120.
[10]  M. Gartner, R. Scurtu, A. Ghita, M. Zaharescua, M. Modreanub, C. T. rapalisc, M. Kokkoris and G. Kordasc, 2004, Spectro-ellipsometric characterization of sol–gel TiO2–CuO thin coatings, Thin Solid Films, 455 –456, 417-421.
[11]  Q. N. Zhao, C. L. Li and X. J. Zhao, 2003, The structure and photocatalytic activity of CeO2 doped TiO2 films deposited on glass by magnetron sputtering, Key Engineering Materials, 249, 451-456.
[12]  M. Gilo and N. Croitoru, 1996, Properties of TiO2 films prepared by ion-assisted deposition using a gridless end-Hall ion source, Thin Solid Films, 283, 84-89.
[13]  A. Ganguly, S. Sharma, P. Papakonstantinou and J. H. Probing, 2011, The thermal deoxygenation of graphene oxide using high resolution in-situ X-Ray based spectroscopies, J. Phy. Chem. C, 115 (34), 17009-17019.
[14]  S. Boukrouh, R. Bensaha, S. Bourgeois, E. Finot, and M. C. Marco de Lucas, 2008, Reactive direct current magnetron sputtered TiO2 thin films with amorphous to crystalline structures, Thin Solid Films, 516, 6353–6358.
[15]  G. Jiang, Z. Lin, C. Chen, L. Zhu, Q. Chang, N. Wang, W. Wei and H. Tang, 2011, TiO2 nanoparticles assembled on graphene oxide nanosheets with high photocatalytic activity for removal of pollutants, CARBON, 49, 2693–2701.
[16]  Y. Chen, S. Liu, H. Yu, H. Yin and Q. Li, 2008, Radiation-induced degradation of methyl orange in aqueous solutions, Chemosphere 72(4), 532–536.
[17]  M. M. Ba-Abbad, A. A. H. Kadhum, A. B. Mohamad, M. S. Takriff and K. Sopian, 2012, Synthesis and catalytic activity of TiO2 nanoparticles for photochemical oxidation of concentrated chloro-phenols under direct solar radiation, Int. J. Electrochem. Sci., 7, 4871-4888.
[18]  S. Ghasemia, A. Esfandiarb, S. Rahman Setayesha, A. H Yangjehc, A. I. Zadb and M.R. Gholamia, 2013, Synthesis and characterization of TiO2–graphene nanocomposites modified with noble metals as a photocatalyst for degradation of pollutants, Applied catalysis A: General, 462-463, 82-90.
[19]  L. Martinez, S. Torres, V. Likodimos, J. Figueiredo, J. Faria, P. Falaras and A. Silva, 2012, Advanced nanostructured photocatalysts based on reduced graphene oxide-TiO2 composites for degradation of diphenhydramine pharmaceutical and methyl orange dye, Applied Catalysis B: Environmental, 123-124, 241-256.
[20]  V. Steng, S. Bakardjieva, T. M. Grygar, J. Bludska and M. Kormunda, 2013, TiO2-graphene oxide nanocomposite as advanced photocatalytic materials, Chemistry Central Journal, 7(1):41.
[21]  Changjing Fu, G. Zhao and S. Li, 2013, Evaluation and Characterization of Reduced Graphene Oxide Nanosheets as Anode Materials for Lithium-Ion Batteries, Int. J. Electrochem. Sci., 8, 6269-6280.
[22]  L. Shahriary and A. A. Athawale, 2014, Graphene Oxide Synthesized by using Modified Hummers Approach, IJREEE, 2(1), 58-63.
[23]  R. Mohan, K. Karthikeyan and S.J. Kim, 2012, Enhanced photocatalytic activity of Cu-doped ZnO nanorods, Solid State Commun., 152, 375-380.