-
Paper Information
- Next Paper
- Paper Submission
-
Journal Information
- About This Journal
- Editorial Board
- Current Issue
- Archive
- Author Guidelines
- Contact Us
Journal of Wireless Networking and Communications
p-ISSN: 2167-7328 e-ISSN: 2167-7336
2015; 5(2A): 1-5
doi:10.5923/c.jwnc.201501.01
Quantitative Comparison of Time Frequency Distribution for Heart Rate Variability Using Performance Measure
 Abstract
 Reference
 Full-Text PDF
 Full-text HTML
Noor Aimie-Salleh1, MB Malarvili1, Anna C. Phillip2
1Faculty of Biosciences and Medical Engineering, Universiti Teknologi Malaysia
2School of Sport, Exercise and Rehabilitation Sciences, University of Birmingham
Correspondence to: Noor Aimie-Salleh, Faculty of Biosciences and Medical Engineering, Universiti Teknologi Malaysia.
| Email: |  |
Copyright © 2015 Scientific & Academic Publishing. All Rights Reserved.
Heart Rate Variability (HRV) has been proposed as a promising non-invasive method to assess Autonomic Nervous System (ANS). The recent trend of analysing HRV, which is a non-stationary signal is using the Time Frequency (TF) analysis such as Time Frequency Distribution (TFD). However, the use of TFD is different for every application, therefore, comparison of TFD performance needs to be carried out to select the suitable TFD. The comparisons performed by previous studies were limited to visual comparison which is very subjective and could lead to error. Therefore, this paper presents an objective quantitative comparison using performance measure, M to select the suitable TFD that characterises HRV response during an Autonomic Function Test (AFT). The investigated TFDs are the Wigner Ville (WVD), Smoothed Pseudo Wigner Ville (SPWVD), Choi William (CWD), Spectrogram (SP), and recently introduced Modified B-Distribution (MBD). From the results, we conclude that MBD and SPWVD demonstrated the highest value of performance measure M, with p<001. MBD and SPWVD outperform other TFDs in terms of time-frequency resolution, cross-terms suppression, and number of TF components to represent the HRV response during AFT.
Keywords: Heart Rate Variability, Time-Frequency, Autonomic Function, Modified-B Distribution, Smoothed Wigner Ville
Cite this paper: Noor Aimie-Salleh, MB Malarvili, Anna C. Phillip, Quantitative Comparison of Time Frequency Distribution for Heart Rate Variability Using Performance Measure, Journal of Wireless Networking and Communications, Vol. 5 No. 2A, 2015, pp. 1-5. doi: 10.5923/c.jwnc.201501.01.
Article Outline
1. Introduction
- The autonomic nervous system (ANS) or autonomic function plays a major role in controlling and regulating the function of the human body. This identifies a crucial need for studies to reveal how it functions in order to understand its status. However, assessment of the ANS is challenging, because the autonomic structure is located far inside the body making it difficult to access directly [1]. In response to this difficulty, Heart Rate Variability (HRV) (i.e., the variation over time of the period between consecutive heartbeats) has been proposed as a promising assessment tool [2]. In order to investigate the relationship of the ANS and HRV, the Autonomic Function Test (AFT) was designed, so that observation could be performed [1, 3]. Like most biological signals, HRV is recognised as a non-stationary signal, where the frequency content of the signal varies over time. However, techniques previously designed for HRV during an AFT have been relatively inefficient, due to the assumption that HRV is a local stationary signal. To overcome the problem raised by this misassumption, time-frequency approaches have been suggested. Time-Frequency (TF) analysis provides time-localised spectral information for a non-stationary signal, as a distribution function in terms of time and frequency [4]. This technique allows for the analysis and characterisation of different HRV changes in response to the AFT. Time-Frequency Distribution (TFD) has been used in medical and clinical research to represent HRV [5-6] in time-frequency domain. For HRV during AFT, a few studies have been conducted that implemented TFD as their processing method. However, the use of TFD is different for every application; therefore, the best TFD that is able to characterise HRV needs to be selected. One study [7] compared four TFDs; Smoothed Pseudo Wigner-Ville Distribution (SPWVD), Short-Time Fourier Transform (STFT), Choi-Williams Distribution (CWD), and Discrete Wavelet Transform (DWT), to represent HRV, in response to both physical activities and an AFT [7]. From their visual observation, the SPWVD method is able to provide a high-resolution representation of the signal in both time and frequency. Another related study by [8] showed that the Choi-William Distribution (CWD) demonstrated the best graphical results and indexes during a Valsalva Manoeuvre; when compared with two other TFDs; Wigner Distribution (WD) and Spectrogram [8]. Recently, the Modified-B Distribution (MBD) was proven as a promising TFD to represent HRV, because it was able to produce high TF resolutions and was effective in cross-terms reduction for slowly varying frequency like HRV [9-10]. Since there is no TFD that can be accurately applied to all applications, the TFDs performance comparison needs to be carried out. As we can see, previous performance evaluations [7] and [8] are subjective, using visual comparison. This comparison method might be inaccurate because it is only based on visual observation and provides no quantitative data to be able to prove the reliability of the results. Therefore, in this study we will investigate and compare previously used TFD methods for AFT; i.e., SP, SPWVD, CWD, WD, and MBD, to identify the optimal TFD that characterises the changes of HRV during an AFT in terms of cross-terms reduction, TF resolution and number of TF components, by using a quantitative performance measure [11].
2. Method
2.1. Data Acquisition
- Electrocardiography (ECG) was recorded from 32 healthy participants (21 females) with no history of cardiovascular or neurological diseases. Sampling frequency was set up to Fs = 600Hz. The participants were non-smokers and not receiving any medication. The recording session was setup between 8.00am and 12.00pm. Participants were instructed not to consume heavy meals for at least three hours before testing, and were asked to refrain from ingesting beverages containing caffeine and alcohol.During the session, participant was first asked to lie down and relax for ten minutes. ECG was then recorded for five minutes in the supine position. Next, participant was instructed to stand upright and ECG was recorded for another five minutes in the standing position. Next, participant was asked to lie down again and relax for ten minutes. A further baseline ECG measurement was then taken for five minutes. Participants then immersed their left hand [12] into a 0-5°C water bath (to wrist level) for three minutes, followed by removal of the hand from the water, drying, and a continuation of the ECG recording for another five minutes [13]. The recorded ECG signals from each test were segmented into three minute periods in order to have a standard length of signal. The signals were then processed to quantify the HRV. The 50Hz power line interference was removed using a 2nd order Butterworth notch filter. The QRS waves were then detected using Pan and Tompkin’s algorithm. This method was chosen, because it was previously proven to detect 99.3% of adult QRS using the MIT/BIH database [14]. The R-R interval was resampled at 4Hz. The resultant HRV is shown in Figure 1. More information on these processes can be found in [15].
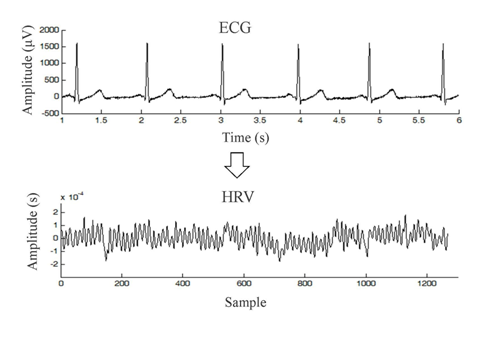 | Figure 1. The resultant HRV quantified from the ECG signal |
2.2. Time-Frequency Distribution
- In previous studies, several TFDs had been used to map the HRV from a time domain into a time-frequency domain. The choice of a suitable TFD depends on the application and signal characteristic of the studied signal. Quadratic TFD is one of the most popular classes of TFDs currently being used [4]. Quadratic TFD is based on estimating the instantaneous power spectrum of the signal, using a bilinear operator. The general equation for a quadratic TFD, is [4]:
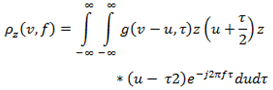 | (1) |
2.2.1. Wigner Ville Distribution (WVD)
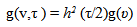
- WVD is the fundamental quadratic TFD [4], whose kernel filter is:
 | (2) |
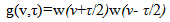
2.2.2. Smoothed Pseudo Wigner Ville Distribution (SPWVD)
- This TFD is improvised design of WVD and has a separable kernel expressed as:
 | (3) |
2.2.3. The Choi William Distribution (CWD)
- CWD has a 2D Gaussian kernel filter given by:
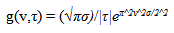 | (4) |
2.2.4. Spectrogram (SP)
- SP has a kernel filter that is represented as:
 | (5) |
2.2.5. Modified B-Distribution (MBD)
- MBD is one of the TFDs that can present a high TF resolution for a slowly varying signal such as HRV. The kernel for MBD is
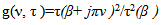 | (6) |
2.3. Performance Measure
- The performance of the resulting TFDs was compared using an objective quantitative measure criterion expressed as:
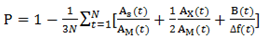 | (7) |
3. Result and Discussions
- All five positions from 32 participants - 160 data points were computed for the optimisation process. The computation was conducted using MATLAB software. ANOVA revealed a significant main effect of TFD method, F (4) = 517.15, p < .001, η2 = .93. There was no significant effect of condition between participants in different TFDs. The summary of this effect is presented in Figure 2. From this, MBD was significantly different to all other TFDs, p<0.001 except SPWVD (p = .36). In Figure 2, it can be seen that MBD and SPWVD are significantly higher than the other TFDs.
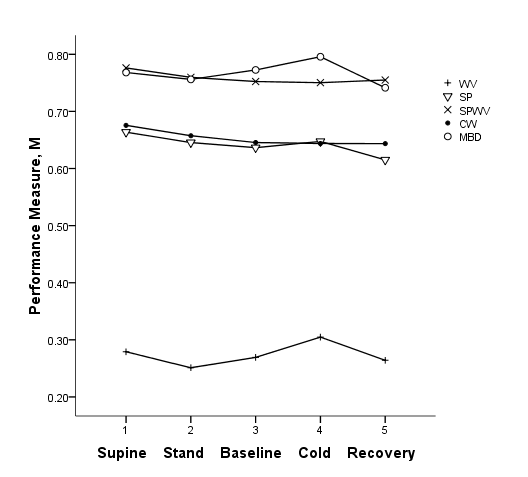 | Figure 2. Mean performance measure, M at five different conditions (supine, stand, baseline, cold pressor and during recovery) across five different TFD methods |
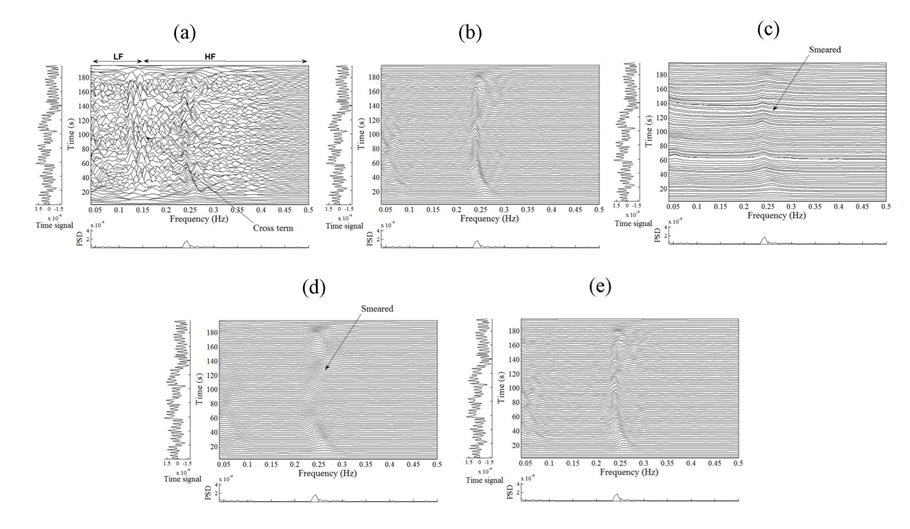 | Figure 3. TFD of HRV signal during hand immersion in cold water: (a) WVD, (b) SPWVD, (c) CWD, (d) SP, and (e) MBD |
4. Conclusions
- This study investigated and compared previously used Time Frequency Distribution (TFD) methods (i.e., SP, SPWVD, CWD, WD and MBD) to represent HRV during an Autonomic Function Test (AFT) using a quantitative performance measure. Among the five different types of TFD discussed, Modified-B Distribution (MBD) and Smoothed Pseudo Wigner Ville Distribution (SPWVD) outperformed other TFDs in terms of time-frequency resolution, cross-term suppression and number of time frequency components. Thus, this study proposes MBD and SPWVD as suitable TFDs that are able to characterise the changes of real life HRV during AFT in time frequency plot. Future research will focus on the feature extraction of Heart Rate Variability (HRV) utilising the proposed TFDs. These features then will be used in a wide scale of study such as in autonomic functioning and cardiovascular reactivity testing.
ACKNOWLEDGEMENTS
- This study is supported under a project funded by Research University Funding, Universiti Teknologi Malaysia (R.J130000.7845.4F473).