-
Paper Information
- Next Paper
- Previous Paper
- Paper Submission
-
Journal Information
- About This Journal
- Editorial Board
- Current Issue
- Archive
- Author Guidelines
- Contact Us
Journal of Mechanical Engineering and Automation
p-ISSN: 2163-2405 e-ISSN: 2163-2413
2016; 6(5A): 81-85
doi:10.5923/c.jmea.201601.15

Selection of Mother Wavelet for Wavelet Analysis of Vibration Signals in Machining
 Abstract
 Reference
 Full-Text PDF
 Full-text HTML
Anil Prashanth Rodrigues1, Grynal D’Mello2, Srinivasa Pai P.2
1Department of Mechanical Engineering, SJEC, Mangalore, India
2Department of Mechanical Engineering, NMAMIT, Karkala, India
Correspondence to: Anil Prashanth Rodrigues, Department of Mechanical Engineering, SJEC, Mangalore, India.
| Email: |  |
Copyright © 2016 Scientific & Academic Publishing. All Rights Reserved.
This work is licensed under the Creative Commons Attribution International License (CC BY).
http://creativecommons.org/licenses/by/4.0/

Wavelet analysis is a widely used time-frequency analysis applied in various fields in order to analyze wide range of signals. The challenge in Wavelet transform (WT) lies in selecting the most optimum mother wavelet for analysing the signals, as various mother wavelets applied on the signal may produce different results. This paper investigates the use of WT for analysis of vibration signals generated during high speed turning of Ti-6Al-4V. The effort is mainly focused on selection of a suitable mother wavelet for analysing vibration signals. Efforts are made to understand the behaviour of tool wear with number of passes during turning. Different techniques have been studied and compared for a suitable mother wavelet selection for use in WT for analysing vibration signals in high speed turning of Ti-6Al-4V.
Keywords: High speed turning, Mother wavelet, Tool wear, Wavelet transform
Cite this paper: Anil Prashanth Rodrigues, Grynal D’Mello, Srinivasa Pai P., Selection of Mother Wavelet for Wavelet Analysis of Vibration Signals in Machining, Journal of Mechanical Engineering and Automation, Vol. 6 No. 5A, 2016, pp. 81-85. doi: 10.5923/c.jmea.201601.15.
Article Outline
1. Introduction
- Now a day wavelet transform is increasingly used in vibration signal analysis for surface roughness evaluation, fault detection, tool condition monitoring etc [4, 7]. It can be effectively used to analyse the non stationary signals like those from machining. Also it has been broadly used in signal processing, image processing, quanta field theory, seismic exploration, speech recognition and synthesis, machine vision, machine fault diagnosis and monitoring, fractals etc [1]. Since the non stationary signals are difficult to analyze either in time or frequency domain, time-frequency domain which is a combination of both can be used. Vibrations occur between the tool and the work piece during any machining process. During machining of titanium alloys, the vibrations occur mainly due to self-excited vibrations between the work piece and the tool. There is a need for vibration signal analysis during machining of difficult-to-cut materials, such as titanium and its alloys [2, 3]. During vibration signal analysis, the results may be affected by the mother wavelet, as different mother wavelet produces different results. Hence to get accurate results, one has to get a suitable mother wavelet for analysing the vibration signals.
2. Materials and Methods
2.1. Work Material
- Figure 1 shows the experimental set up. The material used for experimentation is grade 5 titanium alloy (Ti-6Al-4V). Samples are taken in the form of 50 mm diameter and 200 mm length rods. The work material has the following chemical compositions in percentage of weight: Al – 6.02%, Cr – 0.03%, Fe – 0.13%, Mn – 0.04%, V – 3.85%, Ti – 89.93%. Insert used is uncoated carbide insert 883 (CNMG 12 04 08). The high speed turning experiments were carried out on a CNC turning centre (HMT make Stallion 100SU).
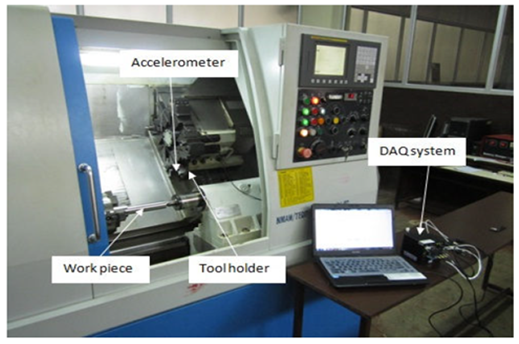 | Figure 1. Experimental setup for measurement of cutting vibrations |
2.2. Cutting Conditions
- Experiments have been carried out at different cutting speeds of 150, 175, 200 m/min, feed rate of 0.15, 0.2, 0.25 mm/rev and depth of cut of 0.8, 1 and 1.2 mm. Length of each cut is 48 mm (for one machining pass).
2.3. Measurement of Tool Wear and Vibration Signals
- Measurement of flank wear, nose wear and crater wear has been done after each machining pass using a Mitutoyo Tool Maker’s Microscope (TM 505/510) which has a magnification of 15X, with provision for measurement using two micrometers in horizontal and vertical directions with a least count of 0.005 mm. Experiments were carried out till the nose and flank wear reached the limiting value of 0.4mm. The cutting tool vibrations during the cutting process have been measured online using a Model 65-10 Isotron tri-axial accelerometer. The accelerometer senses the vibration signals in 3 different directions namely speed, feed and depth of cut directions (Vy, Vz and Vx respectively). The vibration signals at a sampling frequency of 10 kHz were sent to a DNA-PPCx, PowerDNA cube (UEI make). The conditioned signals were finally sent to a laptop with LABVIEW for further analysis and storage.
3. Analysis of Tool Wear
- This section gives a brief explanation on the variation of tool wear with number of passes, which has been analysed for different speed, feed and depth of cuts. Analysing the tool wear is necessary as we use the tool wear in one of the mother wavelet selection methods. During the selection procedure the correlation is made between the tool wear and the RMS value of coefficients of wavelet packets using different mother wavelets.
3.1. Tool Flank Wear Variation with Number of Passes for Different Speeds
- Figure 2(a) gives the tool wear variation with the number of passes for different speeds 150 m/min, 175m/min and 200 m/min by keeping constant feed rate of 0.15 mm/rev and constant depth of cut of 1.2 mm. It has been found that as the speed increases the tool wear rate increases, since the tool loses its strength at higher cutting temperature, that have been generated for higher cutting speeds. Hence due to the higher temperature of the cutting edge, the tool wear rate becomes very high. Jawaid et.al [4] observed similar observations in their work.
3.2. Tool Flank Wear Variation with Number of Passes for Different Feeds
- Figure 2(b) gives the tool wear variation with number of passes for different feed rates of 0.15 mm/rev, 0.2 mm/rev and 0.25 mm/rev by keeping speed and depth of cut constant at 200 m/min and 1.2 mm respectively. It has been found that the tool wear rate increased with increase in feed (7 passes for feed of 0.15 mm/rev and 6 passes for feed of 0.2 mm/rev and 0.25 mm/rev to cross the limit of 0.4 mm). It is also noted for 0.25 mm/rev feed, the tool wear suddenly increased and the tool was worn out at the 6th pass. The higher cutting feeds resulted in the higher temperature of the tool chip interface, there by leading to the plastic deformation of the tool. Jawaid e.al [4] made similar observations in their work.
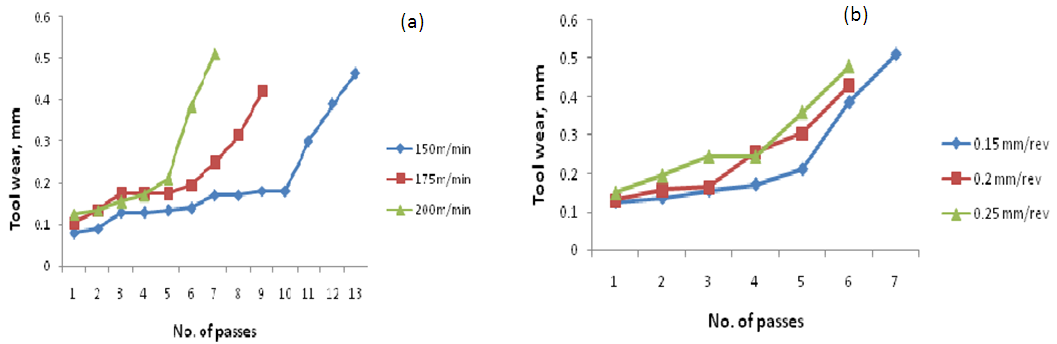 | Figure 2. Tool wear variation with number of passes: (a) for different speeds, (b) for different feeds |
3.3. Tool Flank Wear Variation with Number of Passes for Different Depth of Cuts
- Figure 3 shows the tool wear variation with number of passes for depth of cut 0.8, 1 and 1.2 mm by keeping speed and feed rate constant at 200 m/min and 0.15 mm/rev respectively. It has been found that there is a gradual increase in the tool wear for depth of cut 0.8 mm. For depth of cut of 1.2 mm, the tool wear suddenly increased after the 5th pass and increased till the tool wear reached its limiting value of 0.4 mm. For intermediate depth of cut of 1mm, the sudden increase has been found from 4th to 5th pass. There is an increase in rate of the tool wear as the depth of cut increases, which can be clearly observed.
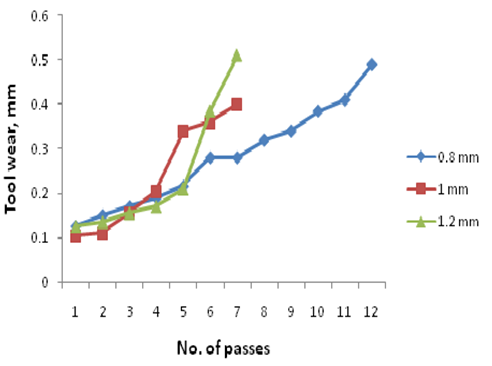 | Figure 3. Tool wear variation with number of passes for different depth of cut |
4. Wavelet Transform
4.1. Introduction
- Wavelet analysis is a new method for solving difficult problems in mathematics, physics, engineering etc. It analyses the low-frequency content of a signal with a wide duration function and conversely analyses high-frequency content with a short-duration function. It helps in decomposing a signal into different frequency (scale) components, and considers each one by translating (positioning) it along the length of the signal and simultaneously matches with the original signal. It gives the information about the signal both in frequency and time domains as it can be used to analyse non-stationary signals. Generally, it can be subdivided into Continuous (CWT), Discrete (DWT) and Wavelet Packet Transform (WPT).
4.2. Significance of Mother Wavelet
- Mother wavelet is a base for the analysis of a given signal in WT. The mother wavelet may differ from one application to the other. The selection is important, as the results obtained by applying wavelet transform will get affected by the mother wavelet selected. Hence one has to find out the degree of correlation between the signal and the mother wavelet.
4.3. Mother Wavelet Selection Methods
- The following three methods are discussed for mother wavelet selection.1. Correlation coefficient method- This method explores correlation coefficient
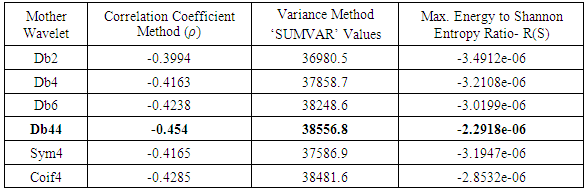
 that shows the degree of correlation between the wavelet coefficients and the tool flank wear. The base wavelet which maximizes the correlation coefficient value can be selected as the mother wavelet [6].2. Variance method- This is related to the variance of the wavelet coefficients. The one which has maximum value of the sum of variance of the wavelet packet coefficients (WPC) can be selected as mother wavelet [7].3. Maximum energy to entropy ratio criteria- This method deals with the combination of entropy and energy level in the signal which is a measure of uniqueness of the signal. The wavelet which gives the maximum value of energy to entropy ratio is selected as mother wavelet [8].The first two criteria use WPT and the third criteria uses DWT for analysis. 20 mother wavelets have been taken randomly from the 3 families of wavelets namely Daubechies, Coiflet and symlet available in the MATLAB wavelet tool box. The analysis has been carried out for three different cutting conditions and the result for one cutting condition has been shown in table 1.
|
4.3.1. Correlation Coefficient Method
- Correlation coefficient criterion is a useful criterion to correlate between the tool wear and the RMS values of WPC. The degree of correlation may differ from one mother wavelet to the other. Hence the wavelet which gives maximum degree of correlation has been selected in this study. Sukhomay Pal et.al [6] proposed the criterion based on the correlation coefficient between the root mean square (RMS) values of the wavelet packet coefficients (WPC) and the tool flank wear using acoustic emission signals. The best mother wavelet has been selected based on the highest value of correlation coefficient. A similar procedure has been carried out in this work for the whole experiment. The average of the RMS value of the WPC obtained at the 3rd level of WPT for each individual machining pass is calculated as Fi and the average of the RMS values has been calculated for the whole experiment as
 In the same way, average tool flank wear has been calculated for the whole experiment. The individual flank wear is measured during conducting the experiments. Finally a correlation has been made between the RMS values of WPC and the tool wear. Equation (1) describes the formula to find the correlation coefficient value.
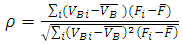 | (1) |
 flank wear of the individual pass of a whole experiment,
  Average of flank wear of all the passes of a whole experiment,
  Average RMS value of the WPC for an individual pass considering third level of the decomposition,
  Average of the RMS values of all the WPC for the whole experiment.The negative sign of the correlation coefficient indicates that there is a negative correlation between the RMS values of the wavelet coefficients and the tool wear it has been found that there is no change in the results obtained by changing the level of decomposition. Table 1 shows the sample results obtained for 6 mother wavelets. The db44 mother wavelet for all cutting conditions investigated resulted in the maximum value for correlation coefficient.
4.3.2. Variance Method
- In order to analyse the signal, we calculate different statistical values and variance is one of them. J. Rafiee et.al [7] proposed a mother wavelet selection method by calculating the variances of the wavelet coefficients using gear vibration signals. A similar effort has been made in this work. First, the signals obtained during individual machining pass have been decomposed up to the 3rd level of WPT. As a result of the decomposition, 8 packets have been obtained for the 3rd level and the individual packet contains finite number of coefficients. The variance value of each packet has been found out. Similarly, an effort was made to determine the variance value for other machining passes of the experiment. Let ‘n’ be the number of signals present in an experiment. The average of the variance has been made considering one node at a time for ‘n’ number of signals. Hence, there will be 8 averaged variance values for 3rd level of decomposition. Out of these 8 values, they considered 4 highest values, which have been summed up and as a reference this value is called as ‘SUMVAR’. The formula used to calculate the variance value is shown in equation (2):
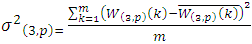 | (2) |
 is the mean of the WPC, p is the number of wavelet packets and m is the number of coefficients in each packet. The result obtained for this method shows that ‘db-44’ wavelet possesses the maximum ‘SUMVAR’ value. Sample results of 6 mother wavelets are shown in table 1.
4.3.3. Maximum Energy to Shannon Entropy Ratio Criterion (MEER)
- Kumar H.S. et al. [8] used a similar criterion for the bearing vibration signals using DWT. Here, the ratio of the maximum energy to Shannon entropy value was calculated for each mother wavelet and the mother wavelet which gives the maximum value of this ratio was selected as the mother wavelet. A similar effort has been carried out for machining vibration signals.First the dominant wavelet coefficient has been found depending on the maximum energy level. It has been found that the maximum energy level is obtained in the first level (cD1). The Shannon entropy value has been calculated with respect to each mother wavelet using the dominant wavelet coefficient (cD1). Then the ratio of the maximum energy value and the Shannon entropy value has been calculated for each mother wavelet. The sample results have been shown in table 1. The db44 resulted in the maximum value of this ratio. The energy ratio has been calculated using equation (3) which is shown below [8]:
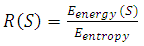 | (3) |
 the maximum energy value of the signal and
  is the entropy value of the dominant wavelet coefficient (cD1). On comparison of the three techniques, the third criterion (MEER) is faster and simpler in the application. Even though all the three criteria give the same result, this criteria is more efficient as it gives the result more quickly than other two techniques. Also the technique can be applied to any type of application. Whereas the correlation method is restricted to the particular application for example, we correlate the tool wear to the RMS value of the WPC in machining. Also the time required for the application is more when compared to other two techniques.
5. Conclusions
- This work is concerned with the selection of mother wavelet for the vibration signals captured during turning of Ti-6Al-4V alloy. First the tool wear has been analysed for speed, feed and depth of variations. It has been found that the tool wear rate increased with the increase in speed, feed and depth of cut. Further a suitable mother wavelet has been selected using three methods namely correlation coefficient method, variance method and maximum energy to Shannon entropy ratio method. From all of the three methods, the ‘db-44’ has been selected as the suitable mother wavelet for WT analysis of vibration signals in high speed turning of Ti-6Al-4V. Also it has been found that the selection of mother wavelet is not influenced by change in cutting condition and level of decomposition used by WT. On comparison of the three selection technique, it was found that maximum energy to entropy ratio method is faster, easier and simple to understand the procedure of the process than the other two techniques.
ACKNOWLEDGEMENTS
- The authors would like to thank AICTE, New Delhi for sponsoring this research project Ref. No.: 20/AICTE/RIFD/RPS (POLICY-1)/2012-13 under Research Promotion Scheme (RPS).