-
Paper Information
- Next Paper
- Previous Paper
- Paper Submission
-
Journal Information
- About This Journal
- Editorial Board
- Current Issue
- Archive
- Author Guidelines
- Contact Us
Journal of Mechanical Engineering and Automation
p-ISSN: 2163-2405 e-ISSN: 2163-2413
2016; 6(5A): 40-48
doi:10.5923/c.jmea.201601.08

Enhancing the Performace of an Automobile Service Industry: Lean Thinking Approach
 Abstract
 Reference
 Full-Text PDF
 Full-text HTML
Shreeranga Bhat1, Jnanesh N. A.2, Prashanth P. Kamath1, Rajat R. Nayak1, Nithin M. D’souza1
1Department of Mechanical Engineering, St Joseph Engineering College, Mangaluru, India
2Department Mechanical Engineering, KVG College of Engineering, Sullia, India
Correspondence to: Shreeranga Bhat, Department of Mechanical Engineering, St Joseph Engineering College, Mangaluru, India.
| Email: |  |
Copyright © 2016 Scientific & Academic Publishing. All Rights Reserved.
This work is licensed under the Creative Commons Attribution International License (CC BY).
http://creativecommons.org/licenses/by/4.0/

The objective of the research is to identify challenges in an automobile service center and to determine optimal solutions to improve the overall performance. More specifically the research has the following objectives: To increase the productivity using Lean strategy; To reduce the wastage, non-value added activities; To create an easy and simple work environment; To develop a 5S Auditing control system to sustain the improved process; To educate Janitorial level people about benefits of using Lean strategy. The research reported in this research is based on a single case study carried out in an organization using Lean PDCA (Plan-Do-Check-Act) approach, 5S tool and its applications to enhance the productivity. The root causes for the problem in the servicing of cars has been identified through the data based analysis at different stages in the research. The process parameters have been optimized and measured for sustainability in the process. Lean strategy resulted in reduced amount of energy and non-value added activities associated with its production processes. Further, research resulted in the creation of a visual workplace, which has enhanced the production atmosphere, and created a simple and easy process design to lay the foundation to a future of continuous improvement. As a result of this research, the productivity would increase by 15 cars/day, which would be a remarkable achievement for the organization. The research provides guidance to organizations regarding the applicability and importance of quality concepts. Organizations need to work continuously with development-orientated activities in order to survive; irrespective of how these activities are labeled. The research will also serve as a basis for further research in this area, focusing on practical experience of these concepts.
Keywords: Lean Thinking, PDCA, 5S, Automobile Service Industry
Cite this paper: Shreeranga Bhat, Jnanesh N. A., Prashanth P. Kamath, Rajat R. Nayak, Nithin M. D’souza, Enhancing the Performace of an Automobile Service Industry: Lean Thinking Approach, Journal of Mechanical Engineering and Automation, Vol. 6 No. 5A, 2016, pp. 40-48. doi: 10.5923/c.jmea.201601.08.
Article Outline
1. Introduction
1.1. Lean Services
- The service sector is concerned with the soft part of the economy; where people render their time, skills and technical know-how to enhance productivity and performance. Producing services require relatively less of natural capital but more of human capital than agricultural or industrial goods. In line with the global trend, service sector in India has also grown rapidly in the last decade. Its growth has in fact been higher than the growth in agriculture and manufacturing sector. It now contributes around 51 percent of GDP. In the trade mode, services trade has also grown at the same rate as goods trade over the 1990s (i.e., about 6.5 per cent) and its share in total trade has reached around 24 per cent [1].Guiding principles for Lean management include: • Defining value from the standpoint of the end customer.• Identifying each step in a business process and eliminating those steps that do not create value.• Making the value-creating steps occur in tight sequence.• Repeating the first three steps on a continuous basis until all waste has been eliminated.Working from the perspective of the client who consumes a product or service, "value" is any action or process that a customer would be willing to pay for. Lean also takes into account waste created through overburden ("Muri") and waste created through unevenness in workloads ("Mura"). Working from the perspective of the client who consumes a product or service, "value" is any action or process that a customer would be willing to pay for. The concept of Lean can be traced back to Japanese industries. Toyota was the first company to successfully implement Lean in their car manufacturing systems [2].Essentially, Lean is centered on making obvious what adds value by reducing everything else. Lean manufacturing is a management philosophy derived mostly from the Toyota Production System (TPS) (hence the term Toyotism is also prevalent) and identified as "Lean" only in the 1990s. TPS is renowned for its focus on reduction of the original Toyota seven wastes to improve overall customer value, but there are varying perspectives on how this is best achieved. The steady growth of Toyota, from a small company to the world's largest automaker, has focused attention on how it has achieved this success [3].Service processes tend to have long cycle times, many complex variables, multiple decision points and interactions with a variety of computer systems and much of the value-added work does often take place out of sight, in peoples’ minds that makes Lean philosophy and tools a great fit and can be of huge benefit for services industries. Since service processes are not physically observable, especially useful are tools like visual management that make otherwise invisible work processes visible, and techniques that specifically develop a team member’s creative problem-solving and critical thinking abilities to the fullest [4].
1.2. Background and Motivation
- The service sector is concerned with the soft part of the economy; where people render their time, skills and technical know-how to enhance productivity and performance. Producing services require relatively less of natural capital but more of human capital than agricultural or industrial goods. In line with the global trend, service sector in India has also grown rapidly in the last decade. Its growth has in fact been higher than the growth in agriculture and manufacturing sector. It now contributes around 51 percent of GDP. In the trade mode, services trade has also grown at the same rate as goods trade over the 1990s (i.e., about 6.5 per cent) and its share in total trade has reached around 24 per cent [2].
1.3. Problem Discussion
- Infrastructural needs in rural as well as urban areas are inadequate to cater to different industries. Problems like power and water shortage are still prevalent and are detrimental to the industry’s growth.Service sector has been considered as the fastest growing sector in the last decade and has contributed more than 57% of the GDP. Despite that, it has been responsible for the creation of only 25% of the total employment.Customer satisfaction is directly dependent upon the etiquettes and behavior towards the customers. These are the hallmarks of a good service industry.Unfair competition, lack of incentives, high interest rates, improper forecasting mar the growth of commerce.
1.4. Problem Formulation
- Value Stream Mapping has been used to define the problem. It has been used to analyze the current state and also to propose a future state. Value Stream Map takes into account not only the activity of the product, but the management and information systems that support the basic process. This is especially helpful when working to reduce cycle time, because one can gain insight into the decision making flow in addition to the process flow [3, 5].
1.5. Aim and Objectives
- Aim:To apply the concepts of Lean into service industry to reduce wastes and consequently improve the production time.Objectives:• To improve the productivity and performance of the system through Lean Principle.• To improve the bottom line status of any one product which has adverse effect on the system performance.
2. Case Study
2.1. About the Industry
- The organization is the first and Largest Dealership of Cars in India. Its parent company has nearly 75 years of experience in the Automotive Industry. The company has a strong culture of excellence in everything that it does. This has helped it earn tremendous loyalty from Customers, resulting in a large percentage of its business coming through references from the existing Customers. Today, it boasts of the largest network among all the dealers in Karnataka, with 5 Showrooms and 16 Sales Information Centers, 25 Workshops and 5 Showrooms for Used Car Sale. It has a team of over 2550 dedicated professionals committed to provide the best possible service to its customers.
2.2. Process Flow
- Arrival of the vehicle: The car arrives at the entrance of the plant. Here, a Service Advisor is allotted to that car, who registers the customer’s complaints, if any, into a logbook, known as a Job Card. A test drive is conducted, along with the customer to identify run-time issues with the car. The technical problems are explicitly jotted down in the job card and an estimated delivery time is notified to the customer. A supervisor oversees the operations that the car undergoes, during its time in the plant.Washing: The car to be serviced is sent to the first stage wash. This serves two purposes: i) scratches and dents made prior to the servicing of the car can be known; ii) since the whole body of the car is washed free of dirt, servicing can be performed with considerable simplicity.Drying: Washed cars are dried with a high velocity jet of air to speed up the evaporation process. The body and interiors are then wiped with a clean cloth to completely remove remnants of water and dust particles.Process at Bay: The next step is taking the car to an available bay for processing. For those requiring oil replacement, the car is lifted up using hydraulic jacks to expose the underbody. Once that is done, other functions like wheel removal, repair of axle and leak checking can be performed with relative ease.Inspection: The processed cars now need to be scrutinized for errors. Accordingly, the inspectors are assigned to check for the blunders that might have been overlooked during the process at the bay. A second test drive may be conducted if major repairs have been performed; which also necessitates the second-stage wash.Dispatch: Finally, after the inspector’s consent, the car is all set to be delivered to the customer by the agreed upon time limit. The customer’s billing and transaction takes place in the office.
3. Results and Discussions
3.1. Plan
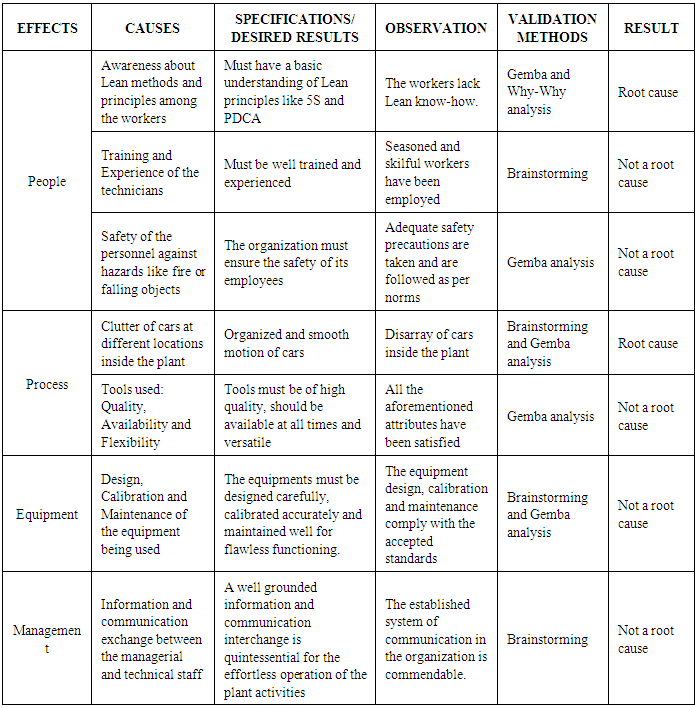
- The first phase of the research involved finding the key areas in which changes and improvements had to be made. The process of analysis consisted of discussion, observation and extensive brainstorming of problems and the possible causes. As a result of this, the problems existing and the root causes were found out by various Lean analysis techniques. The key areas to be focused and the problems discovered were: Redundant motion of cars; Excess inventory; Downtime due to spares shortfall.The first analysis was done to find the root cause of Redundant Motion of Cars. For this analysis after consultation with the people involved in the process a root cause analysis was created. The table was categorized under People, Process, Tools, Management, Equipment and Inventory [6]. The Root Cause Analysis is shown in Table 1.
|
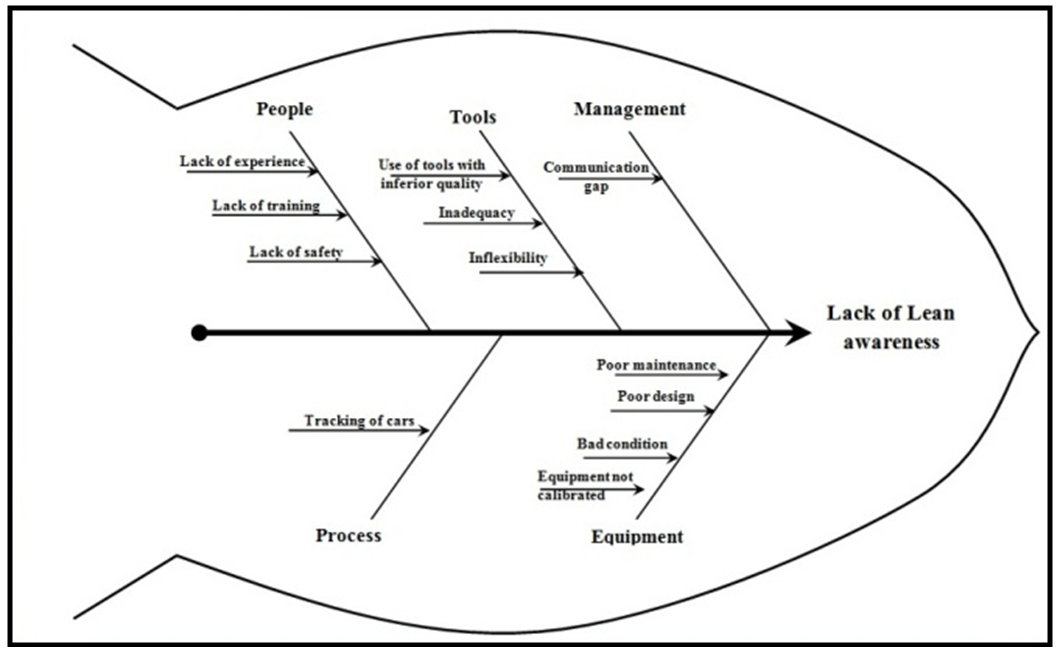 | Figure 1. Fish Bone Diagram for Lack of Lean Awareness |
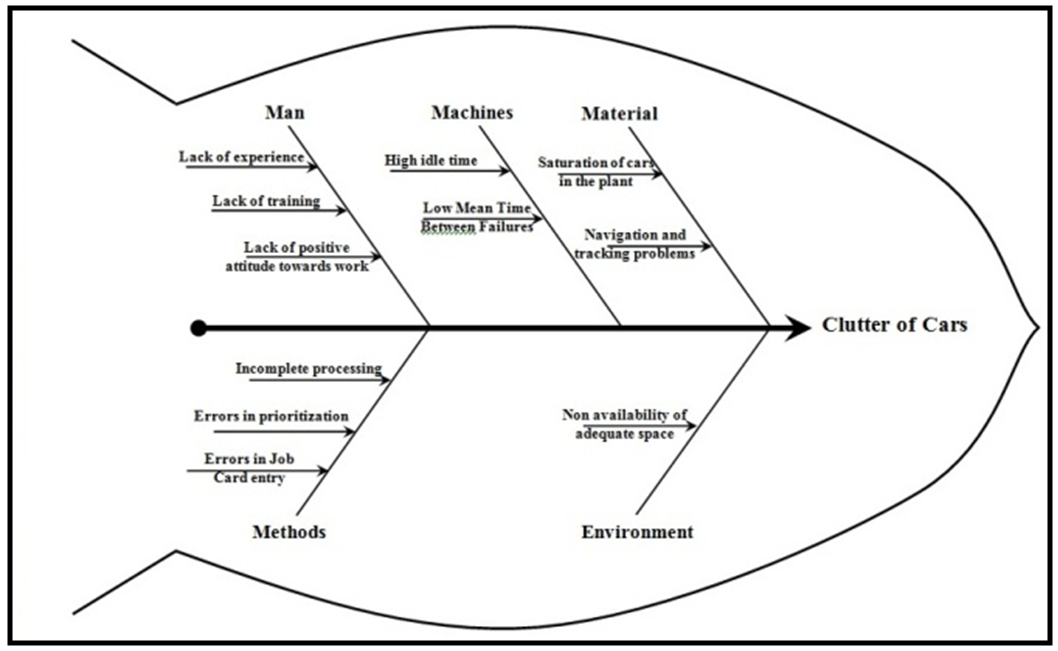 | Figure 2. Fish Bone Diagram for Lack of Clutter of Cars |
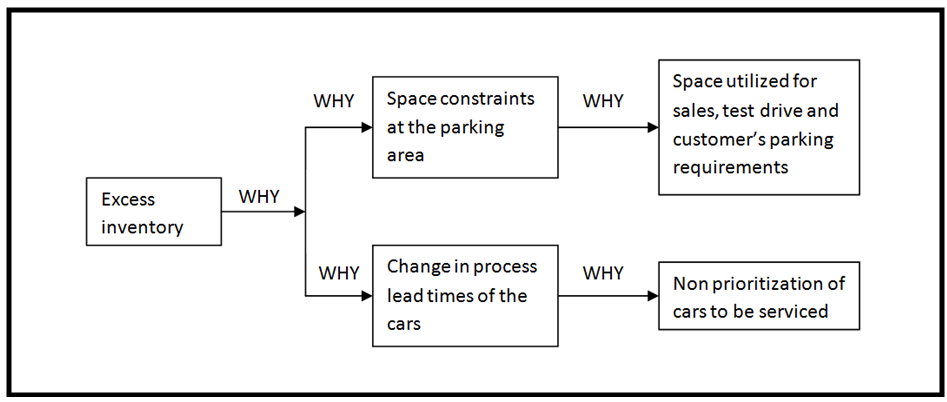 | Figure 3. Why-Why Analysis for Excess Inventory |
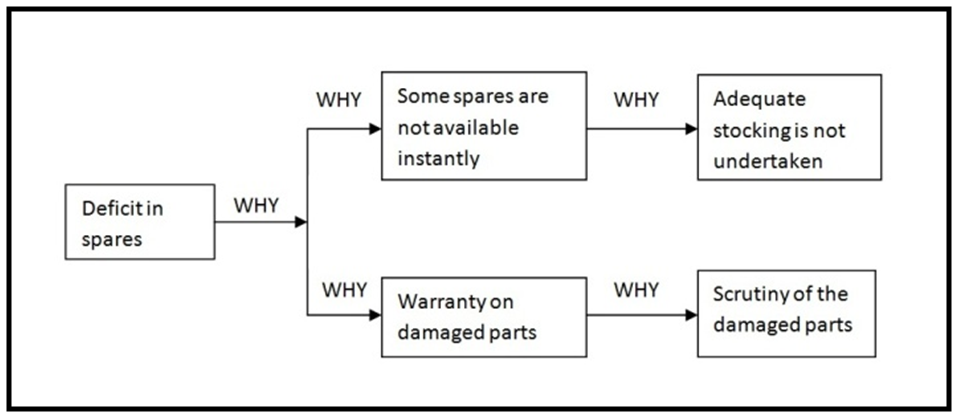 | Figure 4. Why-Why Analysis for Deficit in Spares |
3.2. DO
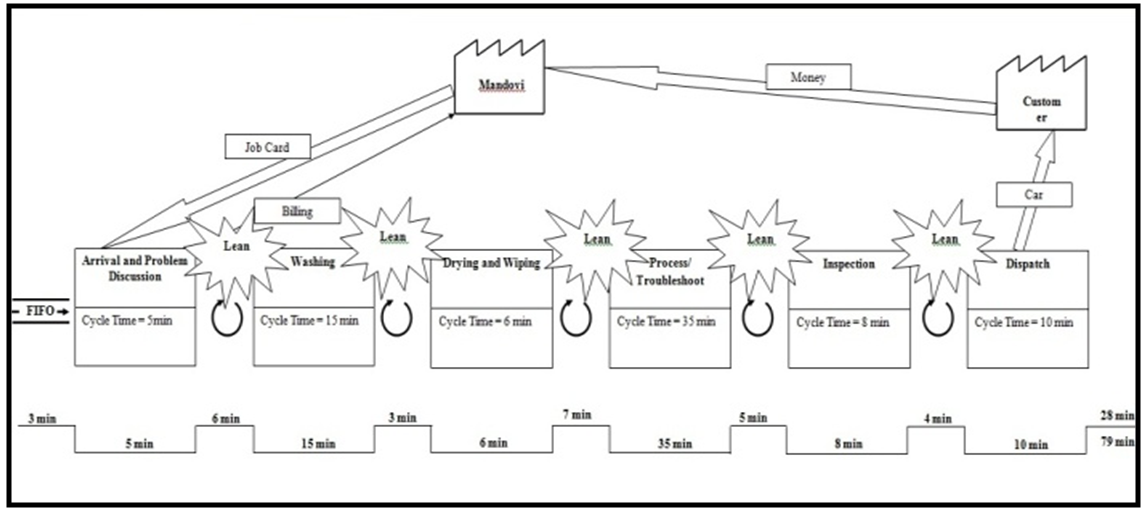
- The second phase in this problem solving cycle is Do. Following steps were taken as solutions to the causes found in the previous step.The first step to be performed is to prepare a Value Stream Mapping (Fig. 5), current layout (Fig. 6), and to analyze the current state start with the application of 5S and Visual Kanban. It was applied on all the concerned equipments and the cars not only in a particular section but also was incorporated in all the solution steps that were undertaken.
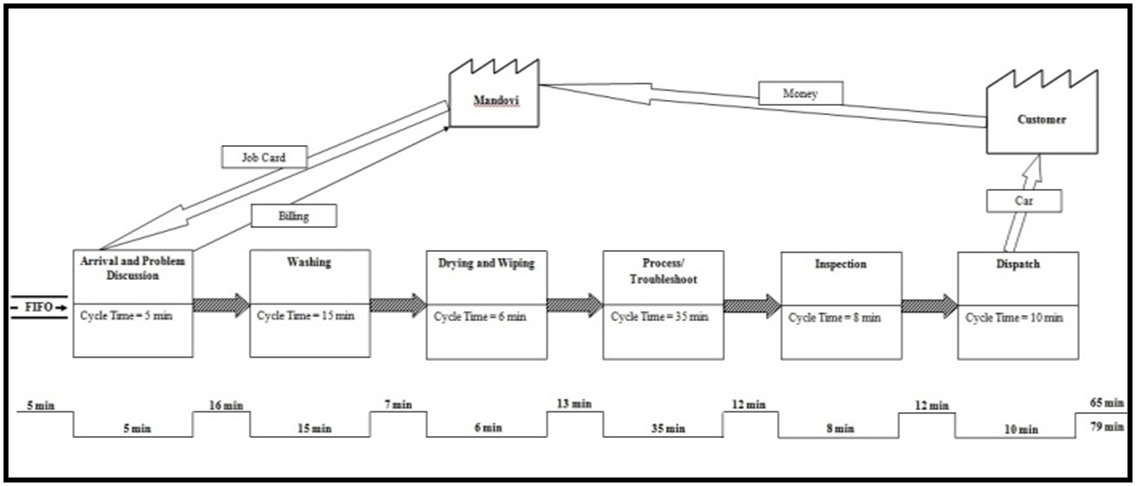 | Figure 5. Value Stream Mapping – Current Scenario |
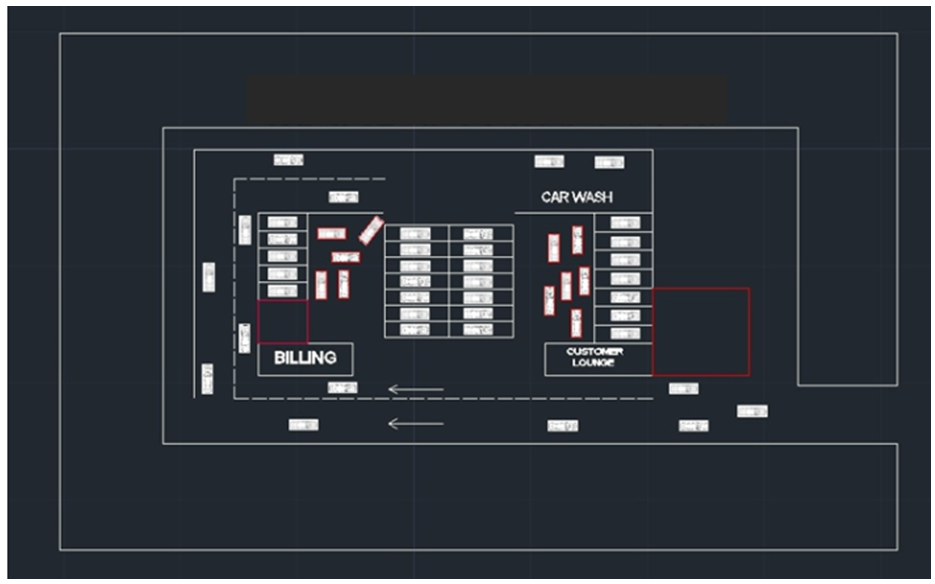 | Figure 6. Current layout |
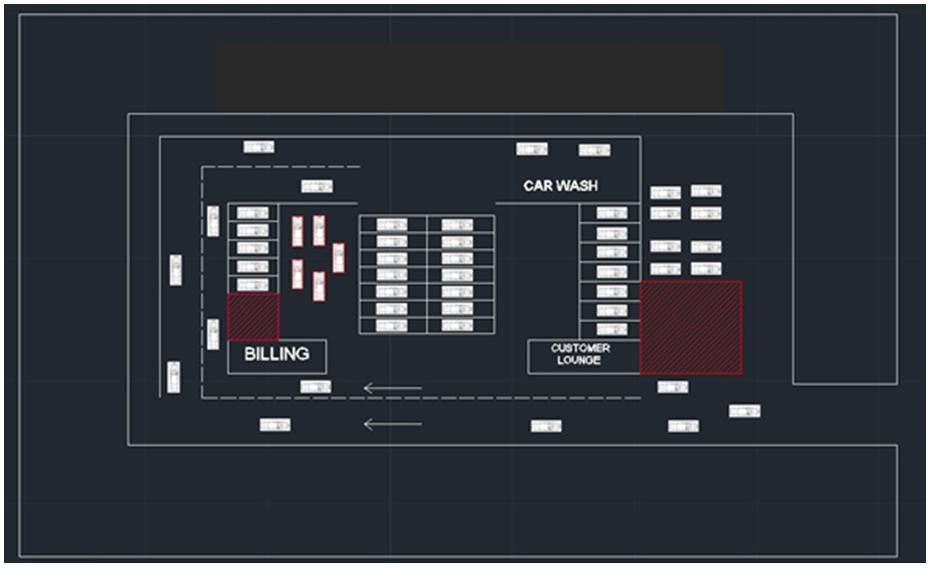 | Figure 7. New layout |
3.3. CHECK
- In the Check phase, researchers validate the changes made above using a software simulation. By using the concept of “Gemba” or real time observation, the process time of the car at each bay is determined. The reduction in the process lead time is determined using Gemba and Brainstorming. These values form the input to the model created to propose a future state (Fig. 8).
 | Figure 8. Value Stream Mapping – Future Scenario |
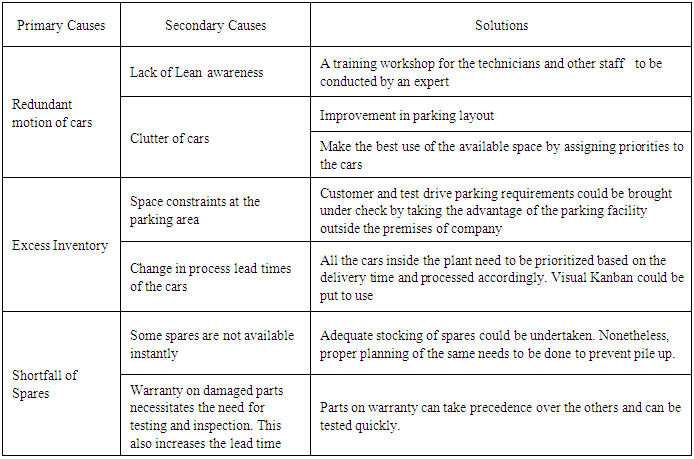
3.4. ACT
- All the changes have been recommended (Table 2) to be implemented on a permanent basis. The procedures for the standardization of the changes are being developed as per the rules and policies of the concerned organization. This phase also involves creating awareness among the factory personnel and all the concerned people about 5S, proper tool keeping methods, Cleanliness of the bay and simple Lean techniques [9, 10]. The various checklists were developed for standardization.
|
4. Conclusions
- The Lean concepts can be applied to any type of industry. This research proves that Lean approach can be applied, and followed in any automobile service industry. The key lessons learned during the research are summarizes as follows.• The application is very simple and can be implemented economically, as it does not require the involvement of highly skilled people. A simple training of the existing workforce for creation of awareness is needed.• The principle of 5S, which is a Lean tool, is an effective technique which serves as a doorway to continued improvement. The five steps once made understood give an immediate improvement by creating a visual workplace. It does not follow a single approach but a multidimensional use of productivity improvement techniques.• Lean manufacturing mainly involves awareness and involvement leading to a highly productive work environment. • The results of the study conducted have been verified and validated using computer simulation software (ARENA).The research has resulted in reduced traffic of cars inside the plant. A comprehensive implementation of the suggestions would result in an increase of up to 10 cars per day. The feedback given by the Company on its working is quite positive. Encouraged by its success, the Company has informed us that, they are planning to implement our other suggestions in Toto on pilot basis.