-
Paper Information
- Next Paper
- Previous Paper
- Paper Submission
-
Journal Information
- About This Journal
- Editorial Board
- Current Issue
- Archive
- Author Guidelines
- Contact Us
Journal of Mechanical Engineering and Automation
p-ISSN: 2163-2405 e-ISSN: 2163-2413
2015; 5(3B): 89-93
doi:10.5923/c.jmea.201502.18
Automation of Water Management System Using LabVIEW
 Abstract
 Reference
 Full-Text PDF
 Full-text HTML
Reuben Lasrado , Melroy Furtado , Anil Melwyn Rego , Prinson Veigas
Department of Mechanical Engineering, St Joseph Engineering College, Mangaluru, India
Correspondence to: Reuben Lasrado , Department of Mechanical Engineering, St Joseph Engineering College, Mangaluru, India.
| Email: |  |
Copyright © 2015 Scientific & Academic Publishing. All Rights Reserved.
Water resource management involves planning, developing, distributing and managing the optimum use of water resources. The current study attempts to automate the water management process in a beach resort using LabVIEW, a graphical programming language. The purpose of this study is to reduce water wastage and human effort by partial/complete automation of existing water management system. The current work uses LabVIEW environment for initial code development and simulation of the proposed system. The real time situation is modelled into a small scale prototype. Components are tested individually and then connected to form different subsystems. Subsystems are connected, monitored and controlled using LabVIEW. The given solution controls the water resources automatically leading to an efficient water management system. The system executes this task independently while reducing human labour with a slight increase in electricity usage.
Keywords: Water Management, LabVIEW, Automation
Cite this paper: Reuben Lasrado , Melroy Furtado , Anil Melwyn Rego , Prinson Veigas , Automation of Water Management System Using LabVIEW, Journal of Mechanical Engineering and Automation, Vol. 5 No. 3B, 2015, pp. 89-93. doi: 10.5923/c.jmea.201502.18.
Article Outline
1. Introduction
- Water is an essential part of almost all human activities: it is required in homes as well as in industries. Water is becoming a scarcer resource with each passing year, due to improper water allocation, inefficient use, unmonitored wastage and lack of overall water management [5]. In order to conserve and reduce wastage of water, we must plan and regulate the distribution of water.Water resource management involves activities such as planning, developing, distributing and managing the optimum use of water resources. Ideally, it must allocate water in such a manner, so as to satisfy all demands for water without wastage. The task of managing this activity increases in complexity with any change in factors such as the number of uses, number of sources or the seasonal availability of water. This complexity is further compounded due to the change in salinity of water in coastal regions during high summer, which renders a few sources of water unusable for a period during the year. This task becomes too challenging for a single person to handle effectively.This task is delegated to a machine in the current work, to automatically control the distribution of water to all required areas, while checking the potability of the water. Current systems, available commercially, lack the ability to monitor and distribute water, from multiple sources to multiple uses. Research is being carried out on microcontroller based water level sensing and controlling systems and also in the use of LabVIEW as feedback control [6]. Microcontroller based water controlling system developed by S.M Khaled Reza is used in a domestic environment. The system code is developed for the PIC16F84A controller. Code is stored and executed by the microcontroller [1].The current work is to develop an automated system, which controls the distribution and management of water, through an interconnected system of pipes; which allows for water to be taken from any source and given to any sump. This system is being developed for use on a local beach resort having an existing pipe layout, which will be incorporated into the final water management system. Current For this work, LabVIEW is selected to develop the initial code, carry out software testing and to execute during field operation. LabVIEW is selected due to its inherent parallel processing capability; since a block of code is executed as soon as it receives all the inputs [8]. This allows for easy parallel programming of the loops, in the monitoring and distribution functions. The Arduino development board is selected as a low cost, easy to use hardware interface. LabVIEW and Arduino communicate, through a plugin for LabVIEW, over a serial connection [7].LabVIEW is a system design platform and development environment for the visual programming language G. LabVIEW requires the user to draw blocks of code instead of writing functions. It connects different functions together through wires instead of variables. Unlike other programming languages, such as C or C++, which are executed in a sequence, LabVIEW executes a block of code as soon as all the inputs, for the block, are received. This is beneficial since it allows easy parallel process programming as shown in Figure 1 [8]. Parallel processing is required in the current work to carry out two main functions in tandem i.e. monitor and indicate levels of water in all sources and sumps and fill up a sump that is below required levels.
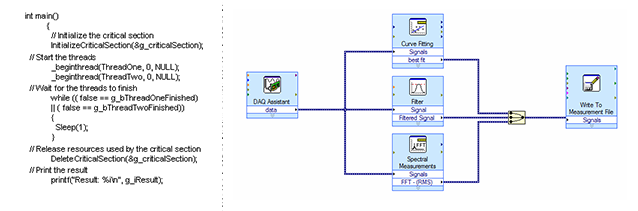 | Figure 1. Parallel Programming in Text Based Languages and LabVIEW |
2. Development Using LabVIEW
- The code is first developed and tested purely in software simulation of the system to eliminate any bugs or logical errors as well as to test the stability of the code to function continuously [2]. Figure 2 shows the interface used for testing, which is also used during real world testing.
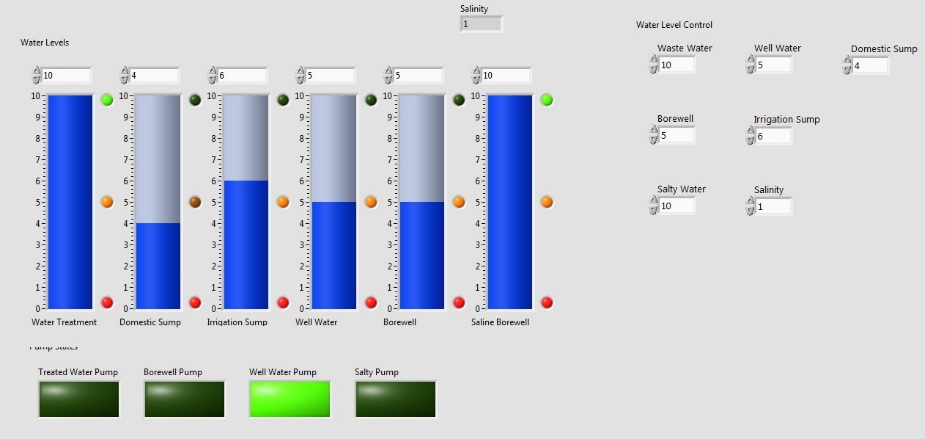 | Figure 2. LabVIEW interface used for software simulation |
2.1. Indicator Loop
- The function of this loop is to continuously check various parameters of the system.• High water level in source• High water level in sump• Low water level in source• Low water level in sumpThe levels of all sources and sumps are indicated on the screen as well as a physical output board which uses different colour LEDs. Figure 3 shows the flowchart of logic in the block of code.
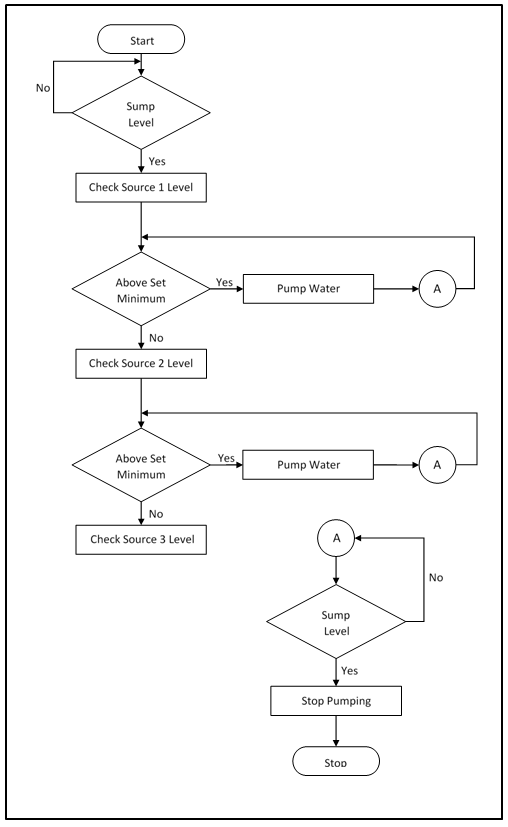 | Figure 3. System Logic Flowchart |
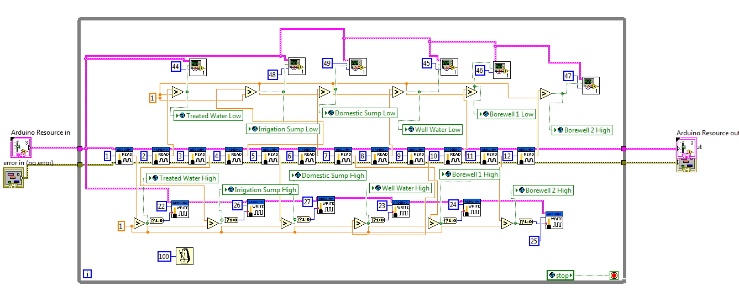 | Figure 4. Indicator Loop |
2.2. Irrigation Sump Check Loop
- The function of this loop is to check the level of water in the irrigation sump and maintain a required level of water in it. The minimum and maximum levels of water for the sump can be specified by the user. This loop consists of nested if statements which follow a specified priority of sources when drawing water.
 | Figure 5. Nested If Statements Checking Source Levels |
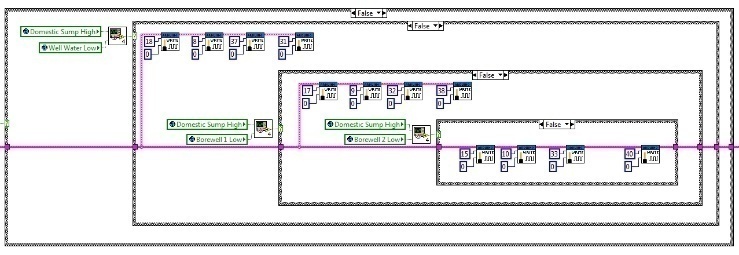
2.3. Domestic Sump Check Loop
- The function of this loop is to continuously check the level of water in the domestic sump. Like the irrigation sump check loop, the minimum and maximum levels of water to be maintained in the sump can be specified by the user. However, priority of checking the sources is different.Domestic Sump: Well → BorewellLike the irrigation sump, the preceding line indicates the order in which sources are checked when the level of water in the domestic sump is low. This water is kept for use in the rooms at the resort, hence treated water is not included in the source check list.The loop checks whether the level of water in the source being used is sufficient and if the sump is full. The condition of the condition block is only satisfied when the sump is not full and there is sufficient water in the source.When it is TRUE, the condition block turns on the required pump and electromechanical valves through the relay. Moreover, the loop turns on the pump and electromechanical valve LEDs to indicate that they are in operation.When it is FALSE, the condition turns off the pump, electromechanical valves and the respective LEDs of the previous source and then goes on to check the next source.
 | Figure 6. Domestic Sump Check Loop |
3. Hardware Set-up and Test Model
- Once the code has been simulated in software, the code is modified, in syntax, to now communicate with the Arduino. A small scale model is built to physically test the system. This is done to eliminate any problems resulting from physical phenomena, such as back EMF generated from the closing of relay switch and jittering of the relay if the water level is unstable.An output board is constructed to display the parameters such as water levels in the sources and sumps, pump states and electromechanical valve states. It can be mounted in a control room to allow the person in charge to assess the conditions of the entire campus from a single location.
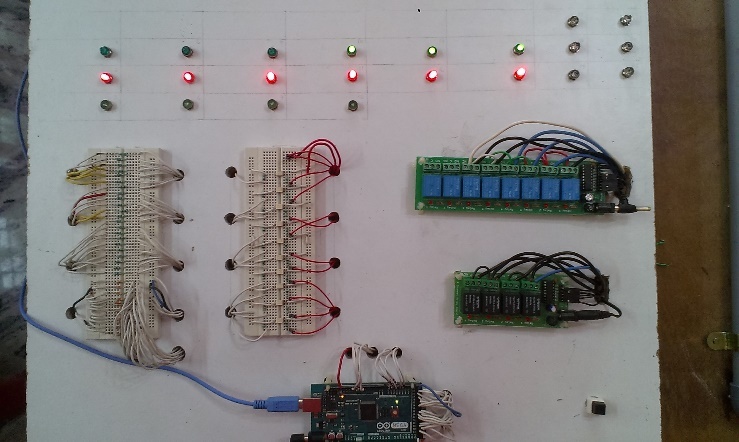 | Figure 7. Physical Output Board |
4. Conclusions
- Water is one of the most important basic needs of all living beings.It is becoming a scarcer resourcepartly due to huge amount of water being wasted by uncontrolled use. Existing water level monitoring systems lack functionality in terms of being able to monitor and manage multiple sources of water. The system developed carries out the desired task, effectively and reliably, which obviates the need for a human operator to be present continuously at the system. The minimum and maximum allowable levels of the source and sumps can be defined by the user. The code can be easily updated to integrate more sources or sumps into the system. The remote physical interface present in the system displays all necessary data in a single location.The system reduces human effort and water wastage at the cost of a small increase in electricity consumption. Modelling of the present system and implementation of the automation layer can be easily carried out. This system can be adapted for use in any industry, large or small, which has multiple sources of water or shortage of labour. In future revisions, features such as remote monitoring, code that adapts to different seasons, use of additional sensors and solid state relays and long term data logging can be added to the system.The code written for a particular season can be developed by studying the long term sensor data i.e. a particular source can be used less during summer or vice versa.Electromechanical relays produce back EMF when switching states. This can be avoided by using solid state relays which have proved to be more reliable and durable over a long period of time.