-
Paper Information
- Next Paper
- Previous Paper
- Paper Submission
-
Journal Information
- About This Journal
- Editorial Board
- Current Issue
- Archive
- Author Guidelines
- Contact Us
Journal of Mechanical Engineering and Automation
p-ISSN: 2163-2405 e-ISSN: 2163-2413
2015; 5(3B): 69-75
doi:10.5923/c.jmea.201502.14
Value Stream Mapping and Value Stream Design in a Complex Diesel Pump Production Flow: A Case Study
 Abstract
 Reference
 Full-Text PDF
 Full-text HTML
Sudhakar S.
Mechanical Engineering department, ITM UNIVERSITY, Gurgaon, India
Correspondence to: Sudhakar S. , Mechanical Engineering department, ITM UNIVERSITY, Gurgaon, India.
| Email: |  |
Copyright © 2015 Scientific & Academic Publishing. All Rights Reserved.
Value Stream Mapping refers to the process that involves the extraction of waste from production, manufacturing and corporate processes. This process is done with the use of identification and elimination or simply applying uniformity in the undesirable phases. The entire process is depicted using a flow diagram so that the current state of the complete operation can be reflected. In each phase, the non-value operations are fetched along with the identification of overhead of time as well as resources. The complete process or operation is investigated so that the minimum complexity can be achieved. With reduction in wastefulness the overall performance and throughput is increased in the proposed system. Using this approach, the redesigned and reformed process is having more efficiency and effectiveness.
Keywords: VSM, VSD, VAT, NVAT, FIFO, Current state map, Cycle time, Future state map, Lead time, Takt time, Value Stream Mapping
Cite this paper: Sudhakar S. , Value Stream Mapping and Value Stream Design in a Complex Diesel Pump Production Flow: A Case Study, Journal of Mechanical Engineering and Automation, Vol. 5 No. 3B, 2015, pp. 69-75. doi: 10.5923/c.jmea.201502.14.
Article Outline
1. Introduction
- Since 1980, the Toyota, Japan is having significant success rate with the use of Value Stream Mapping (VSM). This methodology is considered as one of the systematic approaches for identification and avoidance of the non value added time involved in the manufacturing process [7]. This approach was devised by the work of Tiichi Ohno, Toyota in the decade of 1960s and 1970s. Most recently, VSM is being used in the re-engineering processes as it involves the extraction and identification of avoidable resources and efforts to simplify the manufacturing process [5].The end-to-end cluster or collection of the activities which creates the value for customer is referred a value stream map [1]. The value stream indicates all the operations including value added as well as non-value based which are required for the product to be part of main flow which is essential in the production process. It involves transformation of raw material to the client end [4]. Classical symbols, terms and enhancement methods assist VSM so that it can be used as communication method including internal as well as in the external community space.VSM is an extraordinary device [10] that integrates the process in which visual map of the information flow as well as materials is there. The operation involves the state mapping for future point of view for higher performance, to minimize production cost and to achieve high integrity [14]. Using this approach, assorted parameters can be viewed including change over time, stage wise inventory, manpower, information flow and station cycle time. VSM assist and empower the organization to view the whole operation process in the current as well as futuristic state that devise the road map and path towards the prioritization or the projects and related tasks so that the gap can be shortened between current and the advanced state [4].To propose and defend the research work, a number of research papers were analyzed. Following are the excerpts from the different research work performed by number of academicians and researchers.The renowned academicians McDonald et. al. (2002), Lian et. al., (2002), and Abdulmalek et al. (2007) [1] simulate and integrate VSM for analyzing the actual usage and implementation aspects. A number of simulation suites including eVSM are available on Internet which allows the simulation of VSM to check the performance on multiple parameters. This software suite integrates the dynamic view which the real time behavior can be depicted and investigated for the proposed outcome. Using such products, the flexibility as well the availability of information can be improved a lot.Chitturi et. al (2007) describes the practical aspects like Takt time measurement, process improvements and the handling aspects using classical VSM. This work also explains the data collection issues and stages for improved performance.Grewal C. et. al (2008) [2] illustrates the lean methodology and the aspects by which VSM can be associated in small organization or company. This paper describes VSM as a dominant tool for identification of the problematic areas and the scope of improvements.Ibon (2008) [4] deem VSM as an effective and appropriate tool for redesigning the production scenarios.The electrical and electronics industry adopted the principle of lean manufacturing in the late millennia. Wong (2009) [5] who had studied the concept has considered various disciplines like inventory, work processes, scheduling, material handling equipment, customers, suppliers, employees, ergonomics, culture and management for the implementation.The concept for the creation of dynamic value maps of a system using simulation are presented in the paper by Petter Solding in 2009 [6]. By the creation of dynamic stream maps its plausible to analyze more complicated and canonical VSMs. The results can be visualized in the language the Lean Tools by VSMs.The Toyota production system utilizes an evolutionary and efficient technique that declines the overall cost and time taken while challenging every minute activity involved in the value stream. Ohno (1998) [7] had identified the concept and named the concept "Five whys" as to adding a why after each possible response and why to a particular activity it may be possible to understand the root cause of a problem and assistance is effective redesign.S. Vinodh, K.R Arvind, M. Somnaathan, 2010. [9] Paper represents the use of Value Stream Mapping as one of the Lean technique to minimize non value added activities and improved procedures and productivity in case of stiffer cam shaft assembly in India.
2. Objective of Present Work
- Improving quality, decreasing costs and fast delivery are necessary for the better system productivity thus it poses a great concern to the automotive suppliers these days. To remain competitive and to run the system with maximum efficiencies, the waste production from the value stream must be properly identified.A huge number of different types of products are produced in a small volume thus aiding to a process called production. Each production shop has a number of machine centers, each of which performing a fundamentally distinct type of activity. The overall cost of production is augmented by long queues, delayed delivery processes, unfair utilization of the working machinery and high load of work in process inventories. The goal of the current addendum is to utilize customized products which are produced in small batch sizes as per customer requirement thus supplementing global competitiveness.Manufacturing and processing the small sized batches leads to adjustment in production flow in different processing speeds as per the processes. To reduce the variability of processes including fault free production schema, additional pre processing of the material and to degradation in non value-added services like movement of raw material between various work processes an accurate and intensive monitoring is required thus aiding to competitive manufacturing.The identification and removal of waste by implementing the lean principle and Value Stream mapping the productivity of the current scheme is improved. This work focuses the attention on VSMs toolkit that assist in cutting lead timing, increasing the efficiency, quality and productivity of a company [13]. The goal of Value Stream Mapping in the working environment is to depict and degrade waste production during the process and thus showcasing the opportunities that impact the net production schema of a system [11].
3. Case Study
- A case an empirical case study is executed and accomplished in the live automobile industry Bosch India Ltd., Bangalore, India. A production line as opted for the present study in which the product titled Element is manufactured that is part of the diesel fuel injection pump. The sub assembly part involves Barrel and Plunger respectively. The client demand for this specific product is 1320 units per day and the takt time associated with the customer is 58.5 seconds every product.Around 150 products or items are in manufacturing process in that specific organization. The selection of inner wheel housing is done as it is one of the most vital products from the view point of safety and debacle issues.Takt Time = (Time Available ÷ Demand of the Customer) = 7.15 * 6.18 * 6 * 4 / 1320 = 12.92 s/itemPer Day Shifts = 3Working Days in the Organization = 27Network Time Slot per Day = 1320 Min.Per Day Forecast Demand (Max.) = 2390 unitsProduction Capacity (Per Day) =[350 * 2 * (2)] = 2100 units / day
3.1. VSM & VSD Methodology
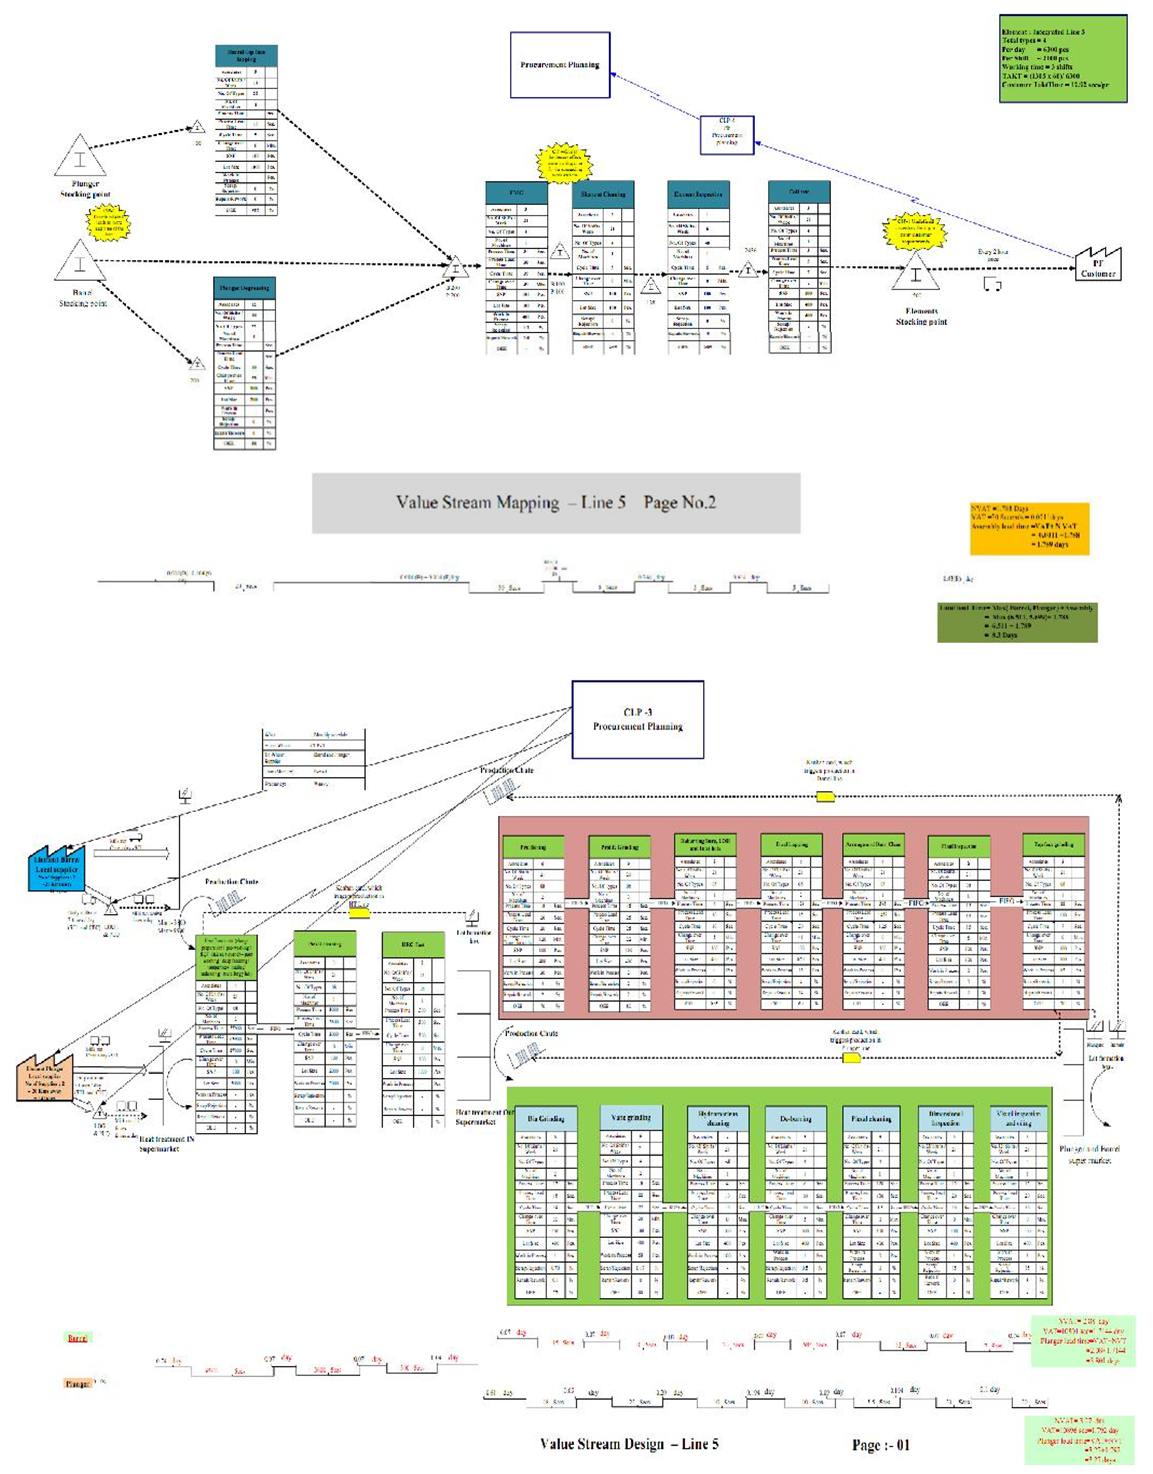
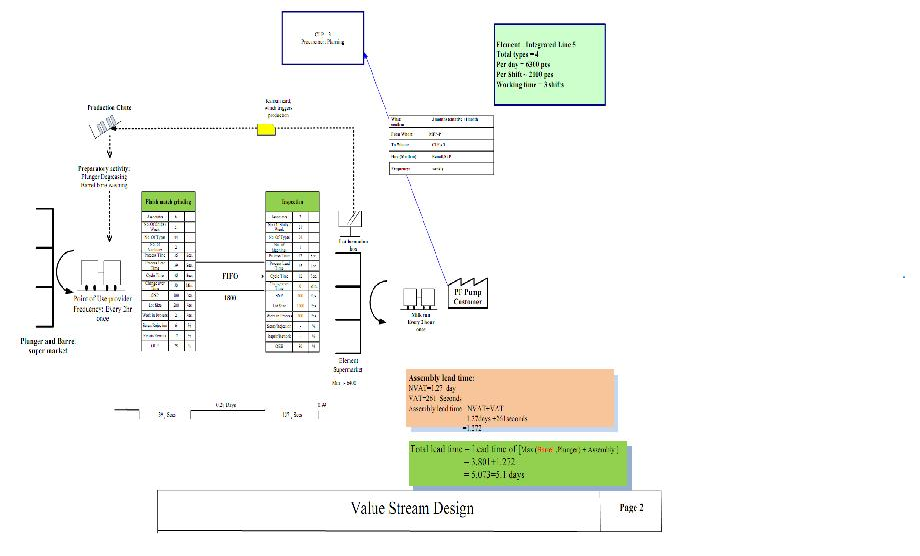
- To initiate the improvements in the production by identification of the superfluous entities and removal using lean principle, VSM is considered as the best tool as compared to others [12]. The VSM refers to the specialized tool with visualization that is diverted towards Toyota version associated with the lean manufacturing. It assists to comprehend and realize the uniform manufacturing process using lean manufacturing. The key purpose of VSM is the identification, demonstration and decreasing the waste in the manufacturing process. A number of steps are implemented for VSM integration and explained here.Step 1 – Define Value Stream (Choose Product Family): Selection of a product is one of the utmost important phase that is to be followed. Value stream will be maintained as per the customer requirements. Therefore mapping should be done for a single item or product (products of a family). Selection of product family (Part Number 9 411 038 341 9 411 038 321 9 411 038 322 9 411 038 323) that navigates via similar execution steps and the common tool involved in the processes are term as runner that is planned.Step 2 – Mapping of the flow of Material: Identifying the material flow beginning from purveyor to client. It involves the logging of the delivery frequency, quantities and then appending to VSM diagram which involves the drawing of material flow and information of suppliers for the decisive components.Step 3: Map the information flow: Information flow is drawn for production schedules, communication, interaction, ordering, and forecast.Step 4: Calculating the total lead time: Total Lead time gives the total time taken by a product to be processed from raw material to the finished element. It is found by adding the value added time and non value added time for each process. Value added time (VAT) is the time of work that actually transforms the product thereby increasing its value.Non value added time (NVAT) is the time the work spends in inventory or stocks. This time does not add any value to the product. In the VSM chart, two parallel lines are drawn. These were divided corresponding to the number of inventories and processes. For each process, the lead time was noted down as VAT on the lower line in seconds. For each inventory, the inventory size was divided by the demand to give the NVAT in days.Total lead time for each process was calculated by adding the VAT and NVAT and was obtained in days. The total process lead time was found by adding the maximum of the lead times of barrel and plunger to the element lead time. After the mapping of process and information flow, the completion of the data boxes are completed, inventories are collected taking into the details of supply, delivery, internal milk run, total lead time. The value stream mapping is completed after putting all these data together. For the Cur- rent Value Stream Map, calculated the individual lead times for the barrel, plunger and assembly processes are calculated. Analysis of the VSM chart is done to identify sources of waste and points for improvement. These are marked on the VSM chart as CIP (Continuous Improvement Process) flashes. After documentation of the current state, identification of the value stream metrics is carried out which helps to achieve the future state goals. Lean metrics provide tools that help to drive continuous improvements and waste elimination. Some of the lean metrics identified are Total value stream WIP in days, Total value stream lead time in days. Total value stream WIP is calculated considering the entire inventory on hand between successive work stations from raw material to finish goods within the value stream line 5 followed by calculating Total lead time, for this WIP is converted to days by using customer demand per day and all individual process cycle time. Large inventory sizes between each process causes increase in NVAT, which was found in Barrel process is 5.71 days, Plunger process is 5.079 days & Assembly process is of 3.10 Days.Therefore, Total lead time = maximum (Barrel, plunger) + assembly process lead time = maximum (5.71 days, 5.079 days) + 3.10 days = 8.81 days.The total lead time arrived alone is 8.81 days, this is equal to one week working inventory. From the VSM it is observed that the value added time is 1.411 days. This suggests that there is tremendous scope for improvement. After mapping the current situation of the line, it is proposed to improve the present conditions to achieve an optimal state, by reducing manufacturing lead time, work in process and bottleneck in the line with the help of lean principles.Part of this process involves identifying the lean tools such as finish goods super market and improvement methods such as 5S and quick change over ensuring to meet quality and delivery requirement to customers. Before starting the value stream design, a brain storming is done with planners to understand the hidden waste existing in the line. In the process of fulfilling the objectives of this study, steps are taken to improve are■ Determining the takt time for customers future demand.■ Determining the existing capacity of the line■ Deciding whether safety or buffer stock is required.■ Determining the necessity of supermarket to meet customer demand■ Determining which improvement methods to be used. By analyzing the data gathered from VSM and VSD, it is found that in process inventories which is present between the workstations, is the cause for more lead time of the line and also no clear information is there for the preceding workstations, as required by the succeeding workstation.Some of steps that has been used are:Ancillarisation (outsourcing) of plunger soft stage and converting all plungers to STL can reduce the Lead time.FIFO (First in first out) implementation between different inspection stages to eliminate inventories between these processes.Increasing the milk runner frequency between Heat treatment plant and logistics department to reduce piling up of stocks.Removal of unwanted inventories at the end of the last process in each stage by placing super market.Due to large changeover time in processes such as barrel pre-honing and FMG, capacity of the line is low. Use of a spare machine to take the load during changeover will help maintain production and improve capacity and the same is represented in the future information flow diagram as shown in figure 1.
4. Results and Discussion
- When cycle time for each process is compared with takt time it is found that cycle time of final assembly process exceeds the takt time so there is need to improve the process capability of finish match grinding process to meet the demand of customer within the time.So it can be improved by using various lean tools but here we are improving the cycle time of finish match grinding process by finish goods super market, FIFO system & increased milk run frequency leads to reduction in total lead time of assembly process with the help VSM and VSD (Figure 1 and figure 2).
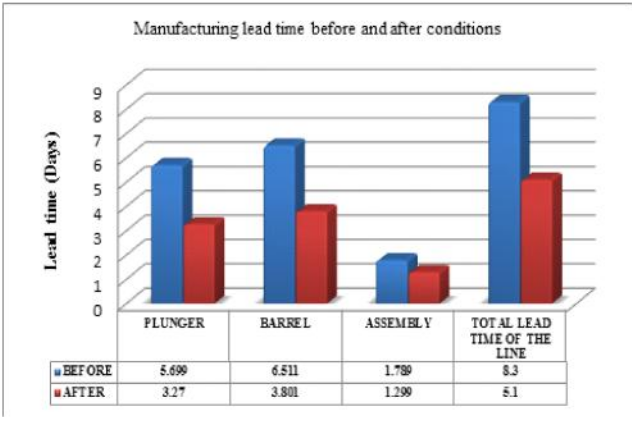 | Figure 1. Shows the lead time of plunger, barrel & assembly loop before and after conditions |
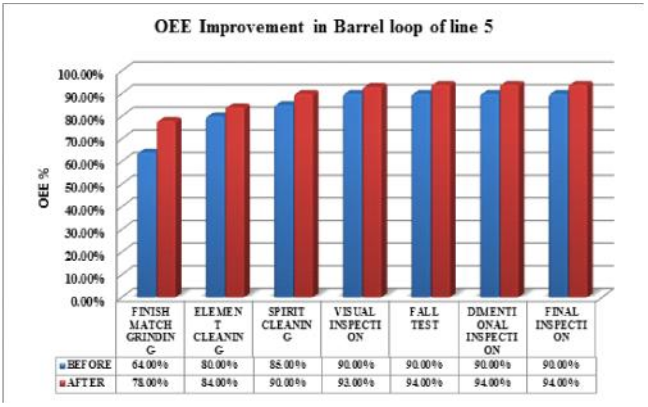 | Figure 2. OEE improvements in assembly loop of line 5 |
|
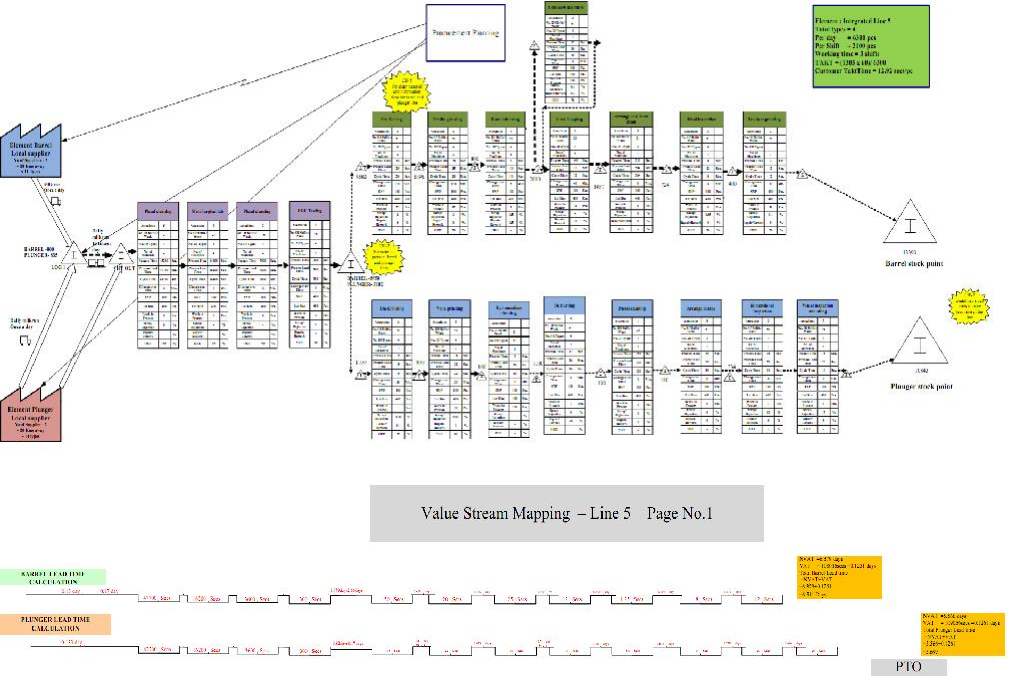 | Figure 3. Value stream mapping of line 5 part-I and part-II |
 | Figure 4. Value stream design of line 5 part-I and part-II |
 | Figure 5. |
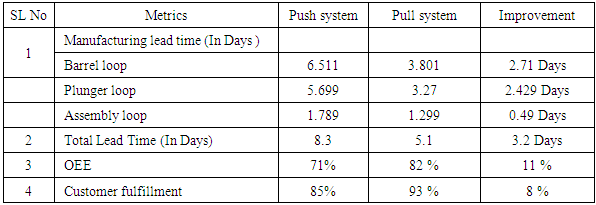
5. Conclusions
- The use of value stream mapping and value stream design to control production has been widely practiced by Japanese for simplicity and visibility it offers on the shop floor.However it special skins and clear understanding of manufacturing system to interpret value stream map and to difine the future improved value stream design.In this paper, the role of VSM and VSD in a JIT production system was discussed in the context of maintaining a minimum level of in-process inventory level. A case study model is presented to better aid planners to identify hideen wastes in the shop floor at each workstation in the system.After carrying out the implementation of pull system in line 5 of element manufacturing department of Bosch India ltd, the many improvements in the line is achieved. Present study used the method of calculating the number of kanbans for pull system implementation considering the effect of bottleneck in the line, OEE and lot size conceptualization. VSM and VSD techniques used in the line helped to identify the hidden waste present in the production shop floor. From these results, the following conclusions are drawn.The manufacturing lead time of the line 5 i.e. plunger, barrel and assembly loops lead times are greatly reduced by implementing kanban system with the help of value stream design. The total lead time in the line reduced from 8.3 days to 5.1 days, leading to 39% reduction in manufacturing lead time.Implementing FIFO principle in line 5 reduces in process inventory in between the workstations of the line, thereby avoiding the effects of bottlenecks in the line.The present work reveals VSM and VSD techniques are required to identify the hidden wastes, present in the production shop floor.Reduced lead time and minimizing the effect bottlenecks in the line helps to achieve better production output, which enables the line to cater to the customer demand more efficiently. There is an increased customer fulfillment by 8%. Due to the impact of improved material and information flow in the line, there is no waiting for the material in the work stations, which minimizes the number of changeovers in the machines, this increasing OEE of the machines by an average of 6%.Lean production means continuous improvement, we must keep on changing future state into current state that will not end during our life. VSM have been proven to be a greatly useful tool to eliminate some waste in a cycle and find there are more waste for you to eliminate in next cycle, during which lean becomes a habit or culture.