-
Paper Information
- Next Paper
- Previous Paper
- Paper Submission
-
Journal Information
- About This Journal
- Editorial Board
- Current Issue
- Archive
- Author Guidelines
- Contact Us
Journal of Mechanical Engineering and Automation
p-ISSN: 2163-2405 e-ISSN: 2163-2413
2015; 5(3B): 64-68
doi:10.5923/c.jmea.201502.13
Investigation on Cutting Force and Vibration Signals in Turning: Mathematical Modeling Using Response Surface Methodology
 Abstract
 Reference
 Full-Text PDF
 Full-text HTML
Vishal Wayal , Nitin Ambhore , Satish Chinchanikar , Virendra Bhokse
Mechanical Engineering Department, Vishwakarma Institute of Information Technology, Pune, India
Correspondence to: Vishal Wayal , Mechanical Engineering Department, Vishwakarma Institute of Information Technology, Pune, India.
| Email: |  |
Copyright © 2015 Scientific & Academic Publishing. All Rights Reserved.
This paper explores the effect of cutting parameters on force and vibration signals. Force and vibration signals are captured in three mutually perpendicular directions. Experimental results shows that the magnitude of tangential force is largest followed by feed force and radial force. Vibration signal measured along tangential, feed, and radial direction also shows the same chronological order like cutting force. It has been observed that cutting forces and vibration signals, especially measured in tangential direction are most sensitive. These signals vary linearly with increase in feed and depth of cut. Also it has been observed that cutting forces decreases with increase in cutting speed. Vibration signals, especially in the feed direction and radial direction negligibly vary with increase in cutting speed. Moreover at higher cutting speed, vibration signal increases. Empirical equation considering three components of cutting force and vibration signals are developed using response surface methodology for better understanding.
Keywords: Cutting forces, Vibration signals, Response surface methodology (RSM)
Cite this paper: Vishal Wayal , Nitin Ambhore , Satish Chinchanikar , Virendra Bhokse , Investigation on Cutting Force and Vibration Signals in Turning: Mathematical Modeling Using Response Surface Methodology, Journal of Mechanical Engineering and Automation, Vol. 5 No. 3B, 2015, pp. 64-68. doi: 10.5923/c.jmea.201502.13.
Article Outline
1. Introduction
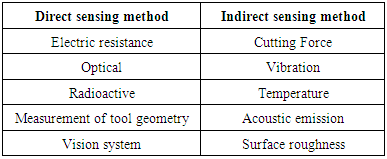
- Various methods have been used to develop tool condition monitoring system (TCMS). In fact, literature on the subject of TCMS has amounted to hundreds of research papers in the last few decades. But, very few of them focused on vibration of cutting tool. Tool condition monitoring system is one, which gives the condition or the early detection of breakage of the tool. These are generally based on the sensory information to estimate the condition of the tool [1-2]. The machining process is complex phenomenon and it is unavoidable [3]. Vibration phenomena in metal cutting demonstrate the abnormalities occurring during metal cutting, and troubles of machine tool itself. The immediate result of irregularity in machining generates vibrations, which ultimately enhances the tool wear and surface roughness of the work piece. The measure of tool wear progression and surface roughness during cutting can effectively determine the tool condition [4]. Cutting force is generally considered one of the most significant variables in the turning process [5]. It has been widely recognized that variation in the cutting force can be correlated to tool wear [6, 7]. Tool dynamometers are commonly used to record these cutting forces [8]. However, dynamometers are not suitable instruments for shop floor use due to their high cost, negative impact on machining system rigidity, geometric limitations and lack of overload protection [9]. Therefore, a low-cost system for measuring cutting forces is necessary. Recently, Scheffer and Heyns [2] used a simple sensor-integrated tool holder using strain gauges; Bhuiyan et al [3], uses low cost sensor for getting the different signal from the turning process. Selection of right sensor from a number of available sensors is crucially important. Authors use combine application of acoustic emission signals and vibration signals to monitor the condition of tool. [10]. Abouelatta and Madi [12], in their research developed a mathematical model using regression analysis for the surface roughness predictions based on cutting parameter and tool vibration. Also, Kasab and Khoshnaw [13], in their study investigated the correlation between surface roughness and cutting tool vibration in turning. From the literature, it has been observed that variety of signals can be captured to monitor tool wear. There are two methods of condition monitoring which are mostly used to predict conditions of tool are presented in Table 1.
|
2. Material and Design of Experiment
2.1. Material and Cutting Condition
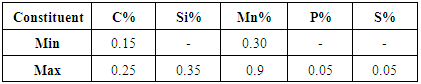
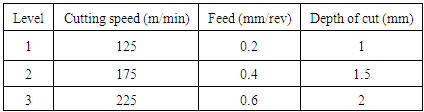
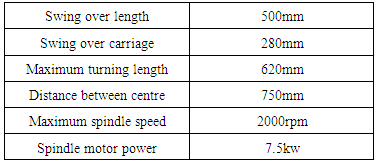
- The right choice of tool-work-piece combination with appropriate cutting condition is important for particular turning operation. In this investigation, turning operation is performed on CNC simple turn 5075 machine. The work-piece is a round bar (40mm diameter and 250mm long) of mild steel (AS1443) (Figure 2.). The chemical composition of mild steel is presented in Table 2. The aluminium oxide coated tungsten carbide, type: CNMG 120408-M5 tool insert (Figure 1.) and PCLNR 2525M12 (Kennametal, India) tool holder assembly have been used as cutting tool arrangement. Experiments are planned using central composite rotatable design (CCRD) matrix varying the cutting speed, feed and depth of cut. The experiments have been conducted in dry cutting mode for this investigation. Tool work-piece combination have significant role on cutting forces and vibration signals. The cutting conditions are presented in Table 3.
 | Figure 1. Actual Photograph of Cutting tool Insert |
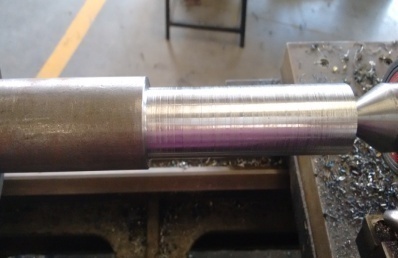 | Figure 2. Actual Photograph of Work Material |
|
|
3. Experimental Details
3.1. Experimental Set-up
- Experimental set-up mainly consists of the CNC machine, FFT analyser, digital tool dynamometer, and accelerometer and tool dynamometer sensor. Digital tool dynamometer sensor and accelerometer is mounted on tool holder as close to cutting tool insert. Figure 3 shows the actual photograph of the experimental set-up.
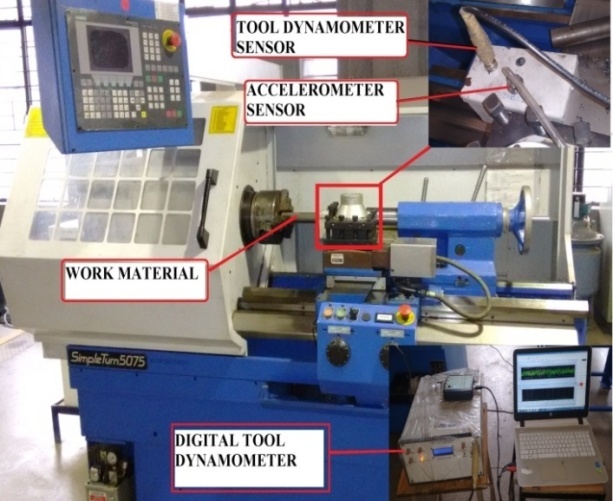 | Figure 3. Actual Photograph of the Experimental Set-up |
3.2. Experimentation
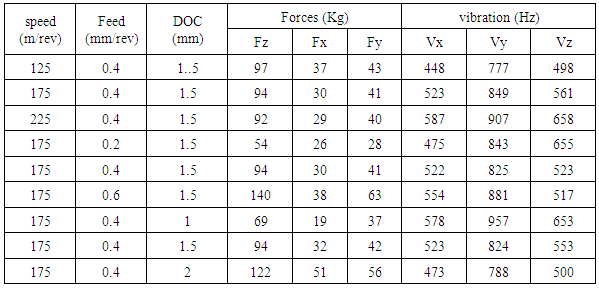
- Mild steel of 40mm diameter is used to perform experiment on CNC simple turn 5075 machine. It has high degree of accuracy and rigidity. Turning is carried out in nine different cutting conditions as shown in the Table 4. Experiments are conducted as per CCD. The aluminium oxide coated tungsten carbide, type: CNMG 120408-M5 tool insert and PCLNR 2525M12 (Kennametal, India) tool holder assembly have been used as cutting tool arrangement. Tool insert has properties of high toughness, high temperature sustaining capacity and wear resistance. Mild steel bar of 40mm diameter is mounted in CNC chuck. The bar is stepped in 20mm length of 9 part (total length=180mm). In this investigation fresh cutting edge is used for each cutting speed, depth of cut and feed rate combination. Digital tool dynamometer sensor and accelerometer is mounted on the top of tool holder to measure level of vibration signal and value of cutting force. During experimentation both FFT and digital tool dynamometer captured vibration and force signal in three mutually perpendicular direction i.e. tangential, feed and Radial direction.Further analysis of vibration signals are carried with the help of FFT analyser along with RT-Pro photon software.
|
4. Result and Discussion
- Nine experiments are carried out to capture cutting forces and vibration signals in three mutually perpendicular directions. For each experiment fresh cutting edge is used. Captured three components of cutting forces and vibration signal used to analyse the different occurrences. For each combination of cutting speed, feed rate and depth of cut the output results of cutting forces and Vibration signals in tangential (Vz), Feed (Vx) and Radial (Vy) direction are presented in Table 5.
|
4.1. Mathematical Models
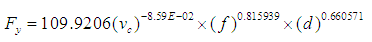
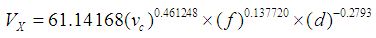
- Considering the cutting force and vibration signals values as output and cutting parameter as input it is possible to develop the mathematical model. This mathematical model is developing by the response surface methodology (RSM) technique. It can be assumed that the equation below demonstrate relationship between dependant variable Fx, Fy, Fz ,Vx, Vy and Vz and independent variables cutting speed, feed rate and depth of cut. All these equation have the
 value more than the 0.9 and it is adequate to give the better results. Further analysis of data is done with the help of these equations.Feed force (Fx)
 | (1) |
 | (2) |
 | (3) |
 | (4) |
 | (5) |
 | (6) |
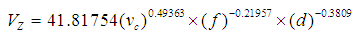
4.1.1. Effect of Varying Cutting Speed on Forces and Vibration Signals
- Figure 4 shows effect of cutting speed on cutting forces and vibration signals acquired during experiment. From graph it is clear that tangential components have largest magnitude and value of tangential component linearly decrease with increase in cutting speed. All three components of cutting forces are decreasing with increasing cutting speed. But it is observed that tangential components of cutting force have largest magnitude followed by radial components and then feed force components. As in case of vibration signals, all the three components increase with increase in cutting speed. From this it is clear that cutting forces and vibration signals shows dissimilar behaviours.
 | Figure 4. Variation of Cutting Forces and Vibration Signals with Varying Cutting Speed |
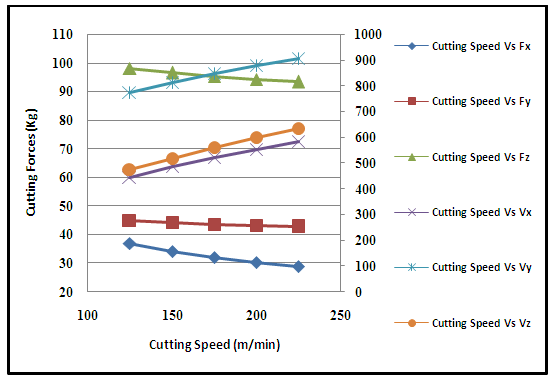
4.1.2. Effect of Varying Feed Rate on the Cutting Forces and Vibration Signals
- The effect of varying feed rate on the three components of the cutting forces and vibration signals acquired during three mutually perpendicular directions is as shown in the Figure 5. It is observed that the tangential component of the cutting force is linearly varied with changing the feed rate. Tangential component of the cutting force has largest magnitude followed by radial force and feed force. In case of vibration signals, it is clear that feed and radial components of the vibration signals are greatly affected with change in the feed rate. Two components namely feed and radial increase in increase in feed rate. Radial component of vibration signal has largest magnitude as compared to two component of the cutting force. Tangential components of vibration signal decreases with increase in feed rate. Which means feed rate does not affect vibration signal in tangential direction.
 | Figure 5. Variation of cutting forces and vibration signals with varying feed rate |
4.1.3. Effect of Varying Depth of Cut on the Cutting Forces and Vibration Signal
- Effect of the varying depth of cut on the three components of cutting forces and vibration signals acquired in the three mutually perpendicular directions is as shown in Figure 6. Depth of cut has the prominent effect on the cutting forces and vibration signals. From the graph it is clear that the all three component of the cutting forces have great response to depth of cut. Tangential component of cutting force has the largest magnitude as compared to feed (Fx) and radial (Fy) component of cutting force.
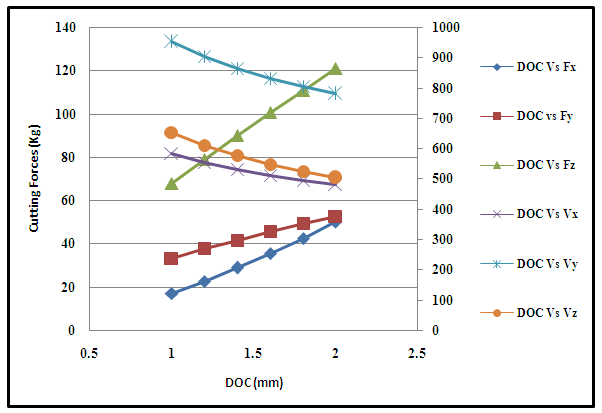 | Figure 6. Variation of cutting forces and vibration signals with varying depth of cut |
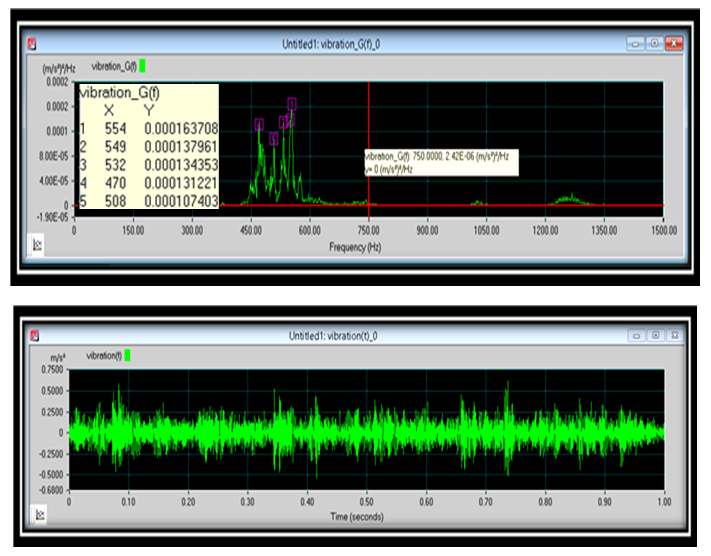 | Figure 7. Typical frequency domain and time domain plot at cutting speed 175 m/min, feed rate 0.6 mm and depth of cut 1.5mm in X-direction |
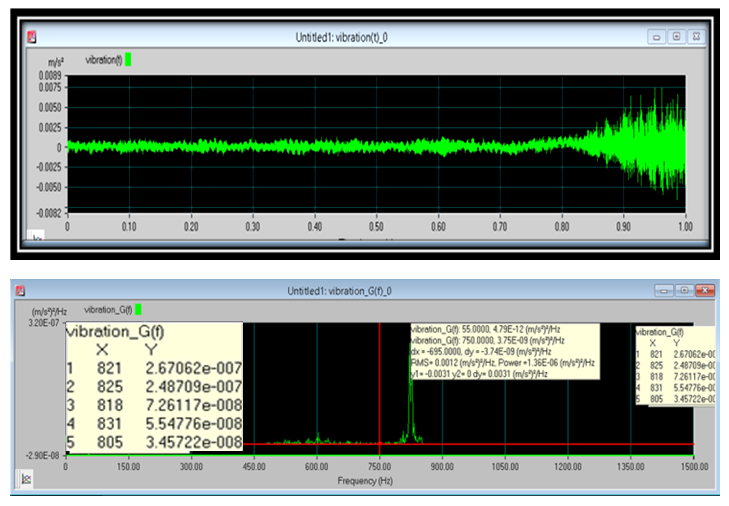 | Figure 8. Time domain and Frequency domain signals at cutting speed 175 m/min, feed 0.4 mm/rev and DOC 1.5 mm in Y-direction |
5. Conclusions
- This study is carried out to investigate the cutting forces and vibration signal at different cutting condition using the standard response surface methodology (RSM). The results shows that the tangential force is largest followed by the feed force and radial force. The vibration signal and the cutting forces well to investigate the tool state as well as the different occurrences during turning. The following are the main points out during this investigation.• The vibration signal measured along the three directions tangential, feed, and radial direction respectively shows the same chronological order as like the cutting forces.• During this investigation it is observed that cutting forces and vibration signals shows dissimilar nature. i.e. cutting force decreases whereas frequency of vibration increases as increase in cutting speed.• With increase in feed rate cutting force and frequency of vibration in tangential direction varies linearly. Cutting force and frequency of vibration in radial direction has largest magnitude.• Depth of cut has more prominent effect on cutting forces and vibration signals. All three component of cutting forces and vibration signals increases with increase in depth of cut.