-
Paper Information
- Next Paper
- Previous Paper
- Paper Submission
-
Journal Information
- About This Journal
- Editorial Board
- Current Issue
- Archive
- Author Guidelines
- Contact Us
Journal of Mechanical Engineering and Automation
p-ISSN: 2163-2405 e-ISSN: 2163-2413
2015; 5(3B): 47-54
doi:10.5923/c.jmea.201502.10
Study of Aerofoil Design Parameters for Low Speed Wind Tunnel
 Abstract
 Reference
 Full-Text PDF
 Full-text HTML
Alister Gleason D’souza , Joel I. Concessao , Jaimon Quadros
Dept. of Mechanical Engineering, Sahyadri College of Engineering & Management, India
Correspondence to: Alister Gleason D’souza , Dept. of Mechanical Engineering, Sahyadri College of Engineering & Management, India.
| Email: |  |
Copyright © 2015 Scientific & Academic Publishing. All Rights Reserved.
Low speed wind tunnel testing has evolved over the last century and has become a cornerstone in the development of aviation vehicles. Study of the effects of aerodynamics and its influence are substantial in the design of aircrafts and much fluid effect based engineering machines. The forces involved in the dynamic interactions of fluids and solids have only begun to be lifted, therefore the study of wind behavior is necessary to design large Airplanes. This paper provides an overview of the design parameters of a low speed wind tunnel and then the study of coefficient of lift (CL) and coefficient of drag (CD) for different length to diameter (L/D) ratios of a NACA 4412 aerofoil section shaped as per the NACA standards of Aerofoil design. It was observed through flow visualization test that flow remained unseparated throughout the test section for 70% of its characteristic dimension i.e. the breadth or height of the test section in this case. A conditioning circuit was also developed in order to record the (CL) and (CD) values which gave smooth output data values. The LM324 IC was used for noise and temperature output for good stability for dynamic data.
Keywords: Coefficient of lift, Coefficient of drag, L/D ratio, Reynolds number, Laminar flow
Cite this paper: Alister Gleason D’souza , Joel I. Concessao , Jaimon Quadros , Study of Aerofoil Design Parameters for Low Speed Wind Tunnel, Journal of Mechanical Engineering and Automation, Vol. 5 No. 3B, 2015, pp. 47-54. doi: 10.5923/c.jmea.201502.10.
Article Outline
1. Introduction
- Low speed wind tunnel testing has evolved over the last century and has become a cornerstone in the development of aviation vehicles. Late in the 1970’s, multiple groups of experts predicted that the need for aerodynamic experiments, particularly in the subsonic region of airflow, would rapidly disappear as computational fluid dynamics (CFD) would take over. Though the multiple formidable improvements in CFD prevail today and computer power continues to evolve, our mathematical models are still far for being a perfect analysis of an aircraft. The shapes of airplanes are determined by considerations of aerodynamics with varying degrees of attention to performance, agility, stealth, procurement cost, operational cost, time to delivery and other aspect the customer may require for intended missions. A primary tool of experimental aerodynamics is the wind tunnel. The productive and proper use of experimental investigations in general wind tunnels in particular requires applications of aerodynamic theory and computational methods in the planning off facilities, planning of experiments and the interpretation of resulting data. The fundamental principles from which the equations used to model “low-speed” aerodynamic flows are derived and are only three in number. These are (1) Mass is conserved, (2) force and motion are related by Newton’s second law, and (3) energy exchanges are governed by First Law of Thermodynamics. In addition to these three principles, certain fluid properties and their variations with pressure and temperature must be described mathematically with sufficient accuracy for each application. The objective of this paper is to study the aerodynamic aspects of designing a subsonic Wind Tunnel and to study the existing aerofoil design to understand what parameters affect the lift and drag coefficients. The available literatures that deal with the design of wind tunnel or those components are illustrated firstly. Bradshaw and Mehta, 1979, presented design guide lines for the main components of a wind tunnel, the fan, wide angle diffuser, settling chamber, contraction, screens, honey combs and exit diffuser for small low speed wind tunnels. Milan Valajinac, 1970 summarized the design, construction and calibration of a subsonic wind tunnel. Raikan 2001, a subsonic wind tunnel design of closed circuit type for a range of Mach No. in the test section up to 0.7 has been carried out and a mathematical models describe the flow in each component of the wind tunnel are made. The comparisons between the results obtained from their design and the literature were done and they showed that a good agreement exist with these results. NACA 4412 aerofoil is used to study the parameters of design and flow parameters with reference to lift and drag. J. Colman 2010 investigated an airfoil, with and without the Gurney mini-flaps, immersed in a low Reynolds number turbulent flow. Lift and drag coefficients were calculated for the plain wing and for the wing with mini-flaps of 1%, 1.5%, 2% and 2.5% height of the chord and plotted as a function of the angle of attack. The experimental data, including the power density spectrum of the instantaneous longitudinal and vertical velocities and load, show that the Gurney mini-flap acts enhancing the lift coefficient of the airfoil coupled with an increased drag, primarily due to the particular mini-flaps wake structure.
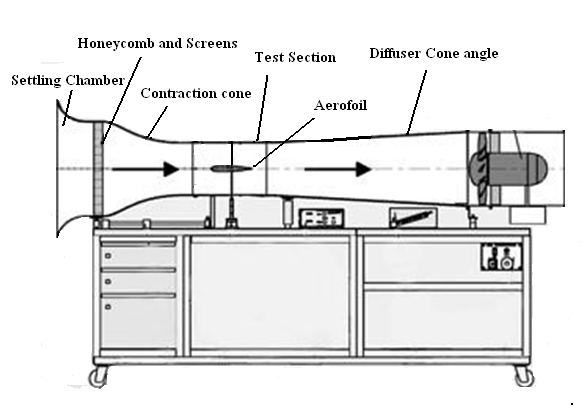
2. Wind Tunnel Design
- The first step in the design of a wind tunnel is to determine the size and shape of the test section based on the intended uses of the facility. A major part of the following discussions address tunnels for which the primary use is vehicle and vehicle component testing, since many tunnels are built for this purpose. It is also assumed that a major part of the testing will be force testing, where information is sought for performance, fuel efficiency, stability or control of a vehicle that may be an aircraft, an automobile, a submarine or possibly others. The cross sectional area of the test section basically determines the overall size of the facility. The test section size, speed and design will determine the required power. The size of the facility will be the primary factor in determining the structural or shell costs, and the power and operating hours will determine the energy portion of the operational cost. The overall aerodynamic objective for most wind tunnels is to obtain a flow in the test section that is near as possible to a parallel steady flow with uniform speed throughout the test section. Perfection is not possible so every design is bounded by constraints that involve minimum cost, available space, available time and knowledge. It is almost always desired to obtain the largest size of the test section and the highest speed for the available funds. High speed and large size are of course competing demands. Aero acoustic evaluations and experiments have become of great importance in low-speed aerodynamics for a number of applications. The requirement for a facility to be useful Aero acoustic facility is the background noise level should be sufficiently low. However, now there are many tunnels that have been modified for various degrees to reduce the background noise. It is also the case that more sophisticated measurement techniques and instrumentation are making it possible to obtain useful acoustic measurements in environments with higher background noise.The basic considerations are:i) Unit Reynolds NumberThe central issue in the sizing of a low- speed wind tunnel will be the achievable Reynolds number for the models that can be accommodated. We will choose a Mach number of 0.3 as the upper limit of Mach number for the free stream beyond which we may be concerned about the effects of Mach number on a typical study. Considering sea level standard atmospheric conditions, the maximum for V will be ~100 m/sec, and the “unit Reynolds number” will be ~6.49 105 m-1 (Note that the unit for Reynolds number represents the exclusion of characteristic length). Much low-speed testing involves aircraft takeoff and landing configurations where the Mach number is typically in the 0.15-0.3 range. A primary decision is the choice of the minimum acceptable value of Reynolds number. Because much of the low-speed testing is at high – lift conditions, the effect of Reynolds number on aerofoil’s at high lift must be considered. Maximum lift and lift curve shape near stall for single element airfoils vary considerably with Reynolds number up to at least one million. For multi-element airfoils this range is much greater. If the Mach number is taken as 0.2, the tunnel velocity is about 67m/s. For this speed the unit Reynolds number is a little less than 458,000m-1.ii) Open or Closed ReturnAnother basic design consideration is whether the tunnel will be of a return or non-return type. Almost all of the small research tunnels are of the non-return type, usually because of the lower construction costs. Power consumption for such tunnels is usually not a significant factor in overall cost. Although there exist some larger tunnels of non-return design, most of the large tunnels are of the return type the majority being single return.
2.1. Wind Tunnel Component Energy Losses
- The case of wind tunnel flow is considered to be the case of “flow through pipes”. Hence, there are multiple losses occurring due to friction at the boundaries. This resulting loss of pressure is termed as pressure loss and it is the excess pressure that is required to be raised by the fan to maintain the required flow. Pressure drop is given by:
 Where
Where  is known as the Hydraulic Diameter and is computed by,
 the perimeter, A is the Area of cross-section of the flow section. The term
  is the friction factor and is computed by (Colebrook Equation):
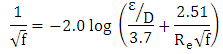 Where
Where  is the average height of surface roughness. Since the Colebrook’s equation is implicit in
  , the determination of the friction factor requires iteration. Since the friction factor is minimum for smooth pipes but not equal to zero (due to the no slip condition) and increases with roughness, the Colebrook Equation reduces to Prandtl Equation and is expressed as,
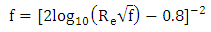 This equation is valid for turbulent flows where
 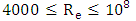 . Another general principle used to calculate velocities of flow in various sections is the principle of continuity of flow.
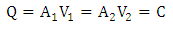
2.2. Test Section
- The test sections used include shapes like round, elliptical, square, rectangular, hexagonal, octagonal, and rectangular with filleted corners, flat ceiling and floor with half round ends. The cost and power are directly determined by the cross-sectional area and length of the sections. The shape of this test section should be based on the utility and considerations of the aerodynamics of the models to be tested. As the air proceeds along the test section, the boundary layer thickens which reduces the effective area of the jet from that of the geometric dimensions and causes an increase in the flow speed outside the wall boundary layers. If the geometric area is constant, the speed increases in turn produces a drop in local static pressure, tending to draw the model downstream. In many tunnels fillets are carried through the test section to prevent boundary layer growth in the corners of the test section and down the diffuser tapering out at the end of the diffuser. The length of the test section in tunnels designed with aeronautical work as the primary focus vary from one to two times the major dimension of the section. The power losses in the test section are sizable, as well be seen shortly owing to the high speed; thus power can be saved by keeping it short. However, contractions do not deliver a uniform velocity distribution to the beginning of the test section. Therefore a constant- area duct before the test section is usually employed. A practical detail in the test section design is the installation of sufficient windows for viewing the model. In the course of testing it will become necessary to see all parts of the model: top, sides, bottom and as much of the front as is reasonably practical.
2.3. Diffusers
- The diffuser of a return wind tunnel typically extends from the downstream of the test section to the third corner of the tunnel. It is divided into two parts by the tunnel fan and the power losses at any point in the tunnel are expected to vary as the speed is cubed. The purpose of the diffuser is to reduce the speed with as little energy loss as possible and also the minimum energy loss corresponds to maximum pressure recovery. Diffusers are sensitive to design errors that may cause either intermittent separation or steady separation which can be hard to localize but can cause vibrations, oscillating fan loading, oscillations in the test section velocities, and increased losses in the tunnel downstream of their origin. The primary parameters for a diffuser are the equivalent conical expansion angle and the area ratio. Consider a conical diffuser with a radius
 at the entrance, radius
  at the exit, and L as indicated in figure. Commonly used cross sections are rectangular or nearly rectangular with reasons closely propelling the reasons given for choosing test sections with the plain walls. The equivalent conical angle is defined as follows. Let
  be one half the entrance hydraulic diameter
  . Let
. Let  be one-half the exit diameter
  and
and  be
be  . Then the equivalent conical expansion angle is given by
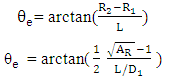 Diffusers are common elements in fluid flow devices, and in any applications the equivalent cone angle can be quite large. Relatively large angles are possible for the case of uniform flow entering the upstream end of the diffuser. If a very long 2.50 diffuser is used to obtain a large contraction ratio, there is a danger of separation. Therefore, the total tends to be limited to area ratios of 5:1 or 6:1, half of the area ratio in each half of the diffuser. The expansion loss is more difficult and is obtained presently only by experimental correlation. The expansion loss coefficient is represented as a product of two factors. One factor is a function of the equivalent conical angle and the other is a function of diffuser area ratio. The result is
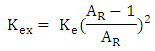 The factor
  depends significantly on the diffuser cross sectional shape. The most efficient divergence is about 5°.
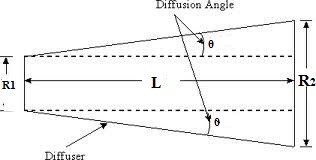 | Figure 1. Diffuser Section |
2.4. Contraction Cone
- The contraction cone or nozzle takes the flow from the settling chamber to the test section while increasing the average speed by factors up to 20 or more, although typical values are in the range of 6-10. The nozzle is in fact never conical in shape and comprises of geometry of curves. The application of Bernoulli’s equation and mass conservation in a one dimensional sense indicates a continuously falling pressure as the flow moves from the entrance to the exit of the nozzle. A characteristic feature of the velocity distribution was a velocity peak on the centerline of the constant area inlet that persists well into the nozzle, where the velocity then decreases, ending in a centerline velocity deficit. This deficit continues for about one radius beyond the nozzle exit. This leads to a cup shaped velocity profile in the constant area exit duct. The nozzle exit length is sensitive to the required length in the test section for a uniform velocity profile. For an area ratio of 8 the inlet section length varied from 0.15 to 1.00 times the inlet radius, while the test section settling length varied from 1.5 to 0.5 the exit radius. It is desirable to keep the length of the nozzle as short as possible, the nozzle being defined as the sum of the settling chamber length plus the nozzle plus the settling length of the exit section.
2.5. Flow Straightener
- The stagnation chamber located just before the contraction cone and is the part of the wind tunnel circuit that has the largest cross section area. This part has a major influence on the flow quality in the test section. Because of the high local pressure drop generated by flow improving devices it is important to position them in the location with the lowest flow speed and thereby minimize their contribution to the total pressure drop of the wind-tunnel circuit.
 | Figure 2. Flow straightener a) circular; b) square; c) hexagonal |
3. Wind Tunnel Construction
- The structural loading on the various sections of a low speed wind tunnel are usually less critical than the strength needed to avoid vibrations, a significant exception being the assurance that the drive motor will stay in place should it lose one-half of its blades. The rest of the tunnel may be examined to withstand the maximum stagnation pressure with a safety factor of perhaps 4.0. Since vibration of parts of the wind tunnel contributes to noise, discomfort of the tunnel crew and possible fatigue failures and usually adds to the turbulence in the wind stream, it is a goof practice to have the natural frequencies of all tunnel part well above any exciting frequencies. At this time, for the small tunnels at least, flat panels can be checked with a simple shaker motor, and by means of a vibrometer the natural frequencies can be determined. Any speed below the fan rpm should be increased by stiffening the part.All types of materials are used for tunnel construction: wood, plywood, thin metal, heavy metal, cast concrete, granite and plastics. Even though there is “ general agreement” that low speed wind tunnels require no cooling, heavy running in the summertime will usually make the tunnel operators wish they had some. Cooler outside air can be blown into the tunnel and some large tunnels spray water over the outside to cool the tunnel. Fan blades for low speed tunnels are frequently made of wood, although modified with aircraft propellers are sometimes used with trailing edge flaps to provide a uniform pressure rise across the fan disk. Tunnels that use short span, large chord blades have used fiberglass and more recently composite materials such as carbon fiber reinforced epoxies.For small research and instruction tunnels plywood is possibly the best material. Particle board is another material used: however, it is not stiff as plywood and can develop a sag when supported. A smooth surface finish is difficult to patch. With wood holes and discontinuities can easily be patched. The tunnel is often made in sections that bolt together. To prevent leaks, surgical tubing can be used as a gasket. The fan area can be metal, as it is easy to roll up round sections. A door in the floor in the plane of the fan will be necessary so that blades may be taken out of their hubs and replaced.
 | Figure 3. Experimental set up comprising of Wind tunnel for conducting experiments |
4. Aerofoil Design
- Aerofoil design is a major fact of aerodynamics. Various aerofoils’ serve different flight regimes. Asymmetric aerofoil’s can generate lift at zero angle of attack, while symmetric aerofoil may better suit frequent inverted flight as in an aerobatic airplane. For the analysis of aerofoil models for this project we have made a study on NACA aerofoil. They are aerofoil shapes of aircraft wings developed by the National Advisory Committee for Aeronautics (NACA). The shape of the NACA aerofoil were described using a series of digits following the word “NACA”. The parameters in the numerical code can be entered into equations to precisely generate the cross- section of the aerofoil and calculate its properties. The Aerofoil was modeled in CATIA, industrial software, where all the points of aerofoil 4412 were individually plotted and successfully modeled for a light wood material in order to obtain their respective center of gravities. Thin sheets of raw ply wood where cut to rectangles of suitable dimension and stacked and glued together. Thin sheets of raw ply wood where cut to rectangles of suitable dimension and stacked and glued together. These stacks were compressed for over a night. The printout of the aerofoil profile was then glued to one side of the stacks and carved. In order to clear out the irregularities, metallic paste was applied on to the surfaces and smoothened with emery paper. The final coating to obtain clean surface was done with the calcium carbonate paste and was allowed to dry. Holes were drilled onto the center of gravity up to a certain distance for the mount and hooks.
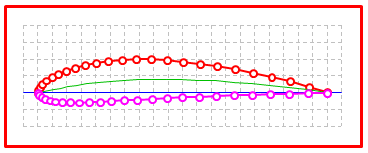 | Figure 4. Aerofoil modeled in CATIA, industrial software |
5. Aerodynamics of the Wind Tunnel
- The aerodynamic aspects of the wind tunnels mainly circumscribe the maintenance of the hydrodynamic boundary layer and to make sure that the losses or stagnation points th roughout the wind tunnel are at their least effects. Certain details how hydrodynamic boundary layer can remain unseparated in the tunnel is by proper diffuser installation after the test section. Suitable diffuser angle should be taken into account for the right size of test section. The angle range can vary from 3 to 50, but the safe angle chosen for the test section of 12”x12” cross section was 3.80 which has yielded satisfactory results. Losses are of many kinds, apart from the major and minor losses in pipe flows. Since there is a suction unit, (the fan) losses can be extreme at various zones of the wind tunnels. Sharp corners, holes and leakages are the adversaries of wind tunnel testing. Another aspect that promotes the maintenance of the hydrodynamic boundary layer is the proper design and manufacture of the settling chamber parallel to the flow, the flow was in streams, hence determining the low turbulence in the tunnel. These tests were clear enough to understand the stability of the boundary layer cum flow straightener. A simple test of using tufts (strands of threads) in the tunnel would give a brief idea. When the tufts were placed and its separation points at different locations. The shapes of different parts of the wind tunnel i.e. the contraction cone, test section and diffuser section clearly proves the application of Bernoulli’s principle, leading to the inverse relation of velocity and pressure. Results from ANSYS FLUENT give an indication of approval with design as shown.
6. Tests and Results
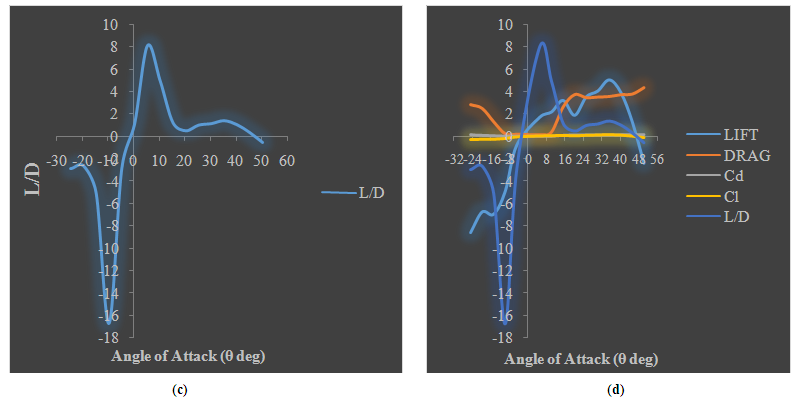
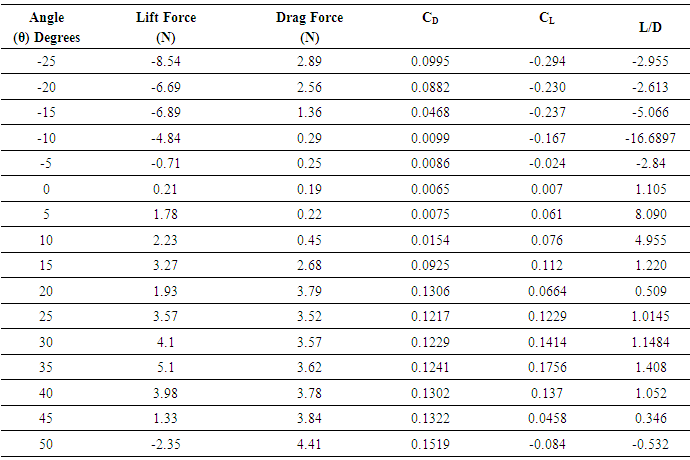
- Flow visualization revealed the idea of how lift and drag forces vary at different angles of attack with the peculiar behavior of smoke over the surface of the aerofoil. NACA 4412 aerofoil was tested for constant wind speed of 35m/s and varying the angles of attack, following observations were recorded. It is visible that coefficient of lift increases for positive angles of attack and becomes maximum at 35°. This gives a clear indication coefficient of lift (Cl), becomes maximum at 35°, and on further increase of angle of attack, starts to decrease and approaches a negative domain after 45°. At this state the aerofoil experiences zero lift and attains ‘stall’ condition. An aircraft experiencing this state will fall freely due to gravity. Drag coefficient on the other hand decreases with the increase of angles of attack until a point where the aerofoil is on the verge of attaining ‘stall’ condition, and then slowly increases for higher tilts of the aerofoil.In aerodynamics, the lift-to-drag ratio, or L/D ratio, is the amount of lift generated by a wing or vehicle, divided by the drag it creates by moving through the air. A higher or more favorable L/D ratio is typically one of the major goals in aircraft design; since a particular aircraft's required lift is set by its weight, delivering that lift with lower drag leads directly to better fuel economy, climb performance, and glide ratio. calculating speed and estimating suitable weight of the aircraft we can clearly understand the correlation of lift and drag forces. The values of coefficients of lift and drag obtained play a crucial role in scaling aircraft models. The NACA 4412 Aerofoil had 20cms chord length and 5” thick. This aerofoil was affected by a range of lift and drag forces for a wind speed of 35m/s, as shown in table. Considering any value of Coefficient of lift and entering the specifications of the aerofoil in the expression,
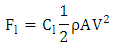 We will be able to calculate either of the values as per required for suitable Reynolds number. In order to scale this aerofoil model to that of the actual size of an Ultra-light low powered plane, we substitute the value of coefficient of lift and enter the values of density, area of cross section and a suitable wind speed, keeping the proper limits of Reynolds Number within standards, the actual lift for the aircraft can be determined. It works the same way for drag forces as well. This is the specialty of Similarities and the use of dimensional analysis. The temperature sensor gave us linear outputs with small variations above and below the room temperature proving the existence of a small static temperature change at different stages while testing an aerofoil. The average noise value obtained from inside the test section considering full load gave us a reading of 93dB which is a safe level as per wind tunnels are considered. Better noise reduction would have been possible if the tunnel sections where made circular. The designed and tested aerofoil was the NACA 4412. Based on our results, we can conclude that the aerofoil is an excellent choice for low powered aircrafts usually mono seat or dual seat. The aerofoil has good lift ratios at low velocities ranging between 30m/s to 45m/s and improves at higher velocities. The aerofoil has its highest Lift to drag ratio at an angle of attack of 6°.
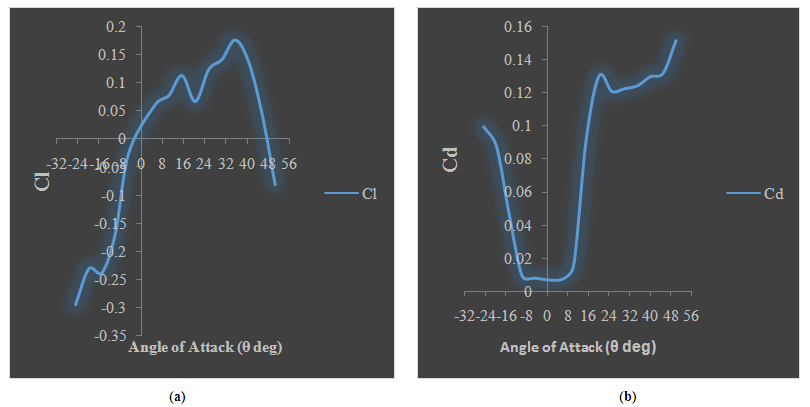 | Figure 5. Variation of a) Co-efficient of Lift; b) Co-efficient of Drag with respect to angles of attack |
 | Figure 6. Variation of c) Length to Daimeter (L/D) ratio; d) Combination of all aerodynamic parameters with respect to angles of attack |
|
7. Conclusions
- The project was an attempt to achieve two major objectives; the first being the design and construction of the wind tunnel and the second being study on aerofoil. Hence the project was proposed in two parts. The main test for determining the stability of a wind tunnel is the test to see the stability of the hydrodynamic boundary layer throughout the test section. We have conducted flow visualization test for the airfoil and during the test and flow remained unseparated throughout the test section at 70% of its characteristic dimension (the breadth or height of the test section in this case). When we further moved to the flow visualization of the aerofoil, a smooth visible flow separation was observed. In addition to the stability of the boundary layer, the smoke test also shows, the efficiency of the flow straightener section. The signal amplifier and conditioning circuits were designed to amplify load cells, microphone and temperature sensor. To produce a very linear amplification of the small voltages produced by the strain gauge load cells, TL082 IC from Texas Instruments was chosen. A simple low-pass filter was used with a moderate capacitance to output stable values. Since immediate response was not a requirement, the capacitance value was of the utmost importance. The working of this amplification and conditioning circuit was evident in the smooth data output values. The LM324 IC was used for noise and temperature output for its good stability for dynamic data. The results obtained from the aerofoil are satisfactory with results co-relating to Bernoulli’s theory and general wing principles with maximum Lift to drag ratio in excess of 8 at 6°.