-
Paper Information
- Next Paper
- Previous Paper
- Paper Submission
-
Journal Information
- About This Journal
- Editorial Board
- Current Issue
- Archive
- Author Guidelines
- Contact Us
Journal of Mechanical Engineering and Automation
p-ISSN: 2163-2405 e-ISSN: 2163-2413
2015; 5(3B): 23-26
doi:10.5923/c.jmea.201502.05
Simulation of Surface Stress-Induced Deflections in Microcantilever Biochemical Sensor
 Abstract
 Reference
 Full-Text PDF
 Full-text HTML
Mohd. Zahid Ansari , Mahak Bisen , Udit Narayan Bera , Shashank Kumar
PDPM-Indian Institute of Information Technology, Design and Manufacturing (IIITDM) Jabalpur, Khamaria, Jabalpur, India
Correspondence to: Mohd. Zahid Ansari , PDPM-Indian Institute of Information Technology, Design and Manufacturing (IIITDM) Jabalpur, Khamaria, Jabalpur, India.
| Email: |  |
Copyright © 2015 Scientific & Academic Publishing. All Rights Reserved.
This study presents the results of a numerical investigation modeling the surface stress induced deflections in a biochemical sensor using different loading conditions. The results of this investigation can help understand and devise novel microcantilever biochemical sensor designs. Microcantilever sensors exploit the surface stress induced deflection in assaying the unknown molecules adsorbed onto its functionalized surface. By measuring the deflection, the attaching species as well as its concentration can be determined. In this study, we used three approaches to model the deflection produced in the sensor. In the first, we applied uniformly distributed force on the free end of the cantilever. In second, we applied uniformly distributed moment on the free edge. And in the third, a longitudinal in-plane tensile force is applied to the cantilever free end. The deflections results obtained using these models are then compared against available experimental results. A commercial finite element code ANSYS Multiphysics is used in this analysis. The simulations are conducted on a silicon microcantilever of size 500×100×0.5 µm having Young’s modulus 130 GPa and Poisson ratio 0.28. Though all the three approaches adopted in this investigation show similar results for the deflection, the stress distribution results are however dissimilar. The stress dissimilarity can be efficiently used in designing piezoresistive microcantilever sensors, where the difference between the longitudinal and transverse stress is exploited in measuring the cantilever deflection. The higher the difference, the higher will be the sensitivity of the sensor.
Keywords: Surface stress, Stoney equation, Force, Moment, Plate theory, Beam theory
Cite this paper: Mohd. Zahid Ansari , Mahak Bisen , Udit Narayan Bera , Shashank Kumar , Simulation of Surface Stress-Induced Deflections in Microcantilever Biochemical Sensor, Journal of Mechanical Engineering and Automation, Vol. 5 No. 3B, 2015, pp. 23-26. doi: 10.5923/c.jmea.201502.05.
Article Outline
1. Introduction
- A biochemical sensor is basically a chemical sensor functionalized with the receptors that bond with and hence can detect biochemical molecules such as proteins, DNA/RNA, and antigen/antibody. They are also referred as biosensor when they can detect biological specimens like cellular structures, cells, bacteria, viruses etc. In general, biochemical sensors are synonym with biosensors and therefore we will use the term interchangeably. A biosensor has two main elements, a bioreceptor and a transducer. Bioreceptors are target-specific and known biomolecules that reacts with the target analyte molecules and generate unique signal during the reaction. Bioreceptors can generally be classified into five different categories: antigen/antibody, enzymes, nucleic acids/DNA, and cellular structure/cells and biomimetic. The transducer element of the biosensor converts the unique signal into measurable quantity. The transducers can be based on optical, electrochemical (e.g., pH meter), electromechanical (e.g., strain sensor), and mechanical (e.g., deflection sensor) detection techniques. In biosensing applications, sample preparation and molecular labeling of the target analyte is a basic requirement. Labeling aids in easy detection and monitoring of the biomolecules and reactions progress. Radioactive and fluorescent dye based labeling agents are commonly used in biosensors. Labeling however is an expensive and time consuming process. Therefore, label-free detection techniques are critical in developing rapid, economic, and user-friendly biosensors and analysis kits.Though originally developed for the topological studies of surfaces using surface force microscope (SFM) and later atomic force microscope (AFM), microcantilever-based measurement techniques have emerged as universal, very powerful, and extremely sensitive means to study a variety of physical, chemical and biological processes. Owing to their label-free, rapid, and real-time detection abilities, microcantilevers are especially attractive to biological studies [1-4]. Static and dynamic modes of operation are commonly used in microcantilever biosensors. In static mode, the surface stress-induced deflections are measured; whereas in dynamic mode, the mass change-induced resonant frequency variations are measured. This study focuses on static mode.In microcantilever biosensors, the change in the surface stress distribution at the top surface of the cantilever is used to determine the unknown molecules adsorbed on the functionalized surface. When the analyte molecules are adsorbed onto the functionalized surface of the biosensor its surface stress distribution is changed. The change is surface stress leads to deflection in the cantilever; and by measuring the deflection the attaching molecule can be analyzed. Thus, the basic mechanism behind detection is surface stress change. Figure 1 shows the schematic of microcantilever biosensor operation. The change in surface stress is generally measured using optical or piezoresistive readout techniques. The optical technique employs laser-based deflection measurement system and records the surface stress-induced deflection of the tip of the cantilever. The piezoresistive method however employs the change in electrical resistance of the cantilever due to the change in surface stress for analysis.
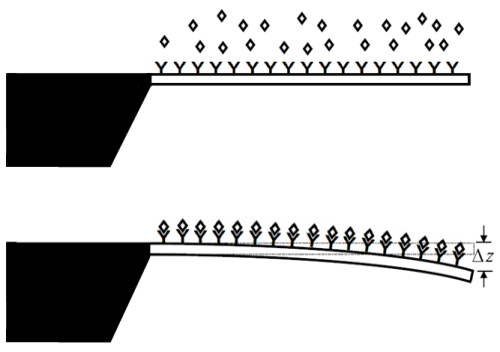 | Figure 1. Operating principle of a microcantilever biosensor. The cantilever is first functionalized with bioreceptor layer (top) and then used to determine the unknown molecules (bottom) |
2. Mathematical Modelling
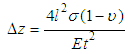
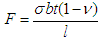
- Presently, there are numerous mathematical models that are used to explain the surface stress-induced deflection in a cantilever [5-9]. These models generally use concentrated and/or distributed moment or axial tensile force mechanism to obtain expressions relating surface stress to cantilever deflection. Stoney [5] gave a fundamental expression relating the residual surface stress (Δσ) per unit length in a film to the curvature (κ) of a substrate the film is deposited onto. The curvature does not depend on the material or the geometric properties of the film. This equation is commonly used in determining the residual surface stresses in thin films. In its original form, the equation was given as [5]:
 | (1) |
 | (2) |
 | (3) |
 | (4) |
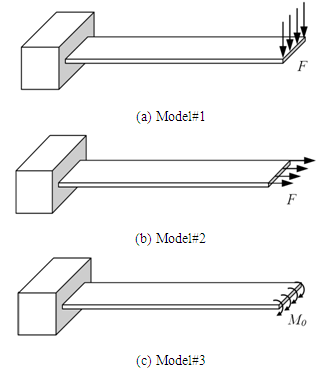 | Figure 2. Different load models analyzed in this study |
3. Results and Discussion
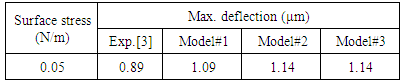
- Table 1 presents the deflection result reported by Arntz et al. [3] and analytical values predicted by different load conditions emulating the surface stress. As can be seen in the table, all the three models are predicting very similar results. These values are however comparatively higher than the experimental. The variations can be attributed to the assumptions inherent in the analytical models. Based on the results shown in Table 1, we can conclude that the analytical models for determining the deflection due to surface stress in microcantilever biochemical sensor give reasonable results, and can be used to determine the deflections. Though the deflection results are satisfactory, however, as discussed next, the values and the distribution of stress induced in the cantilever are different.
|
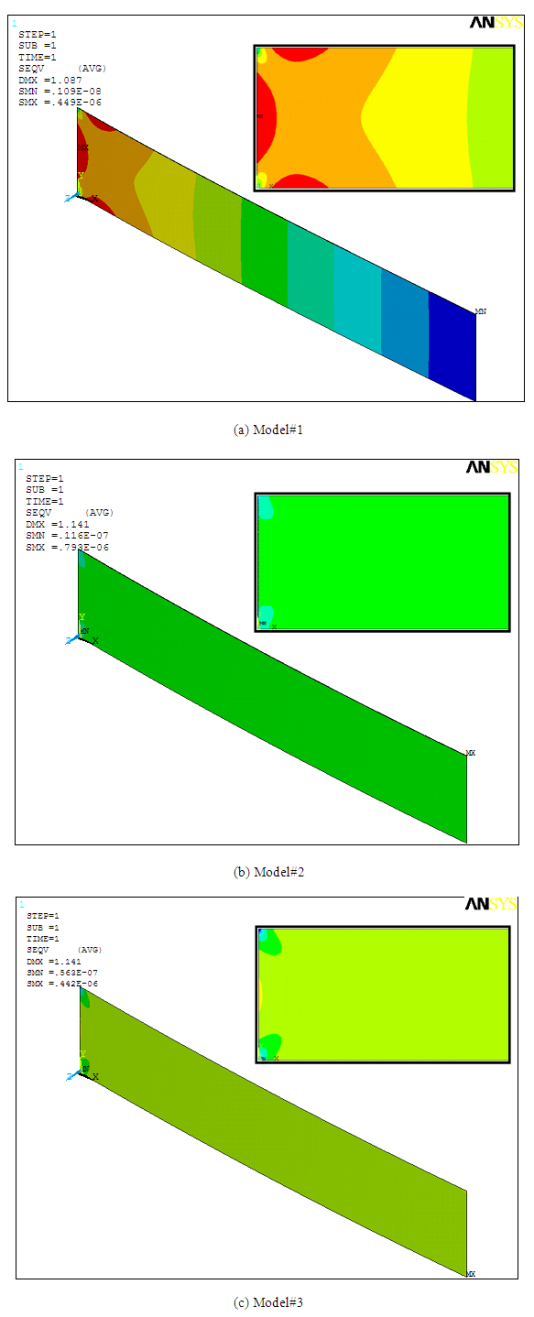 | Figure 3. Deflection and stress distribution in the microcantilever subject to different load models |
4. Conclusions
- This study investigated the accuracy of surface stress and deflection models in predicting the bulk stress distribution in a microcantilever biosensor. We successfully used three different load models that employed compressive load, tensile force and moment at the free end of the cantilever to reproduce almost the same deflection. Though the deflection values predicted by the models are similar, the maximum bulk stress values as well as the stress distribution patterns are different. In-plane tensile force models showed maximum values nearly double the compressive and moment models. The compressive force models showed the maximum deflection is located at the middle of the fixed end, whereas the other two models showed the maximum stress values occurred at the corners of the fixed end. Thus, we can conclude that the surface stress models derived for predicting the surface stress-induced deflections are accurate for predicting deflections only. For accurate prediction of surface stress-induced bulk stresses a new and different approach requires. Such an approach can be extremely helpful in designing and improving the efficiency and sensitivity of piezoresistive microcantilever biosensors.
ACKNOWLEDGEMENTS
- This study was supported by Indian Institute of Information Technology, Design and Manufacturing - Jabalpur.