-
Paper Information
- Next Paper
- Paper Submission
-
Journal Information
- About This Journal
- Editorial Board
- Current Issue
- Archive
- Author Guidelines
- Contact Us
Journal of Mechanical Engineering and Automation
p-ISSN: 2163-2405 e-ISSN: 2163-2413
2015; 5(3A): 1-5
doi:10.5923/c.jmea.201501.01
Effects of Mill Performance on Unburnt Carbon in Coal-fired Boilers
 Abstract
 Reference
 Full-Text PDF
 Full-text HTML
N. A. W. Mohd Noor, M. T. Lim, H. Hassan, A. Ahmad
Generation Unit, TNB Research Sdn. Bhd.
Correspondence to: N. A. W. Mohd Noor, Generation Unit, TNB Research Sdn. Bhd..
| Email: |  |
Copyright © 2015 Scientific & Academic Publishing. All Rights Reserved.
While renewable energy has undergone wide and rapid deployment, coal is still expected to be the main source of fuel for producing base load power in the near future. This is because coal reserves are expected to last for the next century and its cost is still relatively cheap. However, the emissions from coal combustion are a major environmental concern. Thus, the combustion efficiency needs to be improved to reduce coal consumption. Investigations on the burner design and the operating parameters (e.g. air flow distribution) have been widely performed before. However, the combustion performance (in terms of the furnace rear pass temperature) is not widely related to the coal particle size and coal mass flow distribution of the pulverized coal (PC) pipes leading up to the burners. Thus, this paper investigates and reports the results of the coal mass flow distribution and particulate size from four PC pipes leading up to four burners of a tangentially-fired 700 MW boiler. Pulverized coal were sampled isokinetically from the PC pipes. The results indicate that there is a significant mal-distribution of coal mass flow in the PC pipes. The particulate size was also coarse. As a result, the heat release from the combustion of coal occurred higher up in the boiler, leading to a flue gas exit temperature. Unburnt carbon was measured to be low, even with coarse particulates and mal-distribution. Higher flue gas exit represents stack losses, and should be avoided.Based on the results, it is expected that significant improvement on the station boiler efficiency can be achieved by retuning pulverizers to obtain good coal fineness and uniform coal distribution in the affected pipe.
Keywords: Coal flow distribution, Boilers, Coal, Mill performance
Cite this paper: N. A. W. Mohd Noor, M. T. Lim, H. Hassan, A. Ahmad, Effects of Mill Performance on Unburnt Carbon in Coal-fired Boilers, Journal of Mechanical Engineering and Automation, Vol. 5 No. 3A, 2015, pp. 1-5. doi: 10.5923/c.jmea.201501.01.
Article Outline
1. Introduction
- While renewable energy has undergone wide and rapid deployment, coal is still expected to be the main source of fuel for producing base load power in the near future [1]. Coal reserves are expected to last for the next century and its cost is still relatively cheap [2]. However, the emissions from coal combustion are a major environmental concern. Thus, the combustion of coal needs to be efficient to reduce its consumption and its emissions. Investigations on the burner design and the operating parameters (e.g. air flow distribution) have been widely performed before [3]. However, the combustion performance, in terms of the rear pass temperature, is not widely related to the coal particle size and coal mass flow distribution (in the pulverized coal (PC) pipes) [4]. The particulate size affects the heat release rate and subsequently affects the distribution of temperature. Thus, this paper investigates the effects of particulate size and coal mass flow distribution in eight PC pipes leading up to eight burners of a tangentially-fired 700 MW boiler in Malaysia.
2. Methodology
- To determine the coal particulate size and their mass flow distribution, coal particulates were sampled isokinetically from the PC pipes. In order to achieve isokinetic sampling, the velocities (of the air-coal suspension) in the PC pipes were first measured using a Pulverised Fuel Sampler (ref. Fig. 1) in a vertical pipe, in which coal particulates were also collected following the procedures in ASTM D 197-87 [5].
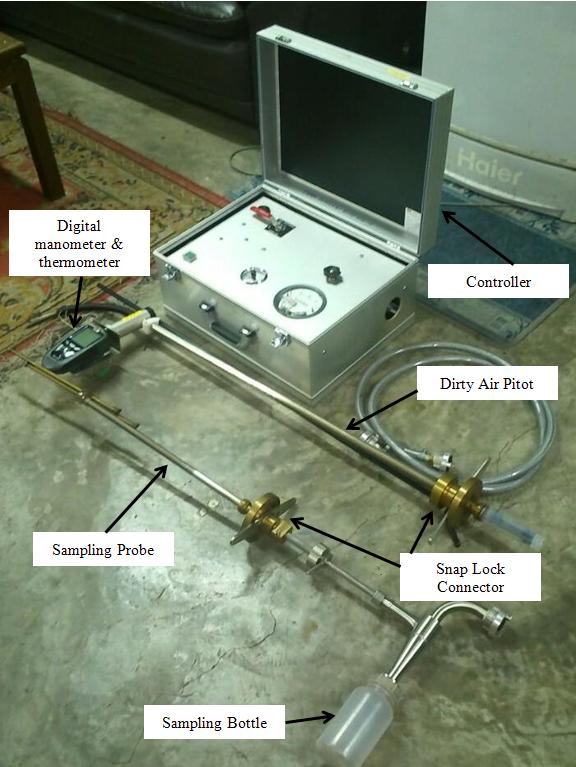 | Figure 1. Individual components of the Isokinetic Coal Sampler |
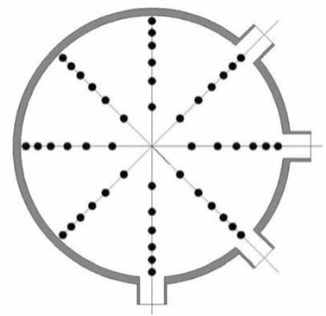 | Figure 2. Sampling points across a PC pipe. The measurement was performed for 4 PC pipes located at two elevations each (mill 20 and mill 40) |
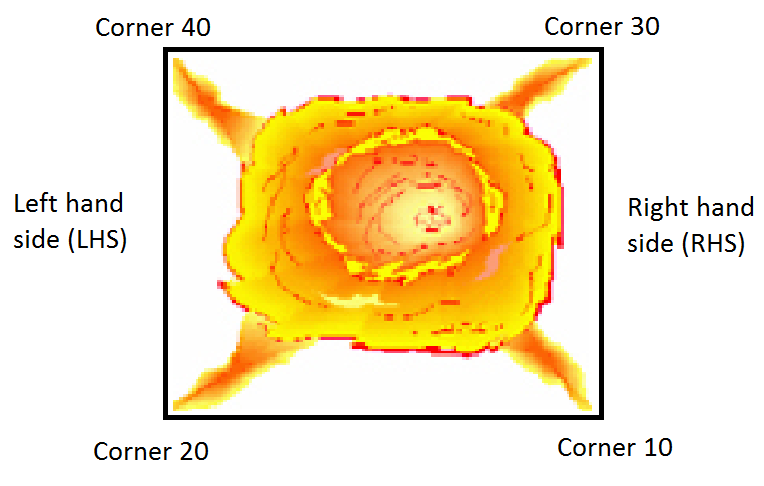 | Figure 3. Orientation of PC pipes and burners in the boiler for an elevation |
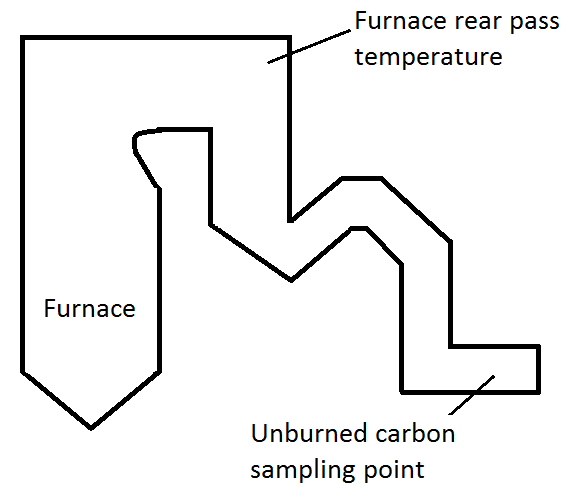 | Figure 4. Measurement points of furnace rear pass temperature and unburnt carbon in the power plant |
3. Results and Discussions
3.1. Velocity Profiles
- Figure 5 shows the averaged velocities of the four PC pipes at two different elevations (from mill 20 and 40) respectively. The results show that most of the PC pipes have an excessively high transport velocity compared to historical values, which were demarcated by the minimum and maximum velocities in Fig. 3. This shows that there is a mal-distribution of airflow from the four corners of the boiler, which affects the quantity of coal delivered to each burner.
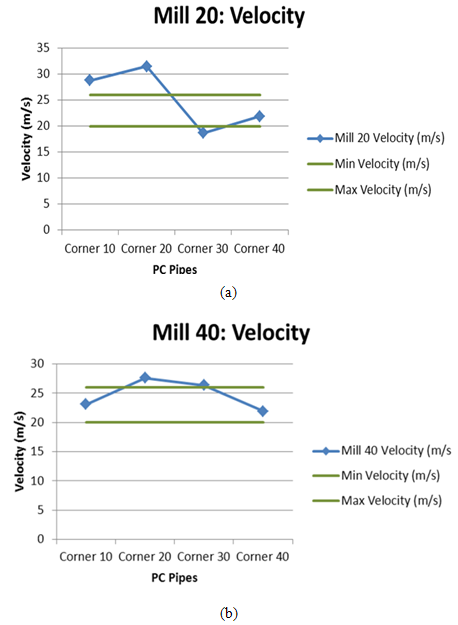 | Figure 5. Velocity of air/coal mixture in (a) mill 20 and (b) mill 40 |
3.2. Coal Mass Flow Distribution
- Figure 6 shows the mass flow distribution for the four PC pipes at two different elevations from mill 20 and mill 40 respectively. The figures indicate that there is a significant mal-distribution of coal mass flow in the PC pipes, which corresponds to the velocity profiles in Fig. 3.
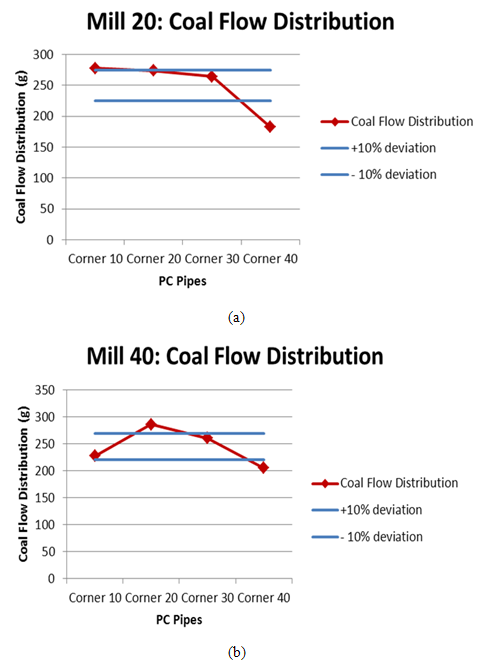 | Figure 6. Coal mass flow distribution in PC pipes from corner 10 to 40 for (a) Mill 20 (b) mill 40 |
3.3. Coal Particulate Size and Fineness
- Figure 7 shows the coal fineness from the sampled particulates of the four PC pipes for the two elevations from mills 20 and 40 respectively. According to plant requirements, more than 70% (by weight) of the pulverized coal should be smaller than 75 μm. However, from the sieve tests of the sampled coal particles, less than 50% were smaller than 75 μm. More than 50% of the pulverized coal samples were within a 75 to 300 μm size range.
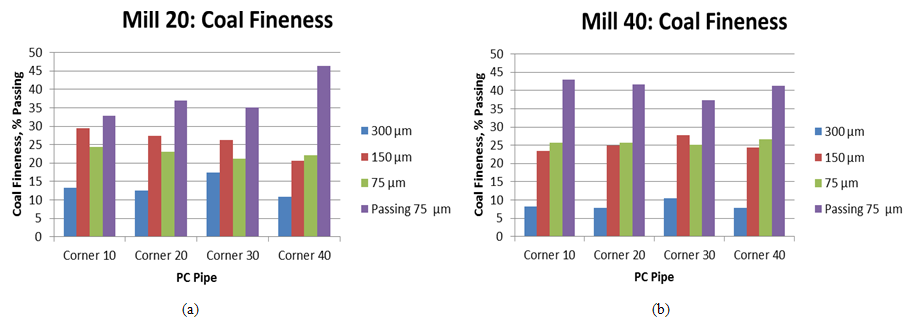 | Figure 7. Coal particulate fineness for (a) mill 20 and (b) mill 40 |
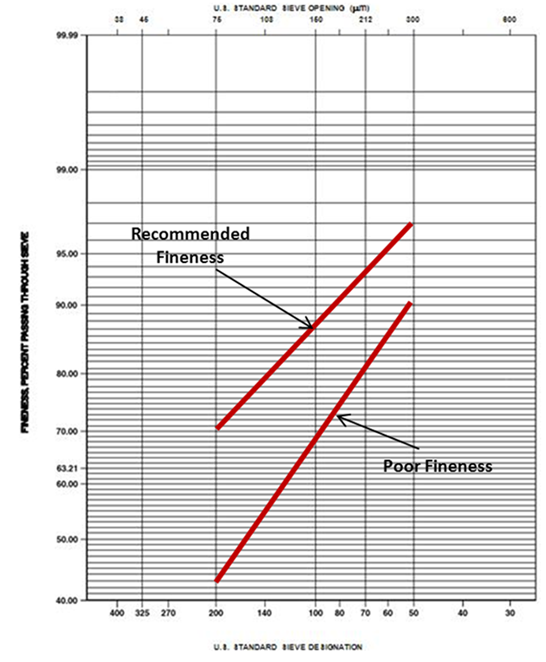 | Figure 8. Plot of coal fineness on Rosin and Rammler distribution [5] |
3.4. Furnace Rear Pass Temperature (FRPT)
- Figure 9 shows that the furnace rear pass temperature (FRPT) is in the range of 680 to 780°C, which is higher than the historical average of 680°C of the plant. The higher FRPT results in a higher flue gas exit temperature, which was caused by slower devolatilization rate of the coarser coal particles that was mentioned earlier. In addition, from our observation, FRPT is higher on the right hand side (RHS) than the left hand side (LHS) for mill 20. This could be caused by the mal-distribution of flow coal flow, where the coal flow into corner 40 (on the LHS) is significantly lower than the other corners.
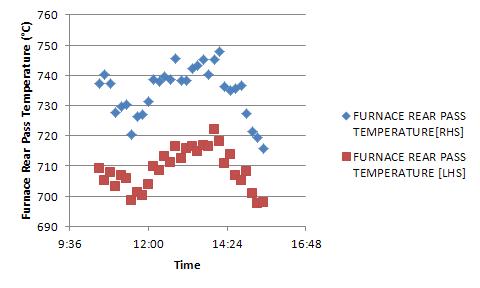 | Figure 9. Furnace rear pass temperature |
3.5. Unburnt Carbon
- From routine sampling and measurements, the amount of unburnt carbon in the ash samples is less than 1% (ref. Figure 10). The amount of unburnt carbon is within the acceptable limit although the mass flow distribution and coal particulate size are poor. It may be possible that unburnt carbon is not a good indicator for combustion efficiency, since the ash sampling point maybe too far downstream of the boiler (ref. Fig. 4) where the remaining unburnt carbon may have been consumed.
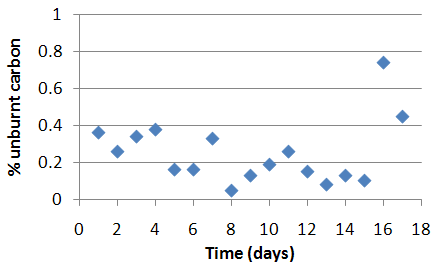 | Figure 10. Amount of unburnt carbon over a period of time |
4. Conclusions
- The velocities in the PC pipes (from the mills) were exceedingly high, resulting in a shorter residence time of the coal particles. As a result, the coal particles were coarser. More than 50% (by weight) particulates were within a 75 to 300 μm size range when sampled from Mill 20 and 40. There is also a mal-distribution of coal mass flow from the four PC pipes leading into the burners of the boiler. This caused a high rear pass temperature in the burner. Despite of the coarser coal particulates, the amount of unburnt carbon was low, with an average of less than 1%. Thus, unburnt carbon may not be a good parameter to indicate the combustion efficiency due to the ash sampling location, which may have been too far downstream of the boiler. The mal-distribution of coal mass flow and coarser pulverized coal particles are suspected to be the contributors to degradation of boiler efficiency due to the heat release from the combustion of coal occurred higher up in the boiler and higher on the right hand side than the left hand side. The recommendation to tackle this issue requires adjusting primary air flow to optimum.