-
Paper Information
- Previous Paper
- Paper Submission
-
Journal Information
- About This Journal
- Editorial Board
- Current Issue
- Archive
- Author Guidelines
- Contact Us
Journal of Civil Engineering Research
p-ISSN: 2163-2316 e-ISSN: 2163-2340
2014; 4(3A): 245-250
doi:10.5923/c.jce.201402.42
Assessment of Flood Index of Asahan River, North Sumatra, Indonesia
 Abstract
 Reference
 Full-Text PDF
 Full-text HTML
Rumilla Harahap1, Ahmad Perwira Mulia Tarigan2, Zulkifli Nasution3
1Faculty of Engineering, Universitas Negeri Medan, Medan, Indonesia
2Departement of Civil Engineering, Universitas Sumatera Utara, Medan, Indonesia
3Department of Agroecotechnology, Universitas Sumatera Utara, Medan, Indonesia
Correspondence to: Rumilla Harahap, Faculty of Engineering, Universitas Negeri Medan, Medan, Indonesia.
| Email: |  |
Copyright © 2014 Scientific & Academic Publishing. All Rights Reserved.
Frequent flooding in Asahan river is one of the hydrological events. This study was made to get the index value of the Middle, downstream and upstream watershed flood discharge accordance Asahan river conditions through analysis of rain. The study was conducted using primary data through surveys taken around the river and secondary data drawn from periodic reports issued by the relevant agencies. Rainfall data, discharge, land use was analyzed by the method of Gumbel and Log Pearson. The calculation of flood discharge is done by using the Rational method and Nakayasu. The study shows that the ability of the river is the return period of the flood discharge area design of 617.72 km² Annual is 2.89 km long river in the upstream region contained the maximum flood discharge on the 4th hour of 40.585 m3/s while began to rise in 2nd hour of 13. 226 m3/s. For the central region of the ability of the river is 150.30 m³/s, for 4 Hour with a return period of 25 years, area 34.22 km² and 49 km long flood discharge index 1.3. Ability to lower river is 210 852 m³/s for 4 hour with return period of 25 years, extensive shelf 178.51 km² and 49 km. The study also found that the flood period average index is 0.33 for 5 years, while the maximum flood discharge is 1447.229 m3/s. To flood discharge index was obtained for the 1.43 is 105.22 m3/s to 34.22 km2 wide. The benefit of this study is to reduce the pool of flooding potential along the Asahan.
Keywords: Asahan River, Hydrology Study and Flood Index
Cite this paper: Rumilla Harahap, Ahmad Perwira Mulia Tarigan, Zulkifli Nasution, Assessment of Flood Index of Asahan River, North Sumatra, Indonesia, Journal of Civil Engineering Research, Vol. 4 No. 3A, 2014, pp. 245-250. doi: 10.5923/c.jce.201402.42.
Article Outline
1. Introduction
- Asahan river is placed in Asahan district, North Sumatra Province, Indonesia. This river has two tributaries namely Piasa rivers and Silau River. The riverside areas of the Asahan river are used for residential, agricultural and industrial activities. The main problem of Asahan river is flash flood during rainy season causing economic losses to the people significantly and also damaging watershed areas, and therefore the management of river watershed of this river is very crucial to study in relation to plan a better management strategy. This is because watershed has an important role in dampening fluctuations of runoff after precipitation and stabilize or maintains the flow in the dry and rainy seasons [1]. Hydrological the rivers watershed management is a task to manage biophysics of the earth to achieve the maximum water discharge evenly throughout the year [2].A paucity studies have been conducted on river discharges and its watershed in Indonesia. Studies on the conservation of river watershed are very important in relation to conserve public interested and ecology [3]. This study is possibly conducted using a hydrological data, where one of the important data is rainfall. According to Suradi and Fouri [4], the rainfall data of highly fluctuating intensity was often simplified by using an average value that diminishes intensity fluctuation results. The other common problems are the accuracy of data, up-to-dateness, completeness, timely, meaningful and commensurate [5]. Therefore, the data needs to be validated prior to utilize. One of the important outcomes from this analysis is a flood index which will be useful in the river management. Generally the equal distribution of rainfall is commonly happening in small watersheds, but rarely occurs in large watersheds due to the intensity of rainfall in entire watershed is different. Study on the Asahan discharge was reported by Harahap [6], however, study on river flood index of this river has not been reported. Hence, the objective of the present study was to assess of flood index of Asahan River in North Sumatra, Indonesia.
2. Data and Method
- The study was conducted in Asahan River which is situated at eastern part of North Sumatra, Indonesia (02°03’-03°26’N, 99°01’-100°00’E). The river is bordered by Deli Serdang District in north, Labuhan Batu District in the south, Simalungun District in the west and Malacca Strait in east. The rainfall data were collected from five meteorological stations; (1) Terusan Tengah, (2) Pulau Maria/Pulau Kemuning, (3) Simpang Kawat, (4) Ujung Seribu and (5) Balige. (Figure 1)
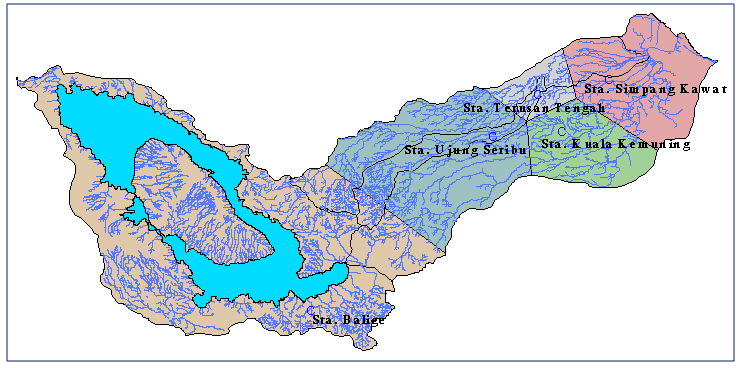 | Figure 1. Station spread rain in the watershed Asahan |
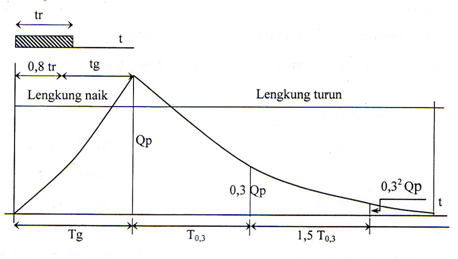 | Figure 2. Nakayasu method |
2.1. Procedure
 ; Tp = tg + 0,8 tr ;tg = 0,21 x L0,7(L < 15 km)tg = 0,4 + 0,058 x L(L > 15 km) T0,3 = α x tgWhere, Qp= flood peak discharge (m3/s), C= coefficient of drainage, Ro= rain unit (mm), A= watershed area (km2), Tp= interval period from the beginning of the rain until the flood peak (hour), T0.3= the times required to decrease flood discharge up to 30% of the peak discharge (hour), tg= concentration time (hour), tr= time rain unit (1 hour), α= parameter of hydrograph, the value ranged between 1.5 to 3.5 and L= river length (m).
- The Nakayasu hydrograph formula as follow:Curved up, 0 ≤ t ≤ Tp, where
 Curved down, Tp < t ≤ (Tp + T0,3), where
  , (Tp + T0,3) ≤ t ≤ (Tp + T0,3 + 1,5T0,3), for
  ,and t > (Tp + T0,3 + 1,5T0,3), where
  The time series data of runoff discharge from 2001 to 2012 will be used to estimate the water stock for watershed of Asahan River. Inflow discharge index is defined as the ratio between the flood discharge that occurs reduced with minimum discharge at interval period between the maximum with the minimum discharges as the formula:
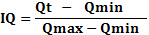 Where, IQ = inflow discharge index, Qt = flood discharge, Qmin = minimum discharge causes flooding, and Qmaks = maximum discharge causes flooding.
 3. Results and Discussion
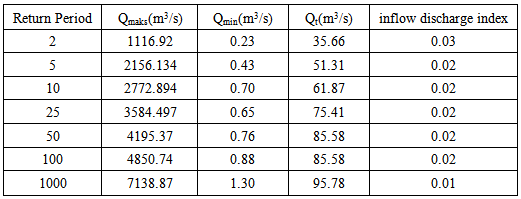
- The results of the analysis of rainfall and return period is calculated based on the Gumbel method. Rainfall tends to increase in 25-year return period frequency factor K for the Gumbel distribution method greatly affect the greater the frequency factor, the greater rainfall. Significant difference from the results of rainfall. This difference can be clearly seen in Fig. 3 where the Gumbel method based rainfall tends to be greater in the long period of re-precipitation compared with those obtained by other methods. Results Normal precipitation Method and Method of Log Pearson tend to be almost equal to the return period is short (<10 years). The results of the calculation of the Asahan River region flood discharge design is listed in Table 1 with Synthetic Unit Hydrograph calculations based on Nakayasu method. Results of the calculation of 5th Annual flood discharge obtained maximum flood discharge on the 4th Hour by 103.295m3/dt is also is listed in Table 1.
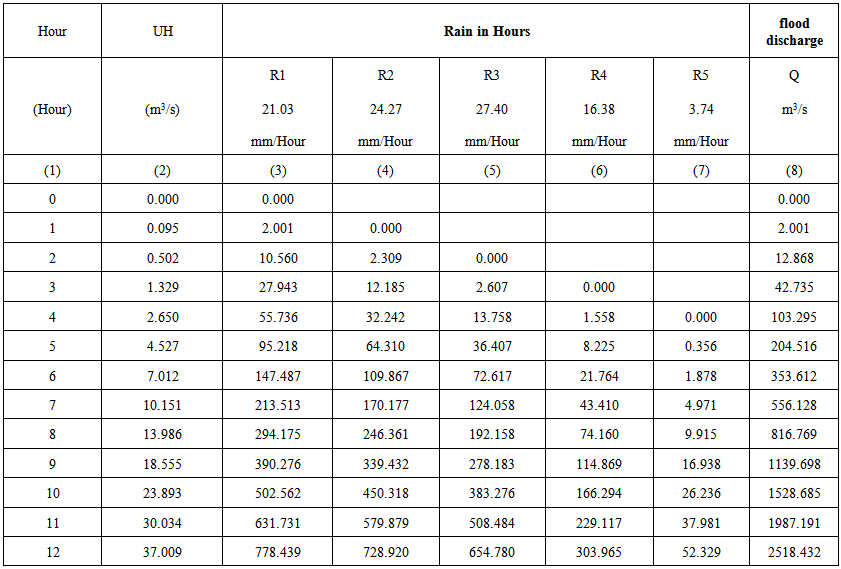 | Table 1. Design of flood discharge 5 Year Period |
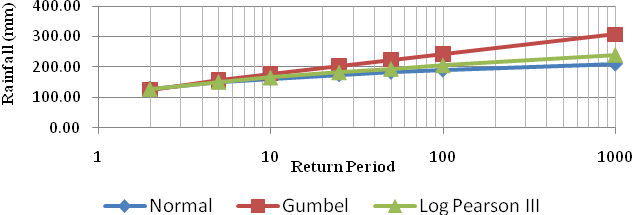 | Figure 3. The relationship between the design rainfall and return period |
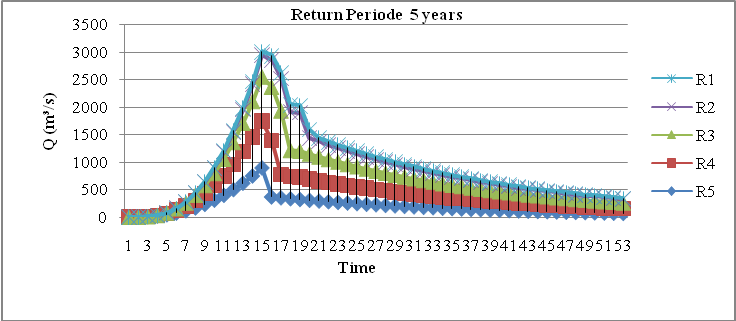 | Figure 4. Distribution debit banjir sungai Asahan |
|
|
|
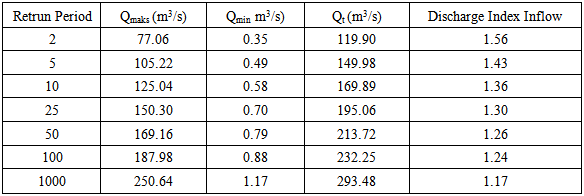
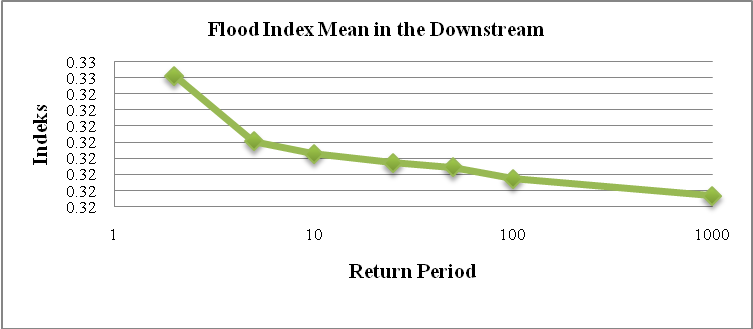 | Figure 5. Flood Index Mean in the Downstream |
4. Conclusions
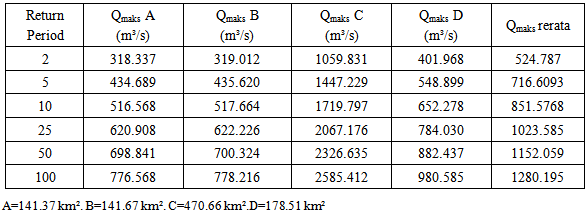
- Ability Asahan river of middle Asahan river flood index to 34.22 km2, wide 49 km long return period 2 years of maximum flood discharge was obtained for 77.06 m3/s with Index input floods at 1.56. Return period of 100 years the maximum flood discharge obtained at 187.98 m3/s with Index input floods of 1.24. Asahan River downstream area of 141.37 km², 2 year return period flood discharge of 318.337 m3/s. Return period of 100 years the mean flood discharge is 1280,195 m3/s. Appropriate conditions Asahan river, for a period of 5 years flood index average of 0.33, the maximum flood discharge 1447.229 m3/s. Index inflow discharge at 1.43 with the maximum inflow discharge 105.22 m3/s area of 34.22 km2. Hydrology study on the pattern of rainfall as the cause of the flood discharge is an indicator of the index discharge that contributes to the flooding.
ACKNOWLEDGEMENTS
- The authors are grateful to Prof. Dr. Retno Widhiastuti as the chairman of the Doctoral Program PSL Universitas Sumatera Utara (USU) for the motivation and advice, so that almost the completion of my dissertation writing. Thanks also goes to the Dean of the faculty UNIMED Engineering Prof. Abdul Hamid K.M.Pd, the chairman research institutes Universitas negeri Medan (UNIMED) Prof. Dr. Manihar Situmorang.