Novdin M. Sianturi
Department of Civil Engineering, Universitas Simalungun, Indonesia
Correspondence to: Novdin M. Sianturi, Department of Civil Engineering, Universitas Simalungun, Indonesia.
| Email: |  |
Copyright © 2014 Scientific & Academic Publishing. All Rights Reserved.
Abstract
The study of performance of clean water reservoir systems is absolutely necessary especially after operating for over 10 years. In this regard, the study covers the operational optimization to fit the desired plan of the company in meeting the continuity and the quantity of service water needs, and the ability of the water reservoir to meet the needs of water service for the next few years. The reservoir and distribution of pipes are safe against earthquakes that occur in the year 2012. The damage does not occur on a reservoir and a pipeline distribution. The customer usage in peak usage hours 06.00-8.00 and 17.00-19.00 is still in accordance with the standards of the peak hours and the minimum limit of the water in the reservoir and in accordance with the criteria and requirements per person/day. It still meets the ideal water capacity in the reservoir of 37,324 l/sec and is still able to serve the addition of new connections around 4.1296 SR for the next few years. The level of leaks on the distribution of drinking water 30.79% can be suppressed by means of fixing the main meters on the reservoir each year so that the rate of leakage in water distribution can be minimized.
Keywords:
Earthquake, Management, Reservoir and distribution
Cite this paper: Novdin M. Sianturi, Performance of Clean Water Reservoir in Pematangsiantar, Indonesia, Affected by Earthquake, Journal of Civil Engineering Research, Vol. 4 No. 3A, 2014, pp. 237-244. doi: 10.5923/c.jce.201402.41.
1. Introduction
1.1. Background
To support customer services, PDAM Tirtauli Pematangsiantar, a clean water company, has been seeking support for the various components so that the aspects of quality, quantity, and continuity can be fulfilled. One of these important supporting components is a reservoir. In 1977 PDAM Tirtauli Pematangsiantar has built a reservoir in Siantar Marimbun Pematangsiantar with a ground capacity 1500 m3, debit 249 l/s derived from spring Mual Goit.A reservoir serves to hold the water before it is distributed to customers. The amount of water usage by the customer during 24 hours is surely not constant. At a time when most of the customers using the water called the peak hours, while at the time the customer uses little or no water is called the minimum hours/empty where water will be accommodated in the reservoir, so that at peak hours, the flow can be distributed evenly.As one of the infrastructure (basic infrastructure), clean water is needed by consumers and its existence must be sufficient both in quantity and quality, and there should be all the time (continuity). The availability of sufficient water can be fulfilled when there are sufficient water resources to meet the water needs [1].There are three ways of distributing clean water worth consumed. (1) the water from the source directly streamed to the customers is called the flow of distribution; (2) the water from the source of the streamed to the reservoir with the average flow, then from reservoirs further channeled to the customers/consumers; and (3) the water from the source of the streamed to the processing units, then from the processing units, water flowed into the reservoir of the distribution reservoir, distributed to all areas of service [1, 2].
1.2. Drinking Water Supply Management System
The existing water treatment effort, from not meeting quality standards into the water that meets the quality standard is required. It's done with an attempt to create a management system providing decent clean water is consumed by the customer. In general, the management system can be examined in the following way:§ Production systems. The process of fetching water from the nature, then turn it into a decent water to be consumed by humans. This process is called raw water intake.§ Distribution system. Is the main part of the water supply system, which consists of a pressurized piping network to reach out to its customers in the services area. Components of the distribution system are the water shelter (reservoir), piping systems and customer connection system. 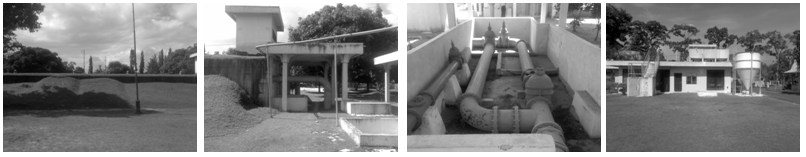 | Figure 1. Tong Marimbun Reservoir, PDAM Tirta Uli Pematangsiantar |
1.3. Reservoir
Several aspects that should be evaluated on a reservoir: (1) the type of clean water storage facility, (2) the material of construction, (3) the functions and basic purpose, (4) reservoir performance, (5) clean water drainage systems, (6) construction, (7) layout, (8) pipeline equipment, (9) the method of capacity calculation, (10) the percentage of service, and (11) to calculate the capacity of a reservoir by using methods of the chart [1, 3]. A reservoir means reservoirs/ponds of water or water storage. The shape of the reservoir varies, depending on the designer, but building a reservoir should be made symmetrical and regular facets. In addition to the ease in making, it is also in capacity calculations [4-6].
1.4. Earthquake
An earthquake is a natural phenomena or disasters that are destructive and can be classified into four types namely [7, 8]:§ volcanic earthquakeThis earthquake was caused by magma activity before the volcano erupted. When its activities are increasingly high, the explosion would cause the onset which will also lead to the occurrence of an earthquake. The quake was only felt in the surrounding mountains.§ the tectonic earthquakeEarthquakes caused by tectonic activity. Tectonic plate shifts, suddenly have the strength from very small to very large. This earthquake caused much damage or natural disasters on Earth. A strong earthquake vibration may spread to the whole earth.§ earthquake debrisEarthquakes usually occur in areas of limestone or mining area, earthquakes are rare and local.§ the artificial earthquakeArtificial earthquake was an earthquake that caused by human activity, such as dynamite blasting, nuclear or hammer hitting onto the surface of the Earth.Based on strength or magnitude (M), earthquakes can be distinguished into:§ A huge earthquake with a magnitude greater than 8 SR§ The massive earthquake with a magnitude between 7 to 8 SR§ Damaging earthquake with a magnitude between 5 and 6 SR§ A large quake with a magnitude between 4 and 5 SR§ A small earthquake with a magnitude 3 and 4 SR§ A micro earthquake with a magnitude between 1 to 3 SR§ The ultra micro earthquake with magnitude less than 1 SRUnder the Earth's crust there is a layer of hot rocks in the shape of soft and mild. The crust is formed from iron and nickel with a portion of the middle. The solid crust thickness can reach 70 km below the row of mountains in the world. Most of the earthquake came from the Earth's crust. Sometimes earthquakes can also occur at a depth of 700 km below the Earth's surface [7].
1.5. Management
The company's loss can be minimized through supervision based on the existing data in the field, combined with existing data in reservoir in detail. With a combination of this data, it will be found where the leak is occurring, whether in the distribution pipeline or on the stem or on the meter gauge on consumers [9, 10]. Management of clean water distribution network is not detached from the process of management and reservoir which has been established by PDAM Pematangsiantar Tirtauli. PDAM Tirtauli Reservoir located in Kecamatan Marimbun Siantar Pematangsiantar should pay attention to proper water treatment processes until the water gets to the customer, volume of water out of the reservoir to the consumer should not be the same, because when it is larger then the company will continue to lose money [5, 10].If the distribution network is not appropriate, then the PDAM Tirtauli must be carried out routine maintenance to the entire network of distribution pipes, from the reservoir to the consumers by way of re-check every stem and consumer’s meter each month.
1.6. Drinking Water Distribution
Water Distribution tariff policy greatly affect the PDAM Tirtauli operational continuity. Consumers can judge whether or not a decent distribution rates to be increased. To adjust and increase the distribution of drinking water rate, PDAM Tirtauli should improve their services [11].
2. Data Discussion
2.1. The Description of Siantar Marimbun Reservoir
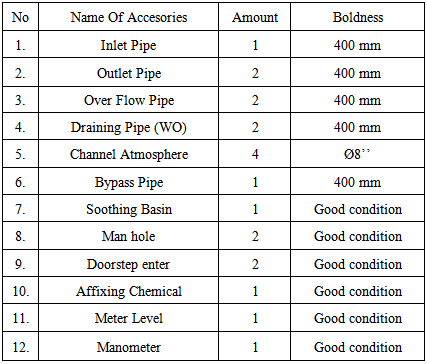
The Reservoir serves to distribute clean water to the South service zone. The number of subscribers as of December 2010 is 18.790 connection, Sub-district Simarimbun as 6 villages, Sub-district Siantar Timur as 7 villages, Sub-district Siantar Selatan as 6 villages, Sub-district Siantar Marihat as 7 villages, Sub-district Siantar Barat as 2 villages, Battalion 122 and Palm Oil Research Center Marihat housing [7, 12, 13]. Reservoir of Tong Marimbun equipped with multiple fixtures with their respective functions in order to run smoothly according to Table 1.Table 1. Equipment of the Reservoir
 |
| |
|
2.2. The Image and Working-Schema of the Reservoir
The water from the source passes through the inlet pipe fills the reservoir basin. § The water passes through 7 compartments to precipitate the water. § After passing the 7 compartments, the water out through the outlet pipe to a distribution system. § When water entering the inlet pipe, the water first affixed with chlorine and calcium oxide. § Once out of the inlet pipe, the water flowed into the furthest part of the reservoir.Primary data was obtained from Reservoir Simarimbun at the time of measurement or field observation. These data include: (1) Debit Outlet. From the observed data (meter readings outlet) obtained debit outlets at ground reservoir Simarimbun (day 1 to day 3) and, (2) the Debit Inlet, is the data calculation of inlet debit in ground reservoir Simarimbun on 25-28 June 2011 (day 1 s. d day 3).Peak Hour periods occurred at 06:00, 07:00, 08:00 and 17:00, 18:00, 19:00 because at that time the customers have already begun activities so that water consumption is very high. Based on observations in the field during the peak hours of 18.00, the height of the water and the availability of clean water in the reservoir are still at a safe level. Pressure measurements done at some point in the distribution line by using a manometer. Measurements made at the nearest and farthest SR. Pressure on nearest SR 0.3 ATM and at the farthest SR 0.7 ATM.
2.3. Customer Growth in the South Zone, and Water Need/Month
Tong Marimbun Reservoir has a volume of 1,500m3. The water comes from springs of Mual Goit, debit 248.63 l/s. Reservoir dimensions cannot be measured directly at the time of the measurement because the water never runs out in the reservoir, the highest level in the reservoir located at level 40.Based on Secondary Data from the PDAM Tirtauli Pematangsiantar that debit inlet in Simarimbun Reservoir fluctuate because before entering the reservoir, there is the addition of debit of 8.34 l/sec with pump system from the spring of Sibulak-bulak (Simarimbun Dolok) so that the debit increases at the pump operation.The service of PDAM Tirtauli especially the South Zone service area until December of 2011 of 77,02%. South Zone Service coverage and Secondary Data serve as the supporting data in the preparation of this research report [12, 13]. 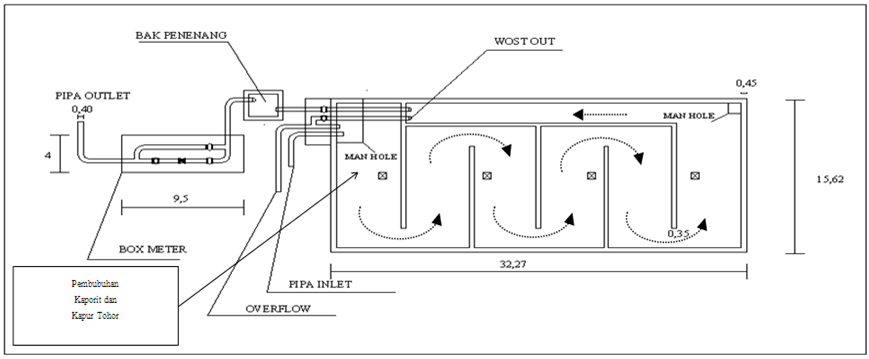 | Figure 2. Working-scheme of a reservoir |
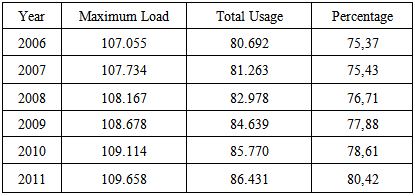
The data quantity of water sold in the service area obtained from the Subscription Relationship of PDAM Pematangsiantar are shown below:Table 2. Total Sales-Water Service Reservoir Siantar Marimbun, Pematangsiantar
 |
| |
|
2.4. The earthquake Epicenter Measurement Chart
To calculate the distance of the epicenter can use the common formula by using graph as shown in Fig.3.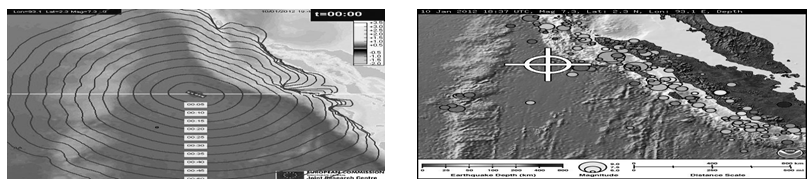 | Figure 3. The earthquake vibrations measurement chart |
2.5. Graphical Calculation of Effective Reservoir Volume
The graphical calculation of water demand is conducted by creating a graph of water demand fluctuations, which illustrates the need of water during the period of 24 hours, where the water requirement is stated in m3 / h, the interval is one hour, and the average consumption are also stated in m3 / h obtained from the total demand divided by 24 hours a day. The volume accumulation of water used per hour illustrated with a thick chart (blue), while the average water needs are illustrated with rhombus graphs (red).The calculation water volume is done by drawing lines:§ Aligned with the average requirement graph, which is brought to the highest fluctuation graph, and then draw a graph.§ Aligned with the average requirement chart, which is brought to the lowest fluctuations graph. The vertical difference is the effective reservoir volume. In this case the effective volume is less/more 900 m3.
2.6. Mathematical Calculation of Reservoir Volume
Reservoir volume calculated and expressed in the form of numbers. With the help of tabulations we can see the fluctuations of water usage.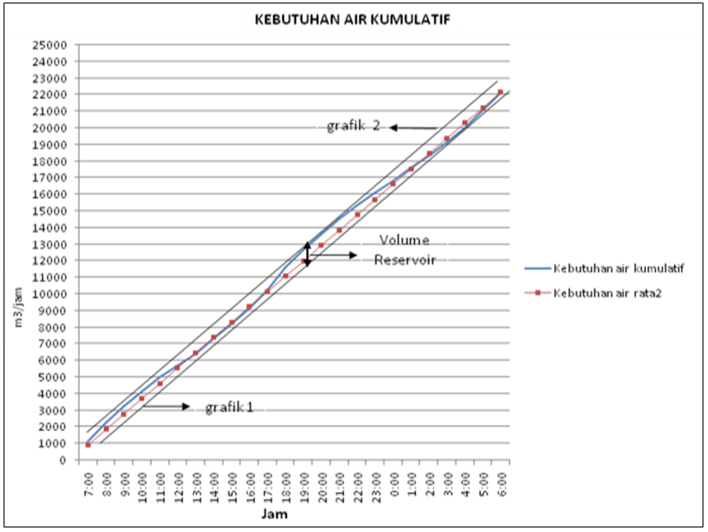 | Figure 4. Fluctuations of Water Needs |
Table 7 shows the calculation of the effective volume of the reservoir, where the margin between the maximum (679.875) m3 and minimum (-229.125) m3 is 909 m3.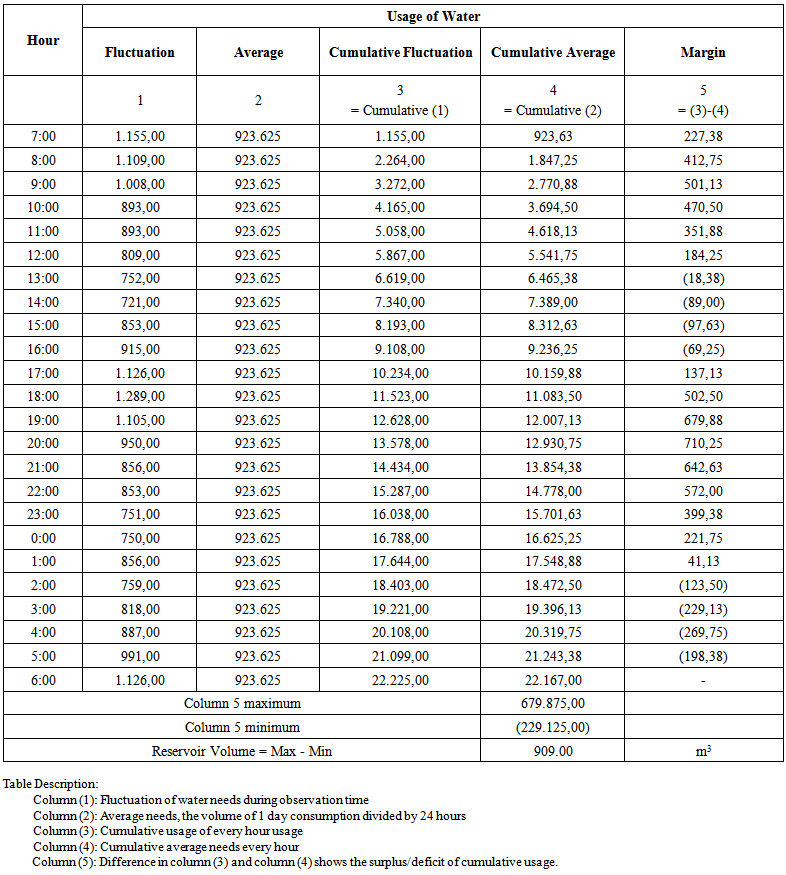 | Table 7. Mathematical Analysis of Total Water Supplies |
2.7. Calculating Reservoir Volume Based on the Extent
Volume = base area x height Tub size: From the detailed image of Simarimbun Reservoir obtained data as follows:§ cross-section length = 32.27 - (2 x 0.45) = 31.37 m § cross-section width = 15.62 - (2 x 0.45) = 14.72 m§ maximum water height = 3.5 m Base area = Length x Width = 31.37 mx 14.72 m = 461.7664 m2Volume = (base area x height) = (461.7664 x 3.5) = 1616.18 = 1616.18 m3So, the volume of Simarimbun Reservoir = 1616.18 m3
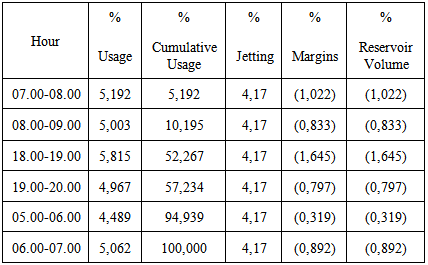
2.8. Calculating Reservoir Volume Based on the % of Usage Fluctuations
The data required for calculating the volume of the reservoir:§ The debit of average usage of reservoir§ Water consumption per hourThe data is then inserted into the calculations table.Table 8. The Percentage of Reservoir Volumes
 |
| |
|
2.9. Calculating Reservoir Volume Based on Fluctuation Usage
Q mean = 0.25656 m3 / sec = 22167 m3/ day Percentage of reservoir contents (%) = largest – smallest percentage = 2.12318 - (-2.32447) = 4.44765 % Reservoir volume= (2.12318 - (-2.32447)% x 22167) = 986 m3
2.10. Calculating the Percentage of Reservoir Services
The percentage of reservoir services can be calculated by the formula:=  x 100%The water availability in the reservoir is calculated by the amount of water delivered per day by looking at the usage fluctuations during the observation. According to Subscriptions Relations Subdivision of PDAM Tirtauli, the total water requirement is obtained from the summary of water use within 1 month.The actual water consumption in June 2012; domestic needs (group II), the use of 350,481 m3/month or 88.99% of the total consumption, non-domestic needs (group IIIA + IV + V), the use of 32,098 m3 / month or 8.15% of total consumption, and social needs (group I), the use of 11,269 m3 / month or 2.86% of the total usage.The volume of water consumption from the service area in June 2012 of 393,848 m3 / month and if it is assumed there is leakage in the distribution network by 20% or 78,770 m3 / month, the total water requirement in the service area of 472,618 m3 / month or 15,754 m3 / day.Water requirement per person per day can be calculated as follow:=
 =
= = 0.146 m3/person/dayPercentage of service of Simarimbun reservoir:Calculated based on the fluctuations of usage (wet volume)=
 =
=  x 100%= 6.26 %The percentage of maximum service in the reservoir is 6.26%.
2.11. Calculating Water Requirements
Total water requirements calculated by looking at the population of service area.= number of SR served x 4.5 persons per SR (assumption)= 17,823 SR x 4.5 person= 80,204 personThe population in 2010 = 109,114 personService level 80% x 109,114 = 87.291 person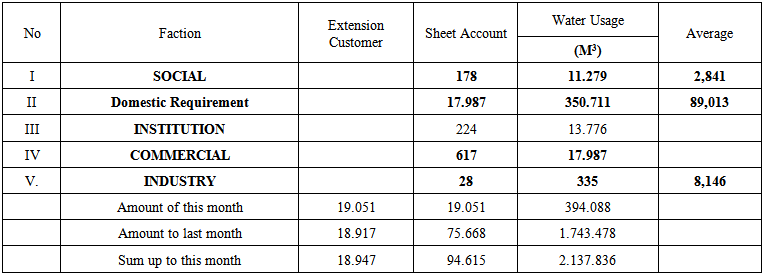 | Table 11. Total water use in June 2012, Reservoir Simarimbun Service Area |
Based on the water sales in the service area:= =
= = 164,917 l/secTotal sales = 164,917 l/sec. If we assume that the service level of 80%, then:=
 x water sales – water sales =
  x 167,917 l/sec – 167,917 l/sec= 41,229 l/secTotal distribution = 164,917 l/sec + 41,229 l/sec = 206,146 l/secIdeal capacity:= Q area – total water distribution= 252,8 l/sec– 206,146 l/sec = 46,654 l/secIf it is assumed the leakage by 20% then:=
  x remnant =
  x 46,654 l/sec = 9.33 l/secSo the ideal capacity can still be used:= 46,654 l / sec - 9.33 l / sec= 37,324 l / secThe number of SR can still be served:=
  x total SR =
  x 17,823 SR = 4,033 SRSo, with Q = 37,324 l / sec, still able to serve 4,033 SR.Since the outlet pipe using Pipeline Steel (steel castings) which has been aged, the Chw or roughness of the pipe is 100, with a diameter of 400 mm, then the size of Q is:Q = 0.2785 x CHW x 0.4 x 2.63 S 0.54Q = 0.2785 x 100 x 0.4 x 2.63 0,0110,54Q = 0.21908 m3 / secQ = 219.08 l/secVelocity evaluation: v =
  A = cross-section areaSo,v =
  v =
v =  v = 1,744 m/sec
2.12. Epicentral Method
Epicentral is the distance of the epicentrum from the seismic recording station. To determine the epicentrum by using the epicentral method, it requires at least three seismic recording station, so that the epicentral distance can be measured from each station. We use the LASKA formula to determine the distance of the epincentral:Delta = ((S-P) – 1’) x 1,000 kilometers)Epicentral delta = distance from the station (in km) SP = time recording interval between the primary and secondary wave (in minutes) 1’ = 1 minuteTo determine epicentral distance of each station:Delta A= ((2 30’ 40” - 2 28’ 25”) – 1’) x 1,000 mil = (2’ 15” - 1”) x 1,000 mil = 1’ 15” x 1,000 mil (for 1’ = 60” so (1 x 1.000) + (1,000 x 15/60)) = 1,250 km Epicentrum distance from station A is 1,250 mil. Delta B = ((2 33” 45” - 2 30’ 15”) - 1’) x 1,000 mil = (3’ 30” - 1’) x 1,000 mil = 2’ 30” x 1,000 mil (2 x 1,000) + (1,000 x 30/60) = 2,500 km Epicentrum distance from station B is 2,500 km.Delta C= ((2 36’ 15” - 2 32’ 15”) - 1’) x 1,000 mil = (4’ - 1’) x 1,000 mil = 3’ x 1,000 mil = 3,000 km Epicentrum distance from station C is 3,000 km.From the example, the distance of the epicentrum from the reservoir and distribution pipe for instalation channel still is in a safe condition (A)
3. Conclusions
From the study on the Earthquake and Management System of Simarimbun Reservoir PDAM Tirtauli Pematangsiantar can be concluded:1. The conditions still safe against the earthquake, there is no damage to the reservoir and distribution pipelines. The Q services are still met until afternoon since the water in the reservoir still above the minimum limit. Through the results of the calculation and by repairing the main meters, current reservoir still capable serving the needs of customers.2. The Simarimbun reservoir has the ideal production capacity of 37,324 l / sec and able to serve new connections of 4,033 SR for the next several years, sevice continuity is still met. Peak hours occur at 6:00 to 8:00 and 17:00 to 19:00 as the use of water by customers are very high, peak hour factor is 1:39 and the debit of 358.06 l / sec.3. The minimum limit of water in the reservoir is still in appropriate criteria of 1:18 meters. Requirement per person / day of the service area 0.146 m 3 / person / day. Evaluation of reservoir inlet debit water meter should be mounted on the inlet pipe to prevent overflow and excessive.4. PDAM Tirtauli Pematangsiantar should establish a Standard Operating and Procedures (SOP) to maintain performance and service satisfaction.
ACKNOWLEDGEMENTS
The authors would like to thank the Board of Directors of PDAM Tirta Uli Pematangsiantar who has provided opportunities and providing facilities in the study of the existing conditions in the reservoir Tong Marimbun PDAM Tirta Uli Pematangsiantar.
References
| [1] | Sutrisno C, Totok dkk, Teknologi Penyedian Air Bersih, 1991. |
| [2] | Kodoatie, Robert J., and Sjarief Roestam. Distribution Integrated Water Resources in Indonesia. Presented in the "Workshop on the Review of the National Policy of Water Resources Management" Directorate of Water Resources and Irrigation Bappenas. On Wednesday Date April 4 2007. The Sultan Hotel (Hilton) Jl. Gatot Subroto, Jakarta 10002. |
| [3] | Departemen Pekerjaan Umum Badan Pendukung Pengembangan Sistem Penyediaan Air Minum, Operasi dan Pemeliharaan Unit Distribusi, 2009. |
| [4] | Robert J. Kodoatie. Spatial Groundwater, Publisher Andi, Yogyakarta, 2012. |
| [5] | Sarwoko M, Ir, Penyediaan Air Bersih 1 Dasar-dasar Perencanaan, Teknik Penyehataan FTSP - ITS, 2001. |
| [6] | The Global Water Partnership (GWP) Integrated Water Resources Management. Box GWP, Stockholm, Sweden. 2001. |
| [7] | Vernes, DJ, Slope Movement Types and Processes, in Landslides, Analysis and Control of Transp. 1978. Res. Bd. Spec. Rep. 176, PP. 11-33. |
| [8] | Walton, WV. Groundwater Resource Evaluation. McGraw Hill. 1970. |
| [9] | Todd, D.K., Groundwater Hydrology. 2nd. John Wiley & Sons, New York. 1980. |
| [10] | Tri Joko, Ir, MSi, Unit Air Baku Dalam Sistem Penyediaan Air Minum, 2010. |
| [11] | Dunne, Thomas and Leopold B, Luna. Water in Environmental Planning. W.E. Freeman and Company, New York. 1978. |
| [12] | Martin Darma Setiawan, Ir, MSc, Sistem Perpipaan Distribusi Air Minum, 2004. |
| [13] | Novdin M Sianturi, Proseding Seminar Nasional Teknik Sipil X-2014, Kajian Terhadap Sistem Manajemen Pada Reservoir PDAM Tirtauli Kecamatan Siantar Marimbun Kota Pematangsiantar, p. 699, 2014. |
 Abstract
 Reference
 Full-Text PDF
 Full-text HTML