Rumilla Harahap, Kemala Jeumpa, Bambang Hadibroto
Universitas Negeri Medan, Medan, Indonesia
Correspondence to: Rumilla Harahap, Universitas Negeri Medan, Medan, Indonesia.
| Email: |  |
Copyright © 2014 Scientific & Academic Publishing. All Rights Reserved.
Abstract
One of the causes of drainage conditions in some places does not work anymore is due to the smaller capacity of the existing discharge, lack of care or the drainage systems and disposal that is no longer compatible with the environment, thus resulting in flooded every year. This study aim to investigate the intensity of the rain and drainage capacity in the city of Medan, North Sumatra, especially Medan Selayang area, to evaluate the regulation of drainage system in Medan city in order to reduce excess water. The evaluation of drainage in the analysis through the Rasional method. The results shows that the peak of flood discharge obtained in the catchment area of the drainage network system for 10 year return period is 29.697 m3/s.
Keywords:
Medan Selayang, Drainage system, Rational Method
Cite this paper: Rumilla Harahap, Kemala Jeumpa, Bambang Hadibroto, Drainage Systems for Flood Control in Medan Selayang, Indonesia, Based on Rainfall Intensity and Drainage Evaluation, Journal of Civil Engineering Research, Vol. 4 No. 3A, 2014, pp. 233-236. doi: 10.5923/c.jce.201402.40.
1. Introduction
Physically city of Medan region shows a relatively small height difference, surplus water from upstream areas greater than downstream areas, the ability of the soil to absorb water into the city has decreased because of the less open land [1]. The changes in land use becomes vacant housing will increase the flow of water through drainage systems and rivers [2], also the flood due to changes in weather/climate contributed significantly contribute to flooding the city of Medan. The goal of this research is to analyze and evaluate the intensity of the rain drainage channels in the city of Medan and to predict technically the periodic flood discharge using the Rational method as a reference in the drainage discharge.
2. Literature Study
Each activity is involving objects, such as housing, offices, and industries must consider the flow of rain water. Each activity is involving objects, such as housing, offices, and industries must consider the flow of rain water. The development of land is usually followed by the addition of water-resistant coating that results in an increase in the rate and volume of runoff. Hydrological analysis is a field that is very complicated and complex. This is due to uncertainty in hydrology, the limitations of the theory and data recording, as well as economic limitations. The rain is unpredictable events. That is, we can not predict with certainty how much rain will occur over a period of time.
2.1. Hydrology Analysis
Understanding of hydrological processes important in the conservation of water and soil to determine between water availability and water demand in the surrounding watershed to the sea. hydrological cycle [3]. Inside the a watershed, natural resource characteristics can be identified in detail with regard to topography, soil, geology, geomorphology, vegetation, land use, hydrology and human. As known characteristics of the watershed such as Fig.1, you will get a general overview of the nature and condition of drainage characteristics that are useful for the preparation and analysis of drainage. 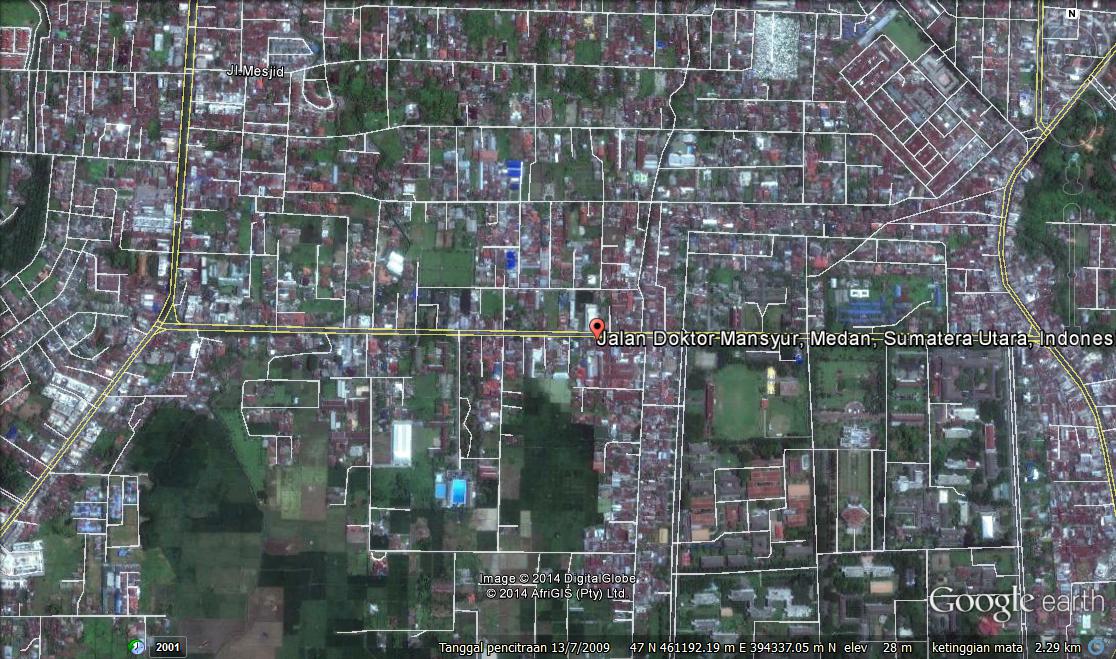 | Figure 1. Map of research location |
2.2. Frequency Analysis
Frequency analysis is the procedure of estimating the frequency of an event in the past or future. The procedure can be used determine the design rainfall in different time based on the theoretical distribution of rainfall with rainfall distribution empirically. Rain this design is used to determine the intensity of rain is required in estimating the peak flow rate (flood discharge).
2.2.1. Normal Distribution
Normal distribution or normal curve is also called the Gaussian distribution. Density function of the normal opportunities (PDF = probability density function) is the best known bell shape and is known as the normal distribution. PDF normal distribution can be written in terms of the average and standard deviation, as follows: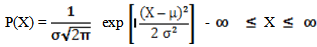 | (1) |
2.2.2. Log Person type-III Distribution
The following are the steps of using a distribution Log Person type-III:1. Calculate the average value: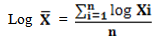 | (2) |
2. Calculate the standard deviation of the value: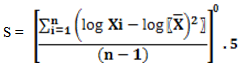 | (3) |
3. Calculate the coefficient of skewness: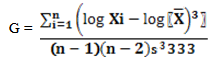 | (4) |
4. Calculating the logarithm of rain or flooding with return pertiode by the formula: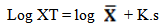 | (5) |
2.2.3. Gumbell Distribution
The form of the equations used in the method is Gumbell: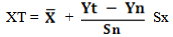 | (6) |
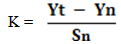 | (7) |
Yt(reduced variate), Yn (middle of value) and Sn (Standard deviation)
2.3. Chi Square Test
By knowing the value of rainfall for a certain return period with a variety of distributions it is necessary to test the suitability of the distribution of the chi squared test, if the two distributions are then qualified in use is the smallest α has a significant number. Counting the number of the class, making class groups according to the number of classes, calculate the frequency, look for the amount of rainfall that fall into the class boundaries, determine μ2 cr from table to determine the significance level (α) and degrees of freedom (v). Summing up the results of arithmetic calculations when μ2 <μ2cr the distribution are met and if the count value μ2 > μ2 cr then the distribution is not met.
2.4. Time of Concentration (TC)
Time of concentration is the time required by runoff or flow from the farthest point in the drainage up to the point review or in other words the time of concentration is the longest water journey towards a point to review. The time of concentration for the drainage area has been evaluated using the Kirpich method, following: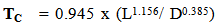 | (8) |
Tc Flood is the concentration time (hours), L is the channel length and D is the slope of the irrigation channel.
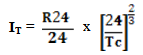
2.5. Rainfall Intensity
Rainfall IIntensitas It is denoted by the unit (mm / h), meaning high rainfall so (mm) in the period per / hour. Rainfall data that already exists, then the intensity of rainfall is as follows: With the Mononobe formula. For 2 hours 
 | (9) |
2.6. Rational Method
The general form of this Rational method is as follows:  | (10) |
3. Data Analisys and Discussion
3.1. Gumbell Distribution Frequency Analysis
Step by step calculations to find the rainfall plan Gumbell method is as follows:1. Sort the maximum rainfall average from large to small. Analyze selected based distribution to get the rain with a certain return period. 2. Factors determining the distribution of the type of test selected distribution:v  =
=  =
=  = 141,1 mmv standard deviation (Sx)
 Sx =
Sx =  =
=  = 93,623 Coefficient of Skewness (Cs);
  Cs =
Cs =  x Σ
x Σ 
 Cs=
Cs=  x Σ
x Σ  = 2,884v Coefficient of Kurtosis;
  Ck =
Ck = 
 Ck=
Ck=  = 5,972v Coefficient of Variation;
 Cv=
Cv=  =
=  = 0,6635 3. Determining the value of Yn and Sn obtained after analysis: N = 10, So that the values obtained: Yn = 0,4952; Sn = 0,9496 4. Determining the value of XT with when return period 2, 5, 10, 15, 20, 25, 30, 40, 50, 100.v 2 years
 YT = -0,3665; K =
  =
=  = -0,1355 then:
  XT =
XT =  + K. Sx; X2 = 141,1 + (-0,1355 x 93,623 ) = 128,412 mmv 100 years
 YT = 4,6001; K =
  =
=  = 4,3228 then:
  XT =
XT =  + K. Sx
  X100 = 141,1 + (4,3228 x 93,623) = 545,815 mm
3.2. Calculation Debit Rational Method
The regional of catchment area in Medan Selayang survey has the following properties namely catchment area 1,875 km2, the length of the channel 1.50 km, high 1 – 1.5 width 1.5 - 2 m; and the slope of the subgrade (D) is 0,0375.
3.2.1. Time Concentration (TC)
(TC) rainfall is the time of concentration (hours), using the formula Kirpich.TC= 0.945 x (L1.156/ D0.385) = 0.945 x (1.501.156/ 0.03750.385) = 5,35 hours
3.2.2. Rainfall Intensity
The intensity of rainfall is rainfall or high water depth per unit time.With Mononobe formula.For: 2 hours IT=  x
x  During the 2 year : I2 =
  x
x  = 36,910 mm/ hoursThe results are depicted in Fig. 2.
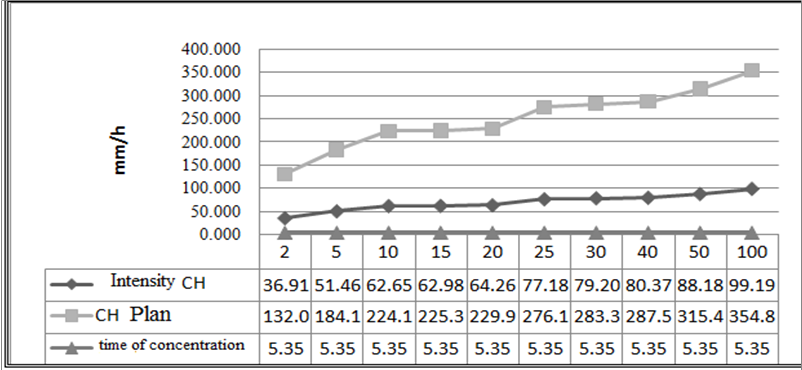 | Figure 2. Rainfall Intensity Curves |
The graph in Fig.2 explains the data received from the population calculations on the maximum rainfall observation stations Climatology Gumbell of Polonia Station. Concentration time relationship is increased rainfall resulting in more rainfall intensity.
3.3. Channel Hydraulics Analysis Results around DR. Mansyur at Medan Selayang
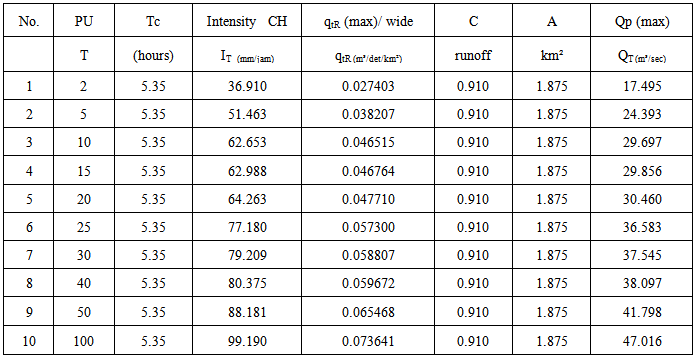
Flood discharge (Qp) based on the Rational method.QT = 0,2778 x (C.I.A)At the time of 2 period Q2 = 0,2778 (0,910 x 36,910 x 1,875) = 17,495 m3/sTable 1 explains the results of the Calculation of Statistics Flood Discharge (Qp).Table 1. Statistics Flood Discharge (Qp)
 |
| |
|
4. Conclusions
1. The study shows that for the area of 3,8 ha is found to be farthest distance of 200 meters with slope watershed of 0.00121 and intensity rainfall of 62.6 mm/hours for 10 years.2. The maximum rainfall plan on a return period of 100 years is 354.884 mm caused by high rainfall intensity with time of 5.35 hours.3. The peak flood discharge obtained in the catchment area of the drainage network system for a period of 100 year is 47,016 m3/sec. It is influenced by runoff factor of 0.910, which is caused by high intensity rainfall 99.190 mm/h.
References
| [1] | Jailani. 2005. Kajian Debit Banjir Sungai Way Laay Kecamatan Karya Penggawa Kabupaten Lampung Barat. Tesis Master, ITB. |
| [2] | Suripin, 2004, Sistem Drainase Perkotaan yang berkelanjutan, Penerbit Andi, Jakarta |
| [3] | Sri Harto, 1993. Analisis Hidrologi. Gramedia Pustaka Utama, Jakarta |
 Abstract
 Reference
 Full-Text PDF
 Full-text HTML