-
Paper Information
- Next Paper
- Previous Paper
- Paper Submission
-
Journal Information
- About This Journal
- Editorial Board
- Current Issue
- Archive
- Author Guidelines
- Contact Us
Journal of Civil Engineering Research
p-ISSN: 2163-2316 e-ISSN: 2163-2340
2014; 4(3A): 228-232
doi:10.5923/c.jce.201402.39
Climate Change Impact on Water Level in Peninsular Malaysia
 Abstract
 Reference
 Full-Text PDF
 Full-text HTML
Syaran Suri, Fauziah Ahmad, Ahmad Shukri Yahaya, Zul Azmi Mokhtar, Muhamad Hisyam Halim
School of Civil Engineering, Engineering Campus, Universiti Sains Malaysia, Penang, Malaysia
Correspondence to: Syaran Suri, School of Civil Engineering, Engineering Campus, Universiti Sains Malaysia, Penang, Malaysia.
| Email: |  |
Copyright © 2014 Scientific & Academic Publishing. All Rights Reserved.
Part of climate change impact can be seen in the changing of river flow and water level. The objective of this research is to determine the change in water level for north and south region of peninsular Malaysia. One set of data for each region; north region (Kedah), south region (Johor) were collected from the Department of Irrigation and Drainage Malaysia. The result indicates that the mean water level of the rivers during 30 years for both north and south regions have decreased. In the recent years decreasing trend of water level were obtained. This could lead to soil erosion problem.
Keywords: Climate change, Water level, River
Cite this paper: Syaran Suri, Fauziah Ahmad, Ahmad Shukri Yahaya, Zul Azmi Mokhtar, Muhamad Hisyam Halim, Climate Change Impact on Water Level in Peninsular Malaysia, Journal of Civil Engineering Research, Vol. 4 No. 3A, 2014, pp. 228-232. doi: 10.5923/c.jce.201402.39.
Article Outline
1. Introduction
1.1. Climate Change Effect on Malaysia
- There are some studies related to climate change impacts on Malaysia. Shaaban et al., (2006) stated that the whole Peninsular Malaysia will be warmer by about 2 degrees Celsius in the next 50 years if the simulated future climate in the Canadian CGCM1 study becomes true. According to Shaaban (2013) there are 3 main climatic parameters observed in Malaysia which are temperature, rainfall and sea level. Malaysian Meteorology Department (2013) stated that, generally, the overall correlation analysis of annual mean temperatures over the low land areas has the largest trend over Southern and Central Peninsula Malaysia while the lowest trend is in Sarawak. The rates of increase are about 1.5˚C to 2.7˚C per 100 years. In respond to water crisis in Malaysia, expert said Malaysia will face a water crisis by 2050 if conservation measures are not taken (NST, 2014).1-hour rain intensity in year 2000 to 2007 has significantly increase by 17% compared to 1970s values. For example in 2007, massive floods occurred in Batu Pahat, Johor Baru, Kluang, Kota Tinggi, Mersing, Muar, Segamat all are in Johor southern state of peninsular Malaysia. The massive floods bring losses about RM1.5 billion to Malaysia. Satellite alimentary data recorded rise in sea level about 4.3cm to 11.9cm from year 1993 to 2010 (Shaaban, 2013). Figure 1 shows an example of flooding happened in Malaysia that effected the water supply, the Flooding of Bukit. Pinang Treatment Plant, Kedah in 2010.
 | Figure 1. Flooding of Bt.Pinang Treatment Plant (Source: N. A. Z. Abidin, 2012) |
1.2. Climate Change on Water Level
- Studies related to trends in river flows during the 20th century have been studied frequently since the Third Assessment Report and some of these studies have detected significant trends in some indicators of river flow, and some have demonstrated statistically significant links with trends in temperature or precipitation; but no globally homogeneous trend has been reported (IPCC, 2007). Bates et al., (2008) stated that, generally, climatic warming is expected to start a drying trend in wetland ecosystems. This is the part of climate change effect, leading to the water level alterations, would be the main agent in wetland ecosystem change. Monsoonal areas are more likely to be affected by more intense rain events over shorter rainy seasons, worsen by flooding and erosion in catchments and the wetlands themselves. According to Doll and Zhang (2010) climate change is impacting freshwater ecosystems not only by changing temperature but also flow variability which can be described by characteristic like long term annual and monthly means, statistical low and high flow, daily to interanually variability and the timing of the flows. Two selected river sites in Kedah and Johor were chosen to represent north and south region in Peninsular Malaysia. The study was carried to observe the climate change effect on water level in these past 30 years. The aims of the study are to determine and compare the water level trends for both north and south regions.
2. Methodology
- Water level data was obtained from two inventory water level station recorded by Department of Irrigation and Drainage Malaysia. The first station is 1737451 at Sg. Ketil at Kuala Pegang, Kedah in the North region while the second station is 5604818 at Sg. Johor at Rantau Panjang, Johor in the South region. Department of Irrigation and Drainage Malaysia (1982) is using standard stick gauge for observing water level in a river stations. Generally if the river sstation equiped with stick gauge only, paid observer will read the water level at 6.00 a.m and 6.00 p.m daily. Where the river stations are equiped with automatic water level recorder complete with stick gauges, the water level are normally observed at regular intervals, such as weekly or monthly, to check the records registered on the recorder charts. To ensure the uniformity of stick gauge installation, a standard 2-metre length has adopted for generall aplication. For the observation, the observer must have access as close to the stick gauge as possible and cleared the debris on the stick gauge to avoid error in reading the water level. The observer should not read the stick gauge from a steep bank at the river stations to avoid parallex error. It is necessary to get the mean water level if there is surge around the stick gauge.The bottom of the stick gauge corresponding to the zero reduce level of any metre in all stages should be checked and adjusted to an accuracy of ± 1mm by levelling from the temporary bench mark or permenant bench mark estabalish at the river station. All stick gauge must be checked and maintain in a vertivcal position at all times. Figure 2 shows the Stick gauge at river station.
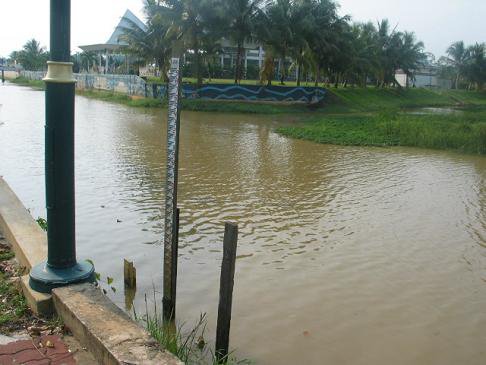 | Figure 2. Stick gauge at river station (Source: Department of Irrigation and Drainage Malaysia, 2014) |
 | Figure 3. Map of Peninsular Malaysia showing the location of Kedah and Johor (Source: Department of Irrigation and Drainage Malaysia, 2014) |
 | Figure 4(a). Map of Johor showing the station location (Source: Department of Irrigation and Drainage Malaysia, 2014) |
 | Figure 4(b). Map of Kedah showing the station location (Source: Department of Irrigation and Drainage Malaysia, 2014) |
3. Results and Discussions
- The descriptive statistic was used for analyses to obtain the typical value. The summary of the discriptive statistics for north and south regions are shown in the Table 1 below.
|

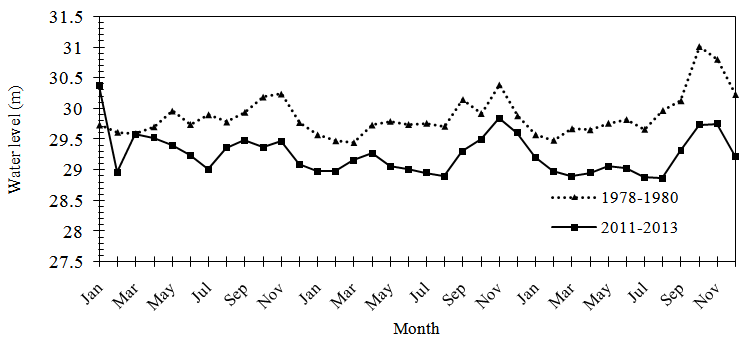 | Figure 5. Water level in North Region |
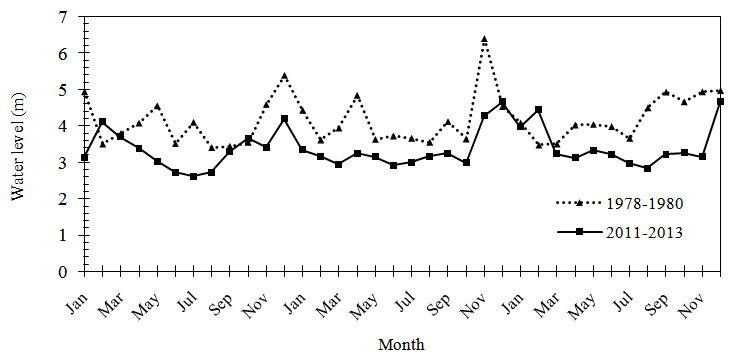 | Figure 6. Water level in South Region |
4. Conclusions
- Climate change has proven to effect the water level in the previous study [IPCC, 2007: Bates et al., 2008: Doll and Zhang 2010: Shaaban et al., 2006]. This study is to determine and compare the water level trend in the north and south region of Peninsula Malaysia based on data from 1978 to 1980 and 2011 to 2013. Descriptive statistics from the two stations show the mean water level for recent years were lower compared to the previous 30 years. The mean of water levels in north and south region are lower by 2.04% and 14.05% respectively. The maximum water table for north region was decrease from 31.02m to 30.37m while in the south region a decrease in maximum water level from 6.41m to 4.66m was recorded.Both water level trends for south and north region were affected by Monsoon regimes. The graphs for both regions showing a decreasing trend. Malaysian autorities should be aware on this trend to prevent future water crisis.
ACKNOWLEDGMENTS
- The author would like to thank the University Sains Malaysia for funding this research through the Research University Grant scheme Education Malaysia for ERGS grant scheme. The author also would like to acknowledge the Department of Irrigation and Drainage Malaysia for the data.