-
Paper Information
- Next Paper
- Previous Paper
- Paper Submission
-
Journal Information
- About This Journal
- Editorial Board
- Current Issue
- Archive
- Author Guidelines
- Contact Us
Journal of Civil Engineering Research
p-ISSN: 2163-2316 e-ISSN: 2163-2340
2014; 4(3A): 222-227
doi:10.5923/c.jce.201402.38
Trends for Daily Rainfall in Northern and Southern Region of Peninsular Malaysia
 Abstract
 Reference
 Full-Text PDF
 Full-text HTML
Zul Azmi Mohtar, Ahmad Shukri Yahaya, Fauziah Ahmad, Syaran Suri, Muhamad Hisyam Halim
School of Civil Engineering, Engineering Campus, Universiti Sains Malaysia, Penang, Malaysia
Correspondence to: Zul Azmi Mohtar, School of Civil Engineering, Engineering Campus, Universiti Sains Malaysia, Penang, Malaysia.
| Email: |  |
Copyright © 2014 Scientific & Academic Publishing. All Rights Reserved.
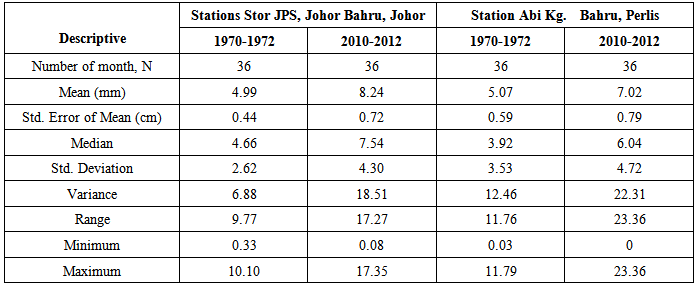
Modeling of daily rainfall data, particularly the rainfall amount, is increasingly important, not only for hydrological purposes, but also for providing input for models of crop growth, design of urban drainage systems, land management systems and other environmental projects. This paper assesses recent changes in extremes of the monthly mean rainfall distribution in Peninsular Malaysia based on two regions which is northern region (Perlis) and southern region (Johor Bahru) over the period 1970–1972 and 2010-2012. This research compare several years Descriptive statistics of the monthly rainfall amount for each rain gauge stations are summarized where the mean, standard deviation, standard error of mean, median, standard deviation, variance, range, minimum and maximum of rainfall were obtained. In this research, a comparison of the earlier year (1970-1972) and lastest year (2010-2012) show that 2010-2012 received heavy rain compared with 1970-1972 for both rain gauge stations. The highest amount of rainfall show that Station Abi Kg. Bahru, Perlis recorded 23.36 mm for 2010-2012. This trend of increasing mean rainfall can cause landslide and floods in Malaysia.
Keywords: Rainfall, Climate Change, Statistic Description
Cite this paper: Zul Azmi Mohtar, Ahmad Shukri Yahaya, Fauziah Ahmad, Syaran Suri, Muhamad Hisyam Halim, Trends for Daily Rainfall in Northern and Southern Region of Peninsular Malaysia, Journal of Civil Engineering Research, Vol. 4 No. 3A, 2014, pp. 222-227. doi: 10.5923/c.jce.201402.38.
Article Outline
1. Introduction
- Climate change has altered not only the overall magnitude of rainfall but also its seasonal distribution and interannual variability worldwide (Nicholson, 2000). Such changes in the rainfall regimes will be most keenly felt in arid and semiarid regions, where water availability and timing are key factors controlling biogeochemical cycles, primary productivity, and the phenology of growth and reproduction, while also regulating agricultural production (Feng, 2013). The climate plays such a major part in our planet's environmental system that even minor changes have impacts that are large and complex (Trenberth and Kevin, 1992). Global climate change will impose serious impacts on species and ecosystems worldwide during the 21st century. Extreme weather and climate events have received increased attention in the last few years, due to the often large loss of human life and exponentially increasing costs associated with them (Karl and Easterling 1999). In 1998 flooding and landslides due to Hurricane Mitch resulted in more than 10 000 deaths in Central America, and in 1995 economic losses on the U.S. mainland due to hurricanes averaged $5 billion (normalized to 1995 levels) per year (Pielke and Landsea 1998). This increased attention raises the question as to whether extreme weather and climate events are truly increasing, whether this is only a perceived increase exacerbated by enhanced media coverage, or both (Karl and Easterling 1999).Due to climate change, there will be many inter-related changes to the weather. There will be more droughts, heat waves, storms and floods. Vegetation system will also be changed. Changes in the amount and distribution of ice permafrost, snow, water and vegetation may modify the environment. The stability of natural slopes and the associated risk will be very much affected by climate. Past trend of temperature for land are show in figure 1.
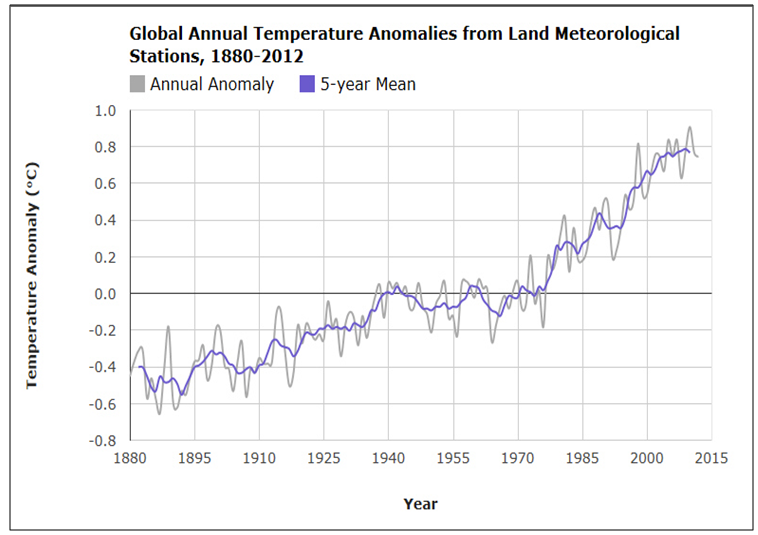 | Figure 1. Global Annual Temperature Anomalies from Land Meteorological Stations, 1880-2012 (Hansen et al., 2012) |
2. Methodology
- Monthly rainfall series data for this study have been obtained from Department of Irrigation and Drainage Malaysia for the period from 1970-1972 and 2010-2012. For this study, two rain gauge stations were chosen based on the region, which is one at the northern region and the other one at southern region of Peninsular Malaysia. The southern region is situated at Stor JPS at Johor Bahru, Johor and for the northern region is situated at Abi Kampung Bahru, Perlis. The state of Johor with an area of 19,984 km2 is situated at the southern end of Peninsular Malaysia. It was named after the Sungei Johor which is the largest river in the state. Because of its proximity to the equator and also maritime exposure, the state is blessed with a uniform temperature, pressure, high humidity and abundant rainfall all the year round. The average annual temperature is about 26 °C. The climate of the state is equatorial and the year can be divided into two main seasons, the northeast monsoon (December to March) and the southwest monsoon (June to September) separated by two relatively short intermonsoon periods. During the northeast monsoon season, northeast winds prevail with speed reaching 20 km/h Cloudy conditions in December and January with frequent afternoon showers, spells of widespread moderate to heavy rain can last for a duration of 1 to 3 days continuously. During the southwest monsoon, southwest winds tend to prevail.Perlis lies at the northwestern tip of the Peninsular Malaysia bounded by Thailand in the north, and by Kedah to the east and south. Its western coastline borders the Straits of Malacca. It measures approximately 810 km2 and has a population of 217,480. The state capital is Kangar while Arau, 10 km away, is the Royal town. The locations for these stations are on map in Figure 1 and 2.
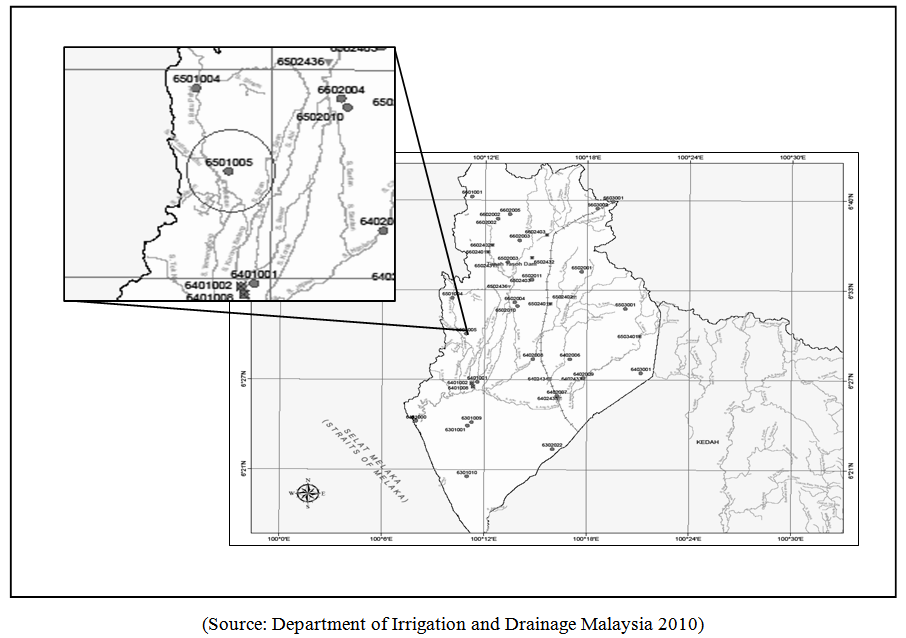 | Figure 2. Map of Perlis and station Abi Kampung Bahru |
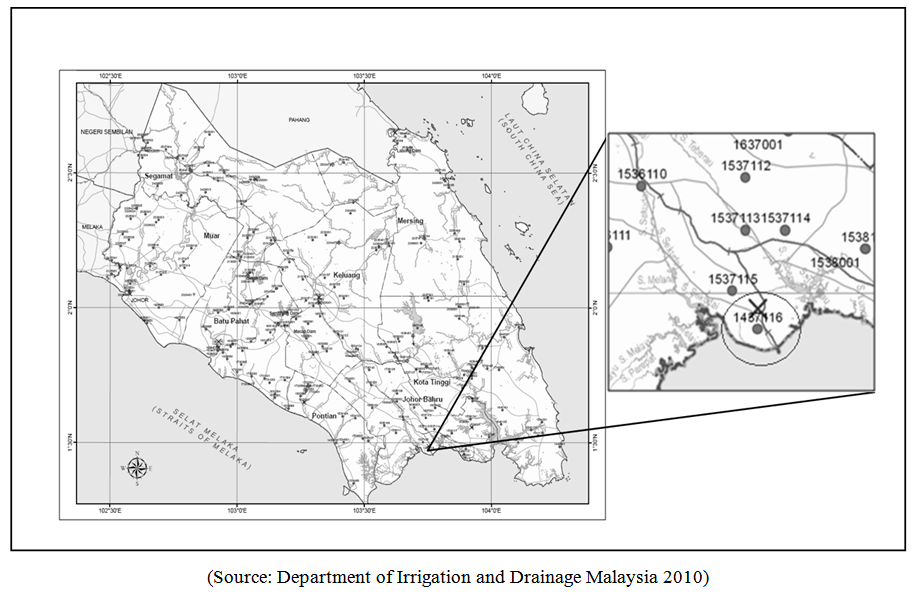 | Figure 3. Map of Johor and station Stor JPS Johor Bahru |
3. Result and Discussions
- Peninsular Malaysia is located between 1◦ and 7◦ north and 99◦ to 105◦ east, and comprises an area of 131587 km2. It is composed of highland, floodplain and coastal zones. The Titiwangsa mountain range forms the backbone of the Peninsular, from southern Thailand running approximately south-southeast over a distance of 480 km and separating the eastern part from the western part (Suhaila and Jemain, 2007). Surrounding the central high regions are the coastal lowlands. The weather of Peninsular Malaysia is warm and humid all year round with temperatures ranging from 21◦C to 32◦C, as is characteristic for a humid tropical climate. The precipitation climate is 20 characterized by two rainy seasons associated with the Southwest Monsoon from May to September and the Northeast Monsoon from November to March (Camerlengo and Demmler, 1997; Suhaila and Jemain, 2009). Substantial rainfall also occurs in the transitional periods (usually occur in April and October) between the monsoon seasons (Suhaila and Jemain, 2007). During the northeast monsoon season, the exposed areas like the east coast of Peninsular Malaysia, Western Sarawak and the northeast coast of Sabah experience heavy rain spells. On the other hand, inland areas or areas which are sheltered by mountain ranges are relatively free from its influence. It is best to describe the rainfall distribution of the country according to seasons.Rainfall events may begin or end at any time of the day. They can either occur for a few hours or extend into several days. There are three main types of rainfall: convectional rainfall, frontal or cyclonic rainfall and orographic rainfall. Convectional rainfall, associated with hot climates, mostly occurs in the tropics. It is brought about by rising and abrupt cooling of air that has been warmed by the extreme heat of the ground surface. If the air is hot enough, it rises very quickly and can cause thunderstorms. This type of rainfall is usually associated with rainfall on single wet days.From Figure 4, the mean monthly rainfall for 2010-2012 increased compared with 1970-1972. The highest amount of rainfall is on September 2012 (23.36 mm). The maximum rainfall occurred during the south west monsoon which is from June to September and transitional period from south west monsoon to north east monsoon from October to November. Perlis is located in the northern region of Peninsular Malaysia and during the north east and south west monsoon, Malaysia receives substantial amount of rainfall all year round. However, there is a distinct peak wet season during the north east monsoon.
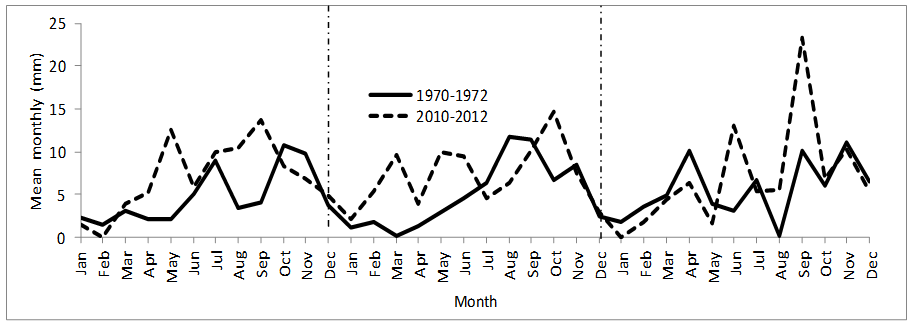 | Figure 4. Graph for station Abi Kampung Bahru, Perlis |
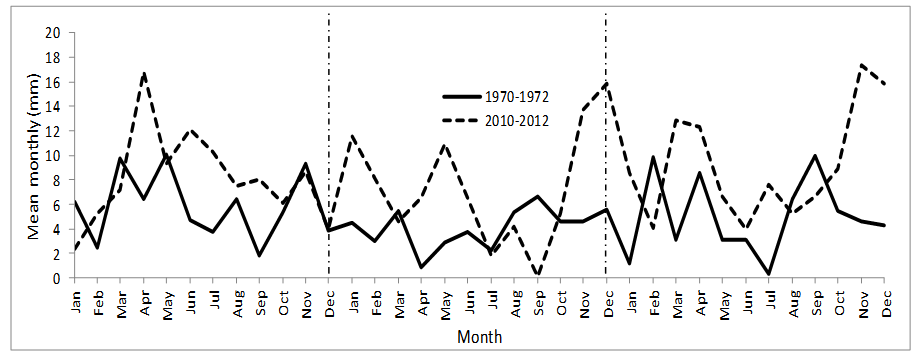 | Figure 5. Graph for station Stor JPS Johor Bahru, Johor |
|
4. Conclusions
- The research is to analyse the changes and comparing between the three years earlier (1970-1972) and the three latest years (2010-2012) for both stations (Abi Kg. Bahru, Perlis and Stor JPS, Johor Bahru, Johor) which represent the northern region and southern region of Peninsular Malaysia. The characteristics of rainfall are described and analyzed based on both stations and the descriptive statistics were calculated to determine the rainfall profile. It was found that the maximum rainfall (23.36 mm) is in station Abi Kg. Bahru for 2010-2012 and the lowest rainfall is in station Stor JPS, Johor Bahru for 1970-1972. For the maximum value, it shows the highest increment (49.53%) in rainfall is for Station Abi. Kg. Bahru and 41.7% for Station Stor JPS, Johor Bahru. For mean value, Station Stor JPS, Johor Bahru recorded an increase of 39.44% compared to Station Abi Kg. Bahru (27.78%). This can be concluded that the amounts of rainfall were increasing tremendously for both stations within 30 years.
ACKNOWLEDGEMENTS
- The authors would like to acknowledge the Universiti Sains Malaysia for funding this research through the Research University grant scheme, Education Malaysia for ERGS grant scheme and Department of Irrigation and Drainage Malaysia.