Wei Chek Moon, Kang Chin Tan, Tze Liang Lau
School of Civil Engineering, Universiti Sains Malaysia (USM), Penang, Malaysia
Correspondence to: Tze Liang Lau, School of Civil Engineering, Universiti Sains Malaysia (USM), Penang, Malaysia.
| Email: |  |
Copyright © 2014 Scientific & Academic Publishing. All Rights Reserved.
Abstract
In this study, wave forces of tsunami on simplified onshore buildings at Penang Island were investigated. Single-storey and double-storey buildings were downscaled at a ratio of 1:100 and subjected to tsunami bores of various runup heights in a 1 m x 1 m with 40 m long wave flume. Tsunami wave height and velocity at the location of building model were obtained. The experimental results revealed that the nature of wave attack on building model depends on the relationship between model height and nominal height of the wave. The time histories of forces in the horizontal and vertical direction and pressures on buildings due to simulated tsunami-like waves were measured. The relationships among the forces and pressures for the incident wave with nominal wave height around 40 mm were discussed in detail. It is observed that the maximum horizontal force and front pressure were attained when nominal height of the wave was achieved by the flow. The experimental results provide useful information for the dynamic analysis in the later stage of the study.
Keywords:
Tsunami, Wave force, Wave pressure, Penang island
Cite this paper: Wei Chek Moon, Kang Chin Tan, Tze Liang Lau, An Experimental Study on Wave Forces of Tsunami on Simplified Onshore Buildings at Penang Island, Malaysia, Journal of Civil Engineering Research, Vol. 4 No. 3A, 2014, pp. 164-172. doi: 10.5923/c.jce.201402.29.
1. Introduction
Recently, tsunami has been making scenes around the world. The development of design guidelines for tsunami resistant is boon for the worldwide researchers. The 2004 Indian Ocean Tsunami is perhaps the most devastating tsunami in the recorded history. The affected areas include the countries across the entire Indian Ocean such as Indonesia, Sri Lanka, Thailand, India and Malaysia [1]. Another more recent tsunami, the 2011 Tohoku Tsunami had affected almost all the northeast coast of Japan with a death toll of 20,000 [2]. Tsunami in Japanese is known as harbor wave. Tsunami is an oceanic gravity wave associated with the coastal geological processes such as earthquakes, landslides or volcanic eruptions. With up to 52 out of 68 total deaths in Malaysia, Penang Island was the most severely affected state in Malaysia during the devastating event of 2004 Indian Ocean Tsunami [1]. As the coastal areas of the state have been developed rapidly over the years, it is foreseen that even more lives will be claimed and more properties will be damaged should the next tsunami hit us. According to Nordin and Charleson [3], Malaysian coastal dwellings may be under threat from tsunami in the future. To date, a comprehensive study of tsunami runup and proper design of tsunami-resistant structure in Penang Island is yet to be formulated due to the lack of knowledge on tsunami impact topics. At the high hazard areas, tsunami runup mechanism which includes wave breaking action and high-velocity water scouring can result in high overturning moment onto the buildings and cause serious structural damage [4]. The tsunami behaviours and characteristics are quite distinct from other coastal hazards and cannot be inferred from common knowledge or intuition [5]. Therefore, the investigation of tsunami runup characteristic is extremely vital in the context of tsunami disaster management and mitigation plans. In many scenarios of tsunami incomings, evacuation which frees people to impact-resistant building or higher ground is executed. However, the option can only work if and only if the evacuation center itself can withstand probable tsunami impact from structural failure. Incorrect estimation on the tsunami-induced forces on buildings could result in structural failure and thus endanger the life of escapees and evacuees. Therefore, the understanding on tsunami forces is vital in the proper design of tsunami-resistant structure [6]. The main objective of the study is to study the characteristics of tsunami wave and its impact onto the simplified onshore buildings (total building height of 3.6 m and 6.6 m) each subjected to wave heights of 4 m at Penang Island, Malaysia.
2. Background
Since the past few decades, the experimental studies of wave pressures and forces on building structures had been investigated by Asakura et al. [7], Lukkunaprasit et al. [8], Yeh [6] and Fujima et al. [9]. Several formulas have been proposed to evaluate the tsunami wave loadings on structures. Asakura et al. [7] proposed empirical formulas for the tsunami wave pressure with and without soliton break up based on tests of tsunami wave flowing over perpendicular revetments. As for Ohmori et al. [10], he proposes equation for the tsunami wave forces based on the hydrodynamic, inertia, impulsive, and hydraulic gradient forces while the formulation of hydrodynamic force (resistance force) has been studied by Arnason and his co-researchers [11]. He also proposes the empirical relationship of impulsive force to the hydrodynamic force. In Japan, Okada et al. [12] provides an outline or the design of buildings for tsunami resistance. Besides, research on the development of design guidelines for tsunami resistance have also been conducted include the American Society of Civil Engineers (ASCE 7) [13], Federal Emergency Management Agency (FEMA P646) [5], City and County of Honolulu Building Code [14] and Japan Cabinet Office guidelines [15]. Tsunami waves on buildings have been studied and explored widely by other countries such as Japan and United States. However, Malaysia's design of coastal buildings in accordance to relevant standards and codes still halts at the infant stage due to the lack of knowledge on tsunami impact topics. Besides, the runup mechanisms and impact forces of tsunamis depend largely on the ocean bathymetry, topography, hydrology, and geology of the coast [16]. The prediction of tsunami behaviour and its impacts onto the shore of Penang Island using the established model of another shore is both improper and impractical. Therefore, this study focuses on one common coastal profile in Penang Island in order to study the tsunami characteristics in Penang Island.
3. Methodology
3.1. Data Collection
In the study, the experiment simulated tsunami with nominal wave height of 4 m represented the maximum runup height of 2004 Indian Ocean Tsunami at Penang Island which was measured by Koh et al. [17] during their post tsunami surveys in 2005. Bathymetry of Greater Indian Ocean was evaluated from the Gridded Bathymetric Data Sets of General Bathymetric Chart of the Oceans (GEBCO). By using GEBCO Digital Atlas (GDA) Software Interface, digitised bathymetric data expressed in the form of coordinates and heights was exported into ASCII text format. Exported grid data was processed by Surfer11, a GIS mapping software to construct bathymetric contours and coastlines by using Kriging or Gaussian process regression method. In order to evaluate the bathymetric plane slope profile, slice normal to the shoreline was made on the bathymetry contour (Fig. 1). The derived bathymetric profile which represented the slope of chosen shore was then used for the establishment of flume's platform in this study. Fig. 2 shows the slope profile of NW3’ - NW3 made on Penang Island’s bathymetry contour.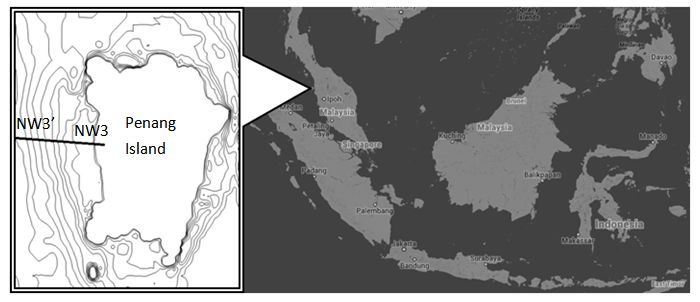 | Figure 1. Profile slice normal to the shore of Penang Island |
3.2. Laboratory Setup of Wave Flume
Physical modelling was downscaled to 1:100 based on Froude Number Similitude Law. Fig. 3 illustrates the schematic diagrams of the laboratory setup. The laboratory setup consisted of a 40 m long, 1 m wide and 1 m deep wave flume for experimental studies on tsunami topics. The flume's platform represented the bathymetric profile of Penang shore as shown in Fig. 2. The side walls of the flume are made from concrete (Fig. 4). The flume was comprised of a compound bed with continuous plane slope of 1:200 and 1:125. The bed of the shore was assumed to be rigid and without friction. The compound bed ended with a horizontal flat plane where the downscaled building model subjected to tsunami loading was located. Single-storey and double-storey onshore buildings were simplified and simulated as rigid rectangular block models with 100 mm x 100 mm base which were constructed from acrylic plates as shown in Fig. 5. In the experiment, tsunami runup was simulated while the tsunami drawdown was not considered in the study.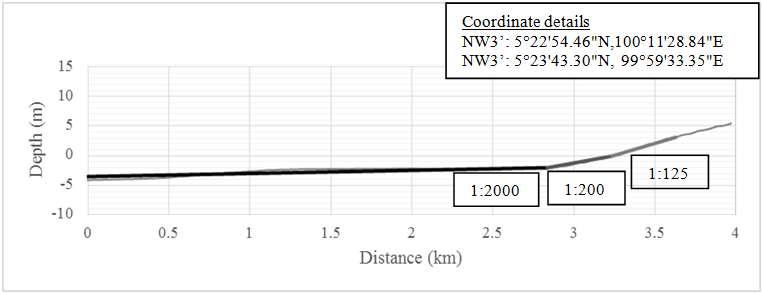 | Figure 2. Slope profile of NW3’ – NW3 |
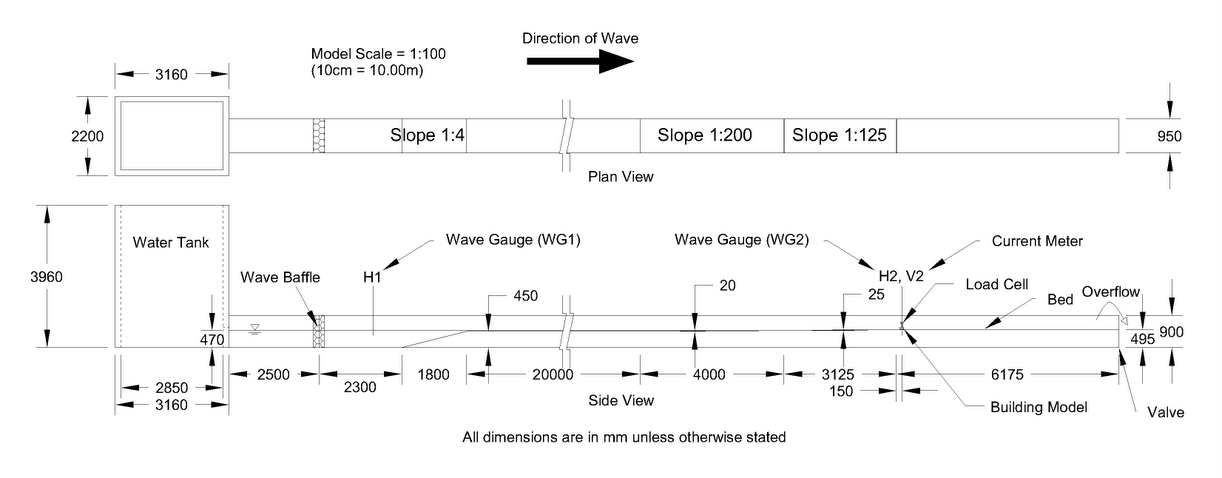 | Figure 3. Schematic diagrams of the laboratory setup |
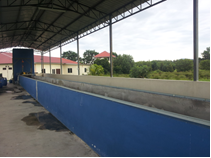 | Figure 4. Wave flume |
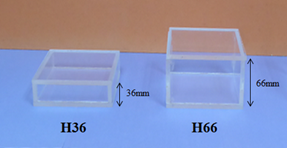 | Figure 5. Simplified onshore building models |
Long period solitary wave was generated by sudden releasing of mass water built up in a water tank located at the furthest left end of the flume. By varying the released volume from the tank, different wave forms and wave forces were produced. In the experiment, water height of 0.58 m in the tank was used to generate the wave with nominal wave height of 40 mm at the location of building model. Upon released, water flowing through the wave baffle was regulated and eventually broke into bores and surges after travelling past the slope of 1:4. The broken wave which consisted of bores and surges then propagated across all remaining wave flume sections. The travelled broken wave then attacked the building model which was located at the flume’s horizontal bed. Fig. 6 shows the development of wave bores travelling towards the location of building model after the process of wave breaking on the solitary wave passing the 1:4 slope section.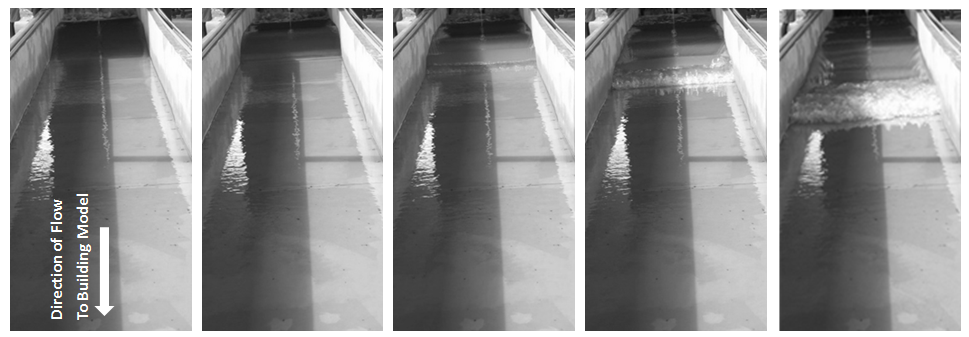 | Figure 6. Wave breaking sequence of simulated tsunami wave |
3.3. Physical Modeling
The wave height, velocity, force and pressure are the physical quantities that were measured during the experiment. Fig. 7 shows the schematic diagram of the instrumentation and data acquisition system used in the experiment. Wave profiles at H1 and H2 as shown in Fig. 3 were obtained by using the capacitance type wave gauges. Electromagnetic type current meter was used to record the velocity of wave in the flume for various wave heights. As for the wave forces (in the horizontal and vertical directions) and pressures, these physical quantities were measured by a calibrated high frequency three-axis load cell and the diaphragm type pressure gauges. The wave gauge was connected to the main unit, then together with the load cell and pressure gauges were connected to the data logger where the measured data were collected and stored. As for the current meter, it was connected directly to the computer through the main unit for the purpose of data acquisition and processing. The data were then converted into physical quantities using the calibration constants for each instrument. Besides, digital camera and video recorder were used to capture the motion of wave acting on the building model.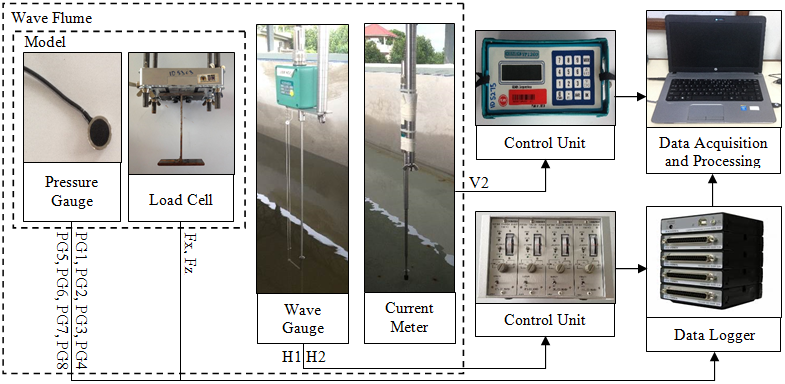 | Figure 7. Schematic diagram of the instrumentation and data acquisition system |
During the experiment, the free flow condition of the wave without any model was first studied. Wave gauge and current meter were installed at same location of the model to measure the wave height and flow velocity respectively. At the same instance, wave height of upstream flow at location H1 was recorded in order to obtain the correlation between the magnitude of wave heights and velocity at these locations. After the completion of the free flow simulation, building model with the total height of 36 mm (H36) or 66 mm (H66) which had been mounted onto an I-section with a load cell was installed on the flume and subjected to tsunami attacks (Fig. 8). The building model was located at a horizontal distance of 3.225 m and vertical height of 25 mm from the shoreline. At this moment, wave gauge and current meter at the location of model were not installed to avoid the instruments' interference to the flow characteristics of tsunami wave near the building model. The time histories of wave forces and pressure acted on the building model were then obtained. The arrangement and positions of pressure gauges attached on the models are shown in Fig. 9. There are total eight pressure gauges used in the experiment. The front face of the model was defined as the face facing the incoming wave and hit directly by the wave. 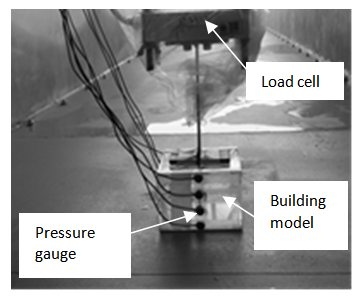 | Figure 8. Building model instrumented with load cell and pressure gauges |
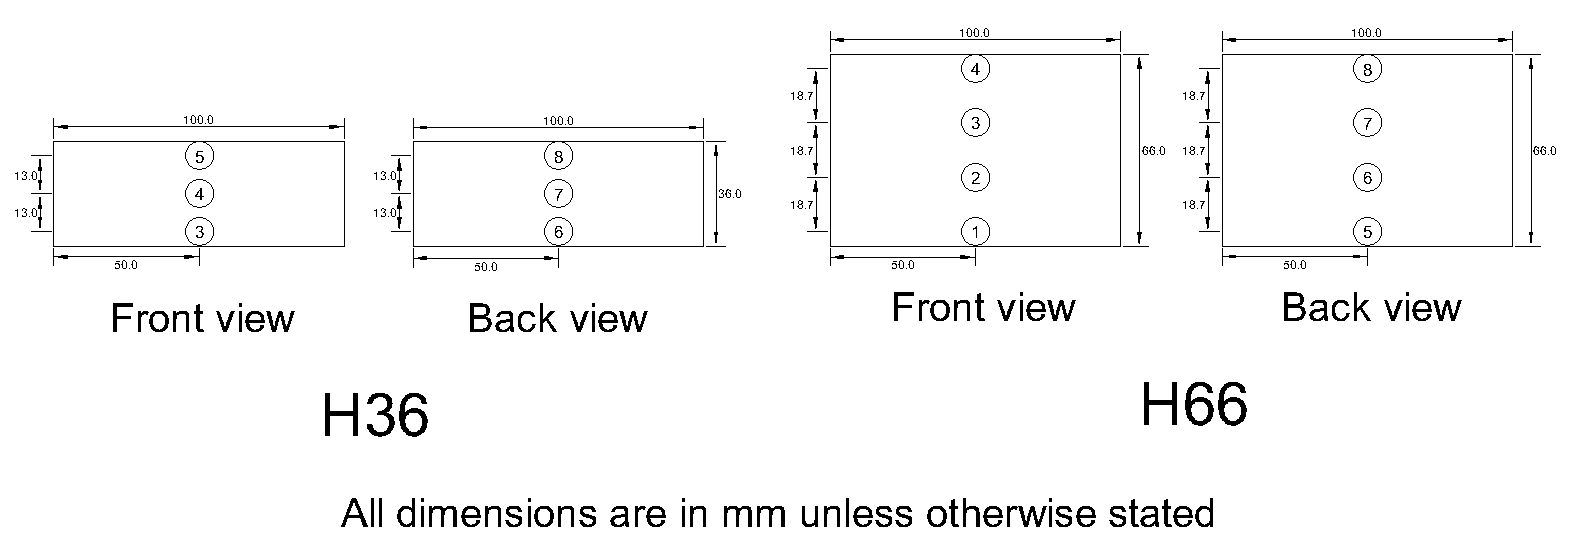 | Figure 9. Position of pressure gauges on building models |
4. Results and Discussion
4.1. Wave Height and Wave Velocity at Building Model
Time histories of wave height and wave velocity at the location of building model were recorded during free flow condition (without the presence of model) for incident wave with nominal height around 40 mm (Fig. 10). The time t = 0 s denotes the time when the wave first hit the building model. Based on the experimental results, it is observed that the incident wave with nominal height (h) of 40 mm attains its maximum wave height at the time of approximately 3 seconds after the wave first reach the location of building model. As shown in Fig. 10, the maximum wave height only occurs after around 2.5 s when the wave has achieved its maximum peak velocity of approximately 1.30 m/s. Therefore, the maximum wave height does not occur at the same time instance with peak velocity flow. As the wave height increases overtime, the velocity of the corresponding wave decreases gradually.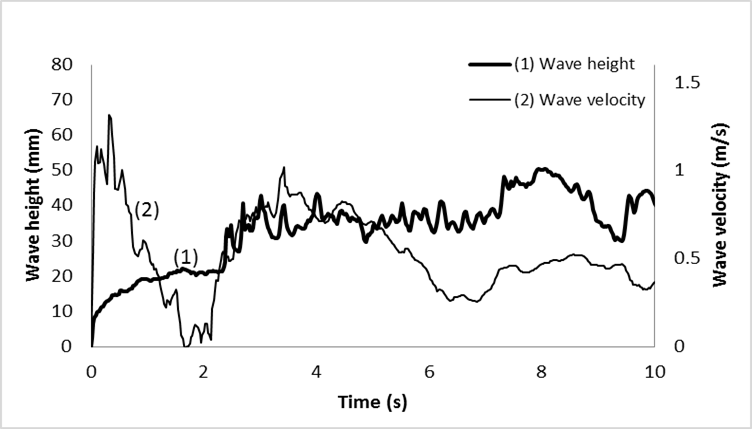 | Figure 10. Wave height and wave velocity time histories at building model |
Video observation shows that the nature of the wave attack on building model depends largely on the relationship between model height and nominal wave height. Fig. 11 shows the height of the H36 building model itself is smaller than the nominal wave height of 40 mm. At the initial impingement of the wave, wave with high velocity first strikes the model with a relatively small wave height. As the leading edge of the wave strikes the H36 building model, part of the wave splashes up due to the obstruction of building model and falls freely on top of the building model which lead to massive wave impact. The remaining wave then splits and spreads to the sideway. At around 3 s, the model is gushed over by the incoming flowing wave with nominal wave height of 40 mm and submerged completely underwater until the wave passed after a considerable amount of time. The wave is said to overtop the H36 building model. Such sequential wave attack is similarly observed for the H66 building model with height adequately greater than the wave nominal height, except where only minimal or no amount of water was found splashing down on the top surface of building model after the splashed up wave collapsed downward (Fig. 12). After that, the H66 building model is partially submerged as the incoming flowing wave gushes over the building model. Therefore, the nature of the wave attack on building model is regardless of the wave height in this study, but mainly affected by the height of the building model.
4.2. Wave Force and Pressure on Building Model
The recorded force time histories for the incident wave with nominal wave height around 40 mm are displayed in Fig. 13 (a) and Fig. 14 (a). The maximum horizontal force (Fx) occurs during a time frame when nominal height of the wave is achieved by the flow. The force then decreases gradually until 0 when the wave heights at both front and back faces of building model are equal. Based on the experimental results, H66 model has higher horizontal resultant force as compared to H36 model. The wave induced force is mainly dependent on the surface contact between the wave and the surface of the building model. As for the vertical force (Fz), it increases slightly with time. As comparing with H66 model, H36 model has slightly lower vertical resultant force. In fact, vertical forces experienced by the building model during tsunami event consist of both uplift and additional gravitational forces. This is evident for the case of H36 model as shown in Fig. 11, where the waves overtop the building model, thus contributing a certain amount of additional gravitational force acting downward on the building model and eventually reducing the uplift force.Fig. 13 (b) and Fig. 14 (b) show the recorded pressure time histories for the incident wave with nominal wave height around 40 mm. The pressures shown in Fig. 13 (b) and Fig. 14 (b) are normalized by the hydrostatic pressure (ρgh), where ρ is the density of water, g is the gravitational acceleration and h is the nominal wave height. The front pressures exhibit almost a similar trend with horizontal force. After reaching the peak, the pressures then decrease gradually but remain at the hydrostatic pressure for a much longer period subsequently. Besides, it can be observed that the maximum horizontal force occurs almost at the same time instance with the occurrence of peak pressures recorded by the front pressure gauges. The front peak pressures on H36 and H66 building models are approximately 1.7 and 2 times the hydrostatic pressure respectively. On the other hand, the wave pressures at back face of the building models pick up slightly later than the front pressure. This is due to the fact that there is time when no water can be observed at the back face of building model as the wave first hit the building models. The back pressures then increase gradually until they reach up to the hydrostatic pressure. Based on the results, the front and back pressures at the bottom of the building model achieve similar pressure which is about the hydrostatic pressure when the wave heights at front and back faces of building model are the same.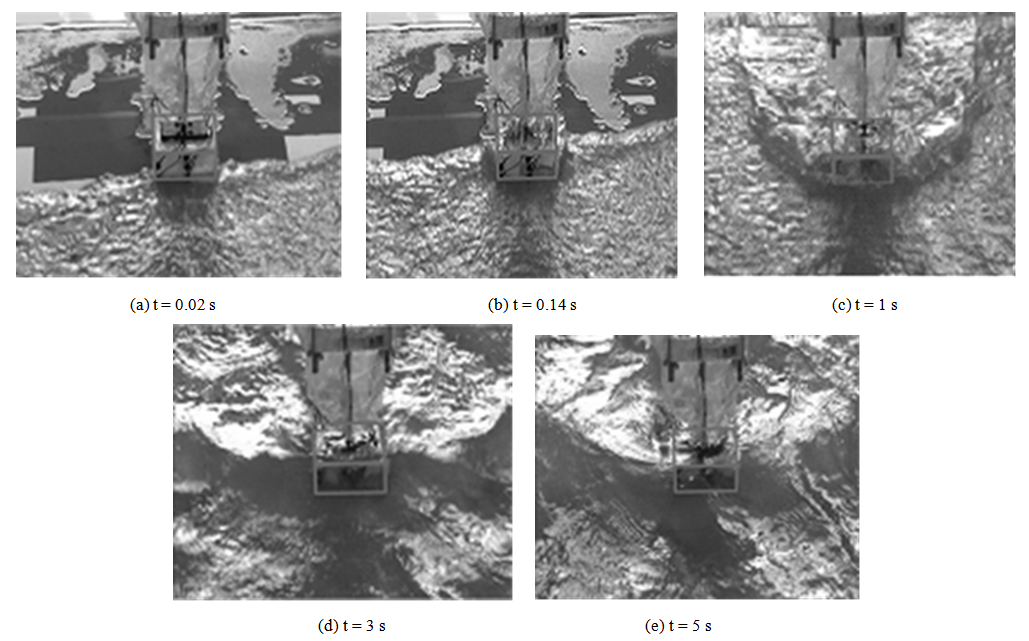 | Figure 11. Sequence of wave attack on H36 building model (h = 40 mm) |
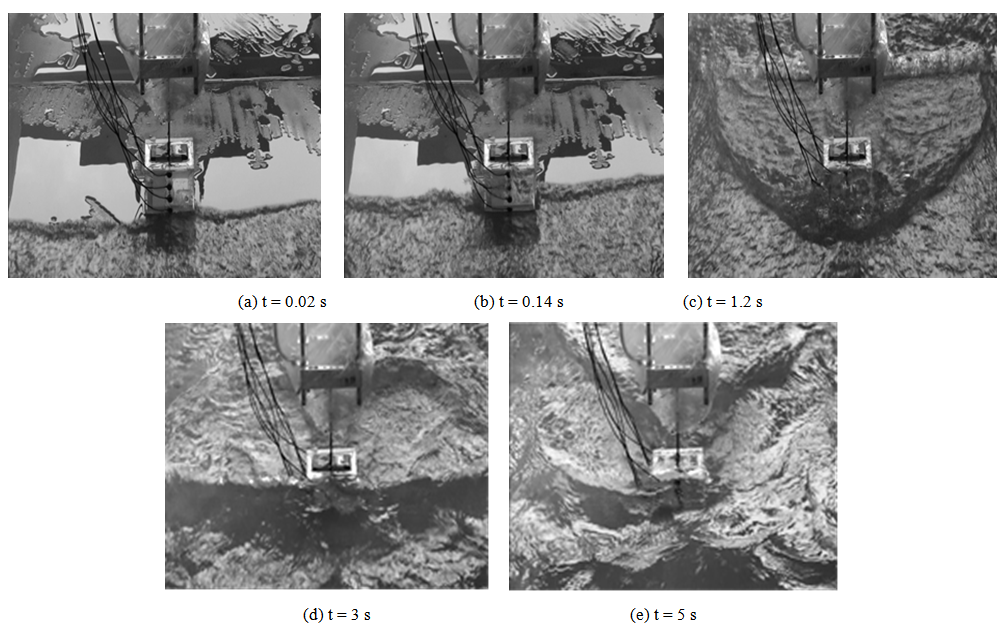 | Figure 12. Sequence of wave attack on H66 building model (h = 40 mm) |
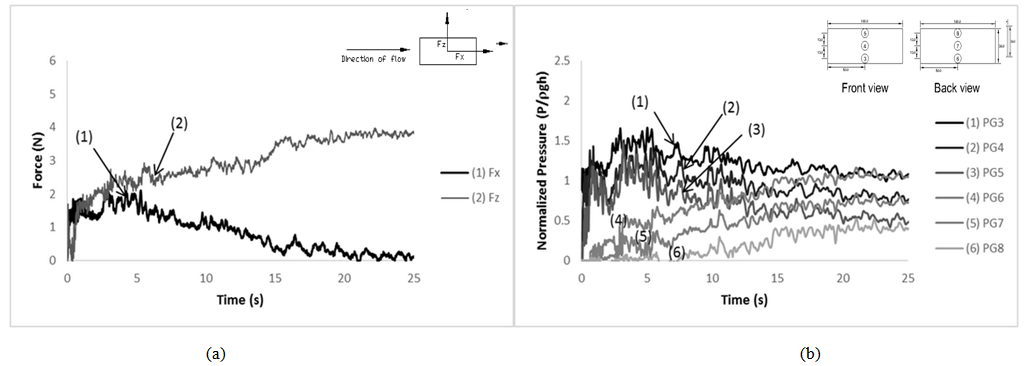 | Figure 13. Time histories of (a) wave forces and (b) wave pressures on H36 building model |
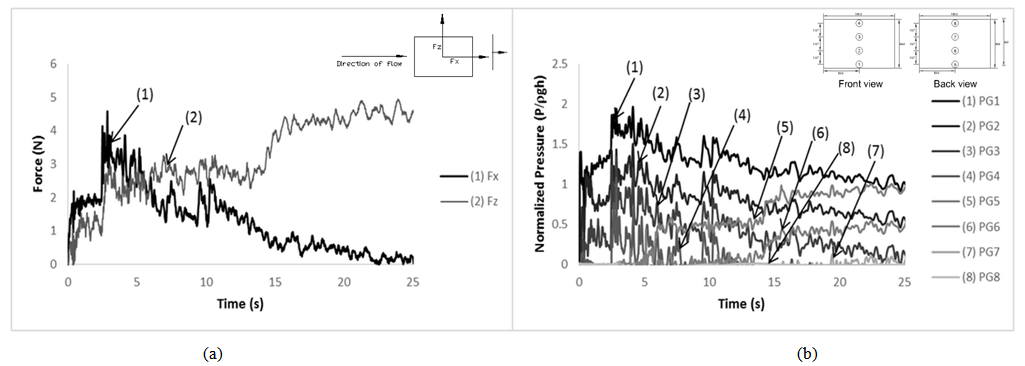 | Figure 14. Time histories of (a) wave forces and (b) wave pressures on H66 building model |
Fig. 15 and Fig. 16 present the vertical distribution of pressure for the front and back faces of the both building models (H36 and H66) for the incident wave with nominal wave height around 40 mm. It is noted that the elevation of the pressure gauge from the ground (z) will affect the value of the pressure obtained. Based on the plots in Fig. 15 and Fig. 16, the wave pressure forms a rather equivalent triangular distribution with the greatest pressure at the base of building models. The pressures at the higher location of the models show lower or minimum readings. As the wave first hit the building models, hydrostatic pressure distribution seems to be dominant at the front face of the building models. As the wave height increase over time, the pressures increase gradually. At the time of around 3 s, pressures mainly consist of hydrodynamic pressures as the pressures reach their peak values (Fig. 15 (a) and Fig. 16 (a)). At the back face of the building models, hydrostatic pressure distribution which is depth dependent is dominant as the peak pressure is almost equal to hydrostatic pressure.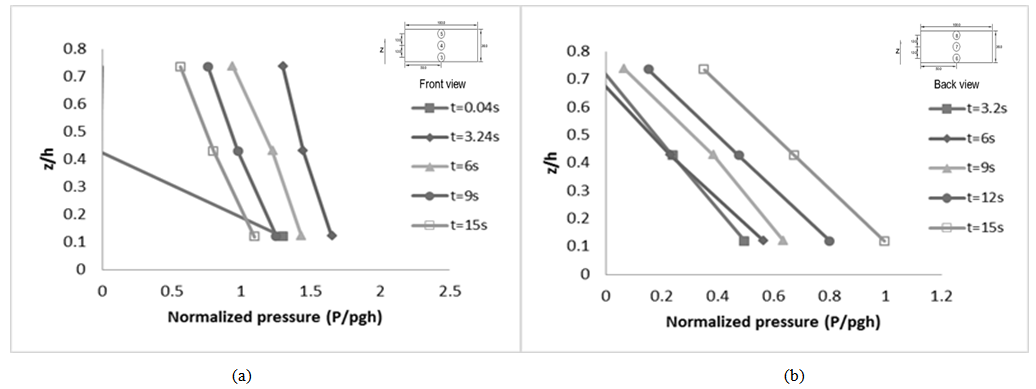 | Figure 15. Vertical distribution of pressure at the (a) front face and (b) back face of H36 building model |
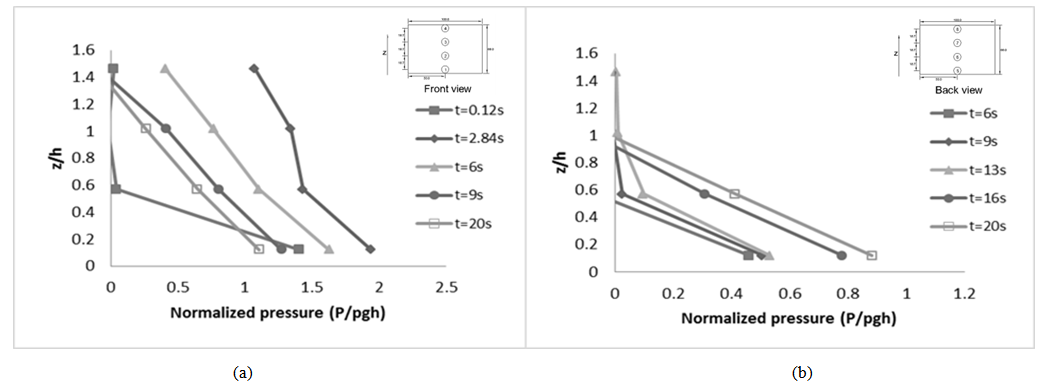 | Figure 16. Vertical distribution of pressure at the (a) front face and (b) back face of H66 building model |
5. Conclusions
The experiment has significantly achieved the main objective of the study. Tsunami modeling and its impact onto the simplified onshore buildings (total building height of 3.6 m and 6.6 m) were successfully carried out. The forces and pressures acted on the H36 and H66 building models are obtained from the experimental studies. These experimental results provide useful information for the dynamic analysis in the later stage of the study that will contribute towards the design of tsunami-resistant buildings in Penang Island, Malaysia.
ACKNOWLEDGEMENTS
The authors would like to express their gratitude to the Ministry of Science, Technology and Innovation (MOSTI), Malaysia for funding this study through Science Fund Research Grant (04-01-05-SF0562) and JICA Project for AUN/SEED-Net through Collaborative Research for Alumni (CRA) 2013. Special appreciation also goes to Mr. Chiew Lerk Qing, Mr. Cheong Kah Win, Mr. Tee Yi Cong and Mr. Chun Jan Bong for their contributions in conducting physical experiment.
References
| [1] | I. Komoo, and M. Othman. The 26.12.04 tsunami disaster in Malaysia: an environmental, socio-economic and community well-being impact study. Institut Alam Sekitar dan Pembangunan (LESTARI), Malaysia, 2006. |
| [2] | E. Lekkas, E. Andreadakis, V. Alexoudi, E. Kapourani and I. Kostaki. The Mw=9.0 Tohoku Japan earthquake (March 11, 2011) tsunami impact on structures and infrastructure. Environmental Geosciences and Engineering Survey for Territory Protection and Population Safety (EngeoPro) International conference, Moscow. 2011, pp. 97-103. |
| [3] | J. Nordin, and A. W. Charleson. Tsunami responsive architecture: reducing vulnerability of houses and other structures along the northwestern coast of Malaysia. Proceeding of 4th Annual International Workshop & Expo on Sumatra Tsunami Disaster & Recovery, Banda Aceh. 2009, pp. 20-24. |
| [4] | J. D. Ramsden. Forces on a vertical wall due to long waves, bores, and dry-bed surges. Journal of Waterway, Port, Coastal and Ocean Engineering. 1996, 122 (3): 134-141. |
| [5] | FEMA P646. Guidelines for design of structures for vertical evacuation from tsunamis. Federal Emergency Management Agency, Washington, D.C., 2008. |
| [6] | H. Yeh. Design tsunami forces for onshore structures. Journal of Disaster Research. 2007, 2 (6): 531-536. |
| [7] | R. Asakura, K. Iwase, T. Ikeya, M. Takao, T. Kaneto, N. Fujii, and M. Ohmori. The tsunami wave force acting on land structures. International Proceeding of the 28th International Conference on Coastal Engineering, Cardiff, Wales. 2002, pp. 1501-1507. |
| [8] | P. Lukkunaprasit, A. Ruangrassamee, and N. Thanasisathit. Tsunami loading on buildings with openings. Science of Tsunami Hazards. 2009, 28 (5): 303-310. |
| [9] | K. Fujima, F. Achmad, Y. Shigihara, and N. Mizutani. Estimation of tsunami force acting on regular structures. Journal of Disaster Research. 2009, 4 (6): 404-409. |
| [10] | M. Ohmori, N. Fujii, and O. Kyotani. The numerical computation of the water level, the flow velocity and the wave force of the tsunami which overflow the perpendicular revetments. Proceedings of the Coastal Engineerings of JSCE. 2000, pp. 376–380. |
| [11] | H. Arnason, C. Petroff, and H. Yeh. Tsunami Bore Impingement onto a Vertical Column. Journal of Disaster Research. 2009, 4 (6): 391-403. |
| [12] | T. Okada, T. Sugano, T. Ishikawa, T. Ohgi, S. Takai, and C. Hamabe. Structural design method of buildings for tsunami resistance (proposed). Building Technology Research Institute, Building Centre for Japan, 2005. |
| [13] | G. Chock. ASCE 7 and the development of a tsunami building code for the U.S. http://www.nehrp.gov/pdf/UJNR_2013_ASCE7.pdf, 2013. |
| [14] | The City and County of Honolulu Building Code (CCH). Chapter 16, Article 11, Department of Planning and Permitting of Honolulu, Hawaii, 2000. |
| [15] | Japan Cabinet Office, Government of Japan. Guidelines for tsunami evacuation buildings (in Japanese). http://www.bousai.go.jp/oshirase/h17/tsunami_hinan.html, 2005. |
| [16] | F. W. Colbourne. Tsunami impact on the west coast of Penang Island, Malaysia. Research Project Report, MS in Physical Sciences, Emporia State University, Emporia, Kansas, USA, 2005. |
| [17] | H. L. Koh, S. Y. Teh, P. L. F. Liu, A. I. M. Ismail, and H.L. Lee. Simulation of Andaman 2004 tsunami for assessing impact on Malaysia. Journal of Asian Earth Sciences. 2009, 36 (1): 74-83. |
 Abstract
 Reference
 Full-Text PDF
 Full-text HTML