Koktong Tan1, Hashim Abdul Razak1, Meldi Suhatril1, Dagang Lu2
1Department of Civil Engineering, University of Malaya, Kuala Lumpur, Malaysia
2School of Civil Engineering, Harbin Institute of Technology, 202 Haihe Road, Nangang District, Harbin, China
Correspondence to: Hashim Abdul Razak, Department of Civil Engineering, University of Malaya, Kuala Lumpur, Malaysia.
| Email: |  |
Copyright © 2014 Scientific & Academic Publishing. All Rights Reserved.
Abstract
This paper develops analytical fragility curves for a RC concrete frame building under ground shaking. A three story RC frame building was selected as a study case. The system was analyzed and compared for two different site soil conditions subject to a relatively small number of strong ground motion records. Nonlinear time history analyses were conducted using OpenSees [1] platform. The maximum inter story drift ratio for the building was compared to slight, moderate, extensive and complete limit states, as suggested by HAZUS [2]. The numerical result shows that the local soil conditions can significantly modify the fragility curves.
Keywords:
Fragility curves, Site response analysis, RC frame buildings
Cite this paper: Koktong Tan, Hashim Abdul Razak, Meldi Suhatril, Dagang Lu, Fragility Curves of a RC Frame Building Subjected to Seismic Ground Motions, Journal of Civil Engineering Research, Vol. 4 No. 3A, 2014, pp. 159-163. doi: 10.5923/c.jce.201402.28.
1. Introduction
Fragility curves are a useful tool for seismic risk analysis of structural systems. They relate the probability of reaching or exceeding a damage state to a given seismic hazard intensity. Different approaches can be used to develop the fragility curves, including empirical, judgmental, analytical and hybrid methods [3]. Analytical Fragility curves are based on damage distributions simulated from analyses of structural models under increasing earthquake loads as their statistical basis. The analytical approaches are the most popular since they are applicable to different structural types and geographical regions where damage records are insufficient. The objective of the current study is to develop analytical fragility curves for a RC frame building under peak horizontal ground acceleration (PHGA) at the ‘seismic bedrock’. The effect of soil conditions underneath is investigated. Two different soil conditions are considered corresponding to soil profile type C and D of NEHRP with Vs30 varying from 280m/s to 373m/s.
2. RC Frame Building
A three-story RC frame building is used for the fragility analysis. It is symmetrical and simple, ideally used for the purposes of the current study. The story height is 4m and the bay width is 26m. The total building height is 12m. The building was designed for gravity loads without seismically detailed. The compressive strength of concrete and the yield strength of steel are equal to 30MPa and 460MPa, respectively. The elevation of sample frame and alongside the details are shown in Fig. 1.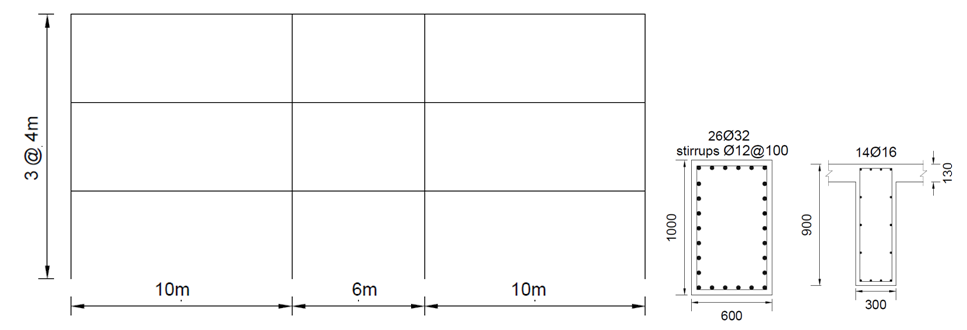 | Figure 1. Elevation of sample frame and reinforcement details |
3. Ground Motion Inputs
Equivalent linear ground response analyses are conducted to evaluate the soil surface ground motions. Two different soil conditions are considered, corresponding to soil profile type C and D of NEHRP with vs30 varying from 280m/s to 373ms (Fig. 2). In the first case, the soil profile consists of a surface 2.5m thick silt layer overlaying sand layers and the water table is located 2.5m below the ground surface. In the second case, the soil profile constitutes mainly of medium plasticity clay layers with a 4.5m thick sand layer at a depth of 13.5m below the ground surface. Water table is 6m below the surface. The fundamental elastic periods of the soil profiles are approximately 0.29 for soil profile type C and 0.36 for soil profile type D.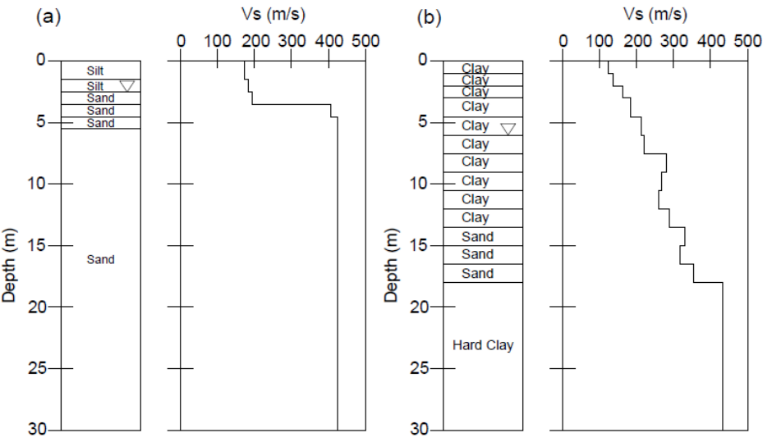 | Figure 2. Soil stratigraphy and shear wave velocity profile for soil profile type C (a) and D (b) |
One-dimensional equivalent linear ground response analyses are performed using SHAKE91 [4], assuming vertical propagation of seismic waves and horizontal soil layering. The variations of modulus reduction G/Gmax and damping ratio D with shear strain γ are defined according to the typical results in the scientific literature. In particular, the confining-pressure dependent curves of Darendeli [5] are used in the current study (Fig. 3). For the seismic bedrock, the curves proposed by Schnabel, Lysmer [6] are employed. Each soil profile is discretized into a number of layers ranging from 0.5 to 1.5m thick. The ratio of effective and maximum shear strain is assumed equal to 0.65 and the critical damping is taken as 5%. 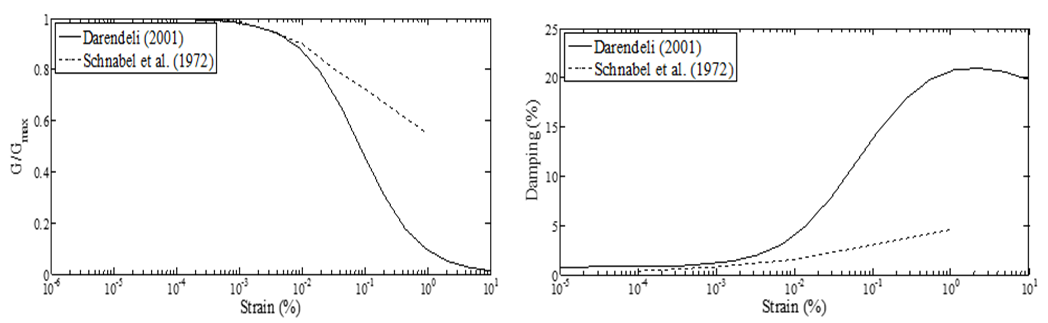 | Figure 3. Variations of shear modulus reduction (G/Gmax) and damping ratio (D) with shear strain (γ) of the soil models |
Five different earthquake records are selected as input motion in outcrop conditions for the one-dimensional ground response analyses: (1) Chi-chi, Taiwan, Mw=6.76 and Rrup=114.4km, 1999; (2) Off the coast of northern California, USA, Mw=7.10 and Rrup=132.9km, 2005; (3) Duzce, Turkey, Mw=7.10 and Rrup=183.5km, 1999; (4) Landers, California USA, Mw=7.30 and Rrup=121.1km, 1992; (5) India-Burma border, Mw=7.21 and Rrup=353.0km, 1988. No specific soil amplification factors are applied since this is explicitly taken into account through the numerical analysis. The records are selected to cover the inherent uncertainties related to the seismic motions, e.g. seismotectonic environment, amplitude, frequency content and significant duration. The hazard-consistent ground motions are generated using enhanced RspMatch [7] program. Enhanced RspMatch modifies a given record to render it compatible with a given spectrum while preserving the nonstationary character of the ground motion. An acceleration ‘target’ spectra representative of scenario corresponding to probability of 2% of being exceeded in 50 year equivalently, return period of 2475 year, is selected for the spectrum matching of the selected ground motions. The spectrum-matched time histories are scaled from PHGA of 0.05-3.5g at 0.05g interval in order to evaluate the soil surface ground motion for increasing levels of seismic intensity and to construct the corresponding fragility curves. The spectrum compatible acceleration time histories and alongside the target and matched spectra are shown in Fig. 4. A sample of the computed ground response in terms of maximum acceleration amax, peak shear strain γmax, normalized shear stiffness G/Gmax and damping ratio D is shown in Fig. 5.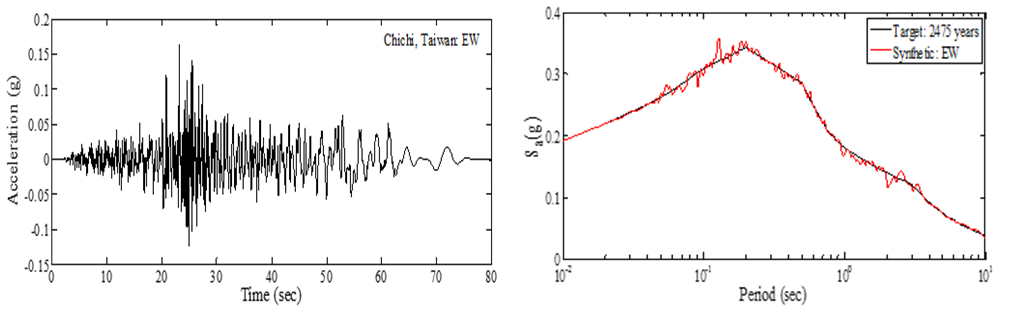 | Figure 4. Spectrum-matched ground motions |
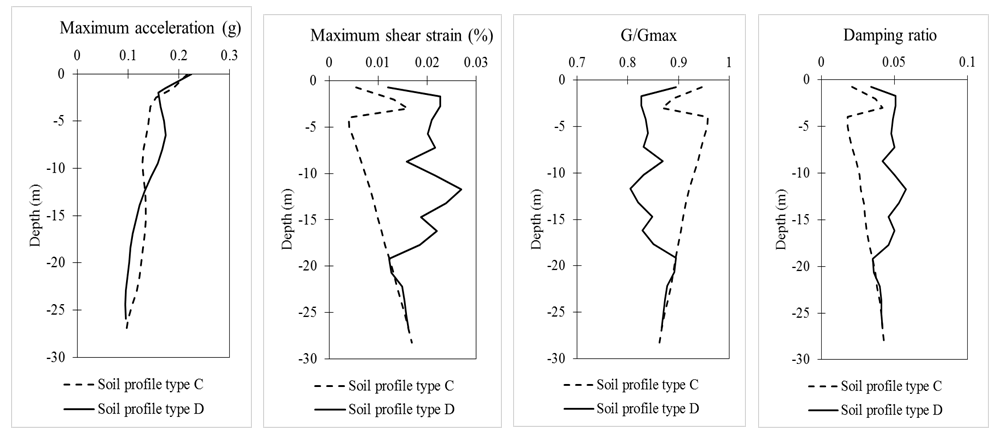 | Figure 5. Variation of maximum acceleration (amax), normalized shear modulus (G/Gmax), peak shear strain (γmax) and damping ratio (D) with depth for the input motion Chichi scaled at 0.2g |
4. Damage State Definition
Four different structural performance levels are considered in the current study, corresponding to slight damage, moderate damage, extensive damage and complete damage. They are described in terms of maximum inter-story drift ratio and cover the whole range of structural damage from serviceability to life safety, and finally to the onset of collapse. The threshold values of the maximum drift ratio corresponding to the damage states described in Table 1 are adopted and the fragility curves are developed accordingly. Table 1. Definition of damage states for the three story RC frame building [2]
 |
| |
|
5. Finite Element Model
A 3D finite-element model of the structure was generated using the OpenSees [1]. Beam and columns were modeled with nonlinear beam-column elements characterized by fiber sections, which enforce the Bernoulli beam assumption. All elements are based on the non-iterative force formulation, considering the spread of plasticity along the elements. The concrete was modeled using a uniaxial Kent-Scott-Park model [8] with degrading, linear, unloading/reloading stiffness according to the work of [9] without tensile strength. This model allows an accurate estimation of the structural demand for flexure-dominated RC members despite of its relatively simple formulation [10, 11]. The reinforcement steel is modeled with a uniaxial Giuffre-Menegotto-Pinto [12] model. This model has a sufficient accuracy of satisfying the experimental tests, and taking into account the Bauschinger effect [13]. The rigid floor diaphragm is defined using the DOF coupling feature of Opensees. The column bases are fixed while shear deformation and bond-slip of reinforcement were neglected in the current study. The effects of gravity loads and second-order effects are considered through the geometric nonlinearities. Nonlinear dynamic time history analyses were performed to evaluate the structural response of the building subject to the previously computed soil surface ground motions.
6. Fragility Curves Development
According to the previously defined limit states, the fragility curve for the damage state (di, i=slight, moderate, extensive and complete) is the conditional probability that the building has a state of damage exceeding the damage state di at a specific level of peak horizontal ground acceleration (PHGA) at the ‘seismic bedrock’, which is express as: 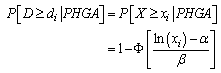 | (1) |
 | (2) |
 | (3) |
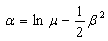
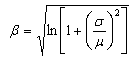
where Φ(·) is the standard normal cumulative distribution function, xi is the drift limit for each damage state, α and β as given in Eqs. (2) and (3) are dependent on the PHGA level, μ and σ are the mean and standard deviation of seismic demand values in each PHGA level, respectively. By this way, the fragility curves can be generated by plotting the input ground motion level represented in terms of PHGA and the probability of exceeding the damage states. As common practice, the fragility curves are also fitted to the lognormal cumulative distribution functions: 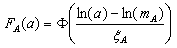 | (4) |
where A is the random variable of the PHGA, mA is the median of A, and ξA is the logarithmic standard deviation of A. Linear regression analysis was used to estimate the lognormal parameters of the fragility relationships.
7. Effect of Soil Conditions on the Fragility Parameters
Fig. 6 compares the fragility curves between the soil profile type C and D for the three-story RC frame building. It is observed that the fragility curves of the building in soil type D are higher than those in soil type C. For example, for a PHGA level of 1.05g, the fragility curve in soil type D estimates approximately 97% chance of extensive damage, while the fragility curve in soil type C estimates around 9% probability of the extensive damage. The differences increase for higher damage limit states. Therefore, the local soil conditions should be appropriately considered in the fragility analysis of RC frame buildings. 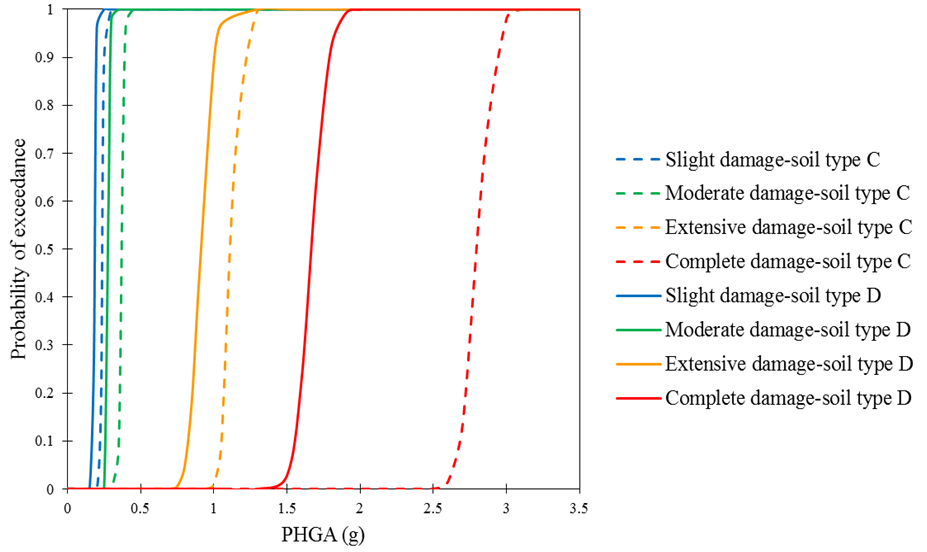 | Figure 6. Fragility curves for a three story RC frame building on soil profile type C and D |
8. Conclusions
In the current study, fragility curves of a three-story RC frame building are derived for two different soil conditions, classified as C and D of NEHRP. The effect of local soil conditions are the main focus of the study. The local soil conditions have a significant effect on fragility curves. Therefore, they should be considered in the fragility analysis for a building stock in a region.
ACKNOWLEDGMENTS
The works developed in this paper were supported by University of Malaya and the Ministry of Higher Education (MOHE), Malaysia through research grants PV081/2011A and UM.C/625/1/HIR/MOHE/ENG/55. These supports are gratefully acknowledged.
References
| [1] | Mazzoni, S., et al., Open Sees command language manual – version 2.0. 2007, University of California: Berkeley. |
| [2] | HAZUS, Earthquake loss estimation methodology, in Technical Manual. 1997, National Institute of Building for the Federal Emergency Management Agency: Washington, D.C. |
| [3] | Rossetto, T. and A. Elnashai, Derivation of vulnerability functions for European-type RC structures based on observational data. Engineering Structures, 2003. 25: pp. 1241-1263. |
| [4] | Idriss, I.M. and J.I. Sun, SHAKE91: a computer program for conducting equivalent linear seismic response analyses of horizontally layered soil deposits. 1992, University of California: Davis, California. |
| [5] | Darendeli, M.B., Development of a new family of normalized modulus reduction and material damping curves. 2001, The University of Texas at Austing: Ann Arbor. |
| [6] | Schnabel, P.B., J. Lysmer, and H.B. Seed, SHAKE: a computer program for earthquake response analysis of horizontally layered sites, in Report no. EERC72-12. 1972, University of California: Berkeley. |
| [7] | Atik, L.A. and N. Abrahamson, An Improved Method for Nonstationary Spectral Matching. Earthquake Spectra, 2010. 26(3): pp. 601-617. |
| [8] | Kent, D.C. and R. Park, Flexural members with confined concrete. Journal of the Structural Division, 1971. 97: pp. 1969-1990. |
| [9] | Karsan, I.D. and J.O. Jirsa, Behavior of concrete under compressive loading. Journal of Structural Division ASCE, 1969. 95(ST12). |
| [10] | Mitropoulou, C.C. and M. Papadrakakis, Developing fragility curves based on neural network IDA predictions. Engineering Structures, 2011. 33(12): pp. 3409-3421. |
| [11] | Lagaros, N.D. and M. Papadrakakis, Neural network based prediction schemes of the non-linear seismic response of 3D buildings. Advances in Engineering Software, 2012. 44(1): pp. 92-115. |
| [12] | Menegotto, M. and P.E. Pinto. Method of analysis for cyclically loaded reinforced concrete plane frames including changes in geometry and non-elastic behavior of elements under combined normal force and bending. in IABSE symposium on resistance and ultimate deformability of structures acted on by well defined repeated loads. 1973. Lisbon. |
| [13] | Li, Z. and G.D. Hatzigeorgiou, Seismic damage analysis of RC structures using fiber beam-column elements. Soil Dynamics and Earthquake Engineering, 2012. 32(1): pp. 103-110. |
 Abstract
 Reference
 Full-Text PDF
 Full-text HTML