Awang Taib1, Mohd Zulham Affandi Mohd Zahid1, Ade Faisal2, Saffuan Wan Ahmad3
1Department of Civil Engineering Technology, Faculty of Engineering Technology, Universiti Malaysia Perlis, Perlis, Malaysia
2Program Studi Teknik Sipil, Universitas Muhammadiyah Sumatera Utara, Medan, Indonesia
3Faculty of Civil Engineering, Universiti Teknologi Malaysia, Johor, Malaysia
Correspondence to: Mohd Zulham Affandi Mohd Zahid, Department of Civil Engineering Technology, Faculty of Engineering Technology, Universiti Malaysia Perlis, Perlis, Malaysia.
| Email: |  |
Copyright © 2014 Scientific & Academic Publishing. All Rights Reserved.
Abstract
In past decades, most of the studies in earthquake engineering concentrated on the effect of horizontal ground motion on the civil engineering structures. With the increase of near field ground motion records and field evidence of significant effect of vertical ground motion on the damaged civil engineering structure, the vertical earthquake has attract the earthquake engineering community to assess the safety of existing structures under its excitation. Furthermore, the analytical assessment to support the field evidence is very limited. The aims of this study are to evaluate the effect of vertical ground motions to the irregular reinforced concrete frames with setback. The frame models are subjected to ten horizontal and vertical ground motions with various peak ground acceleration ratios between horizontal and vertical ground accelerations (V/H) ranging from 0.3 to 1.9. The structural response quantities are expressed in term of variation of axial load. It is found that the variations of axial load are significant in interior columns as well as exterior columns that may endanger the shear capacity of the reinforced concrete buildings.
Keywords:
Vertical earthquake, Axial load, Reinforced concrete buildings
Cite this paper: Awang Taib, Mohd Zulham Affandi Mohd Zahid, Ade Faisal, Saffuan Wan Ahmad, Axial Load Variations of Irregular RC frames with Setback under Vertical Earthquakes, Journal of Civil Engineering Research, Vol. 4 No. 3A, 2014, pp. 138-144. doi: 10.5923/c.jce.201402.24.
1. Introduction
In general, civil engineering structures are subjected to earthquake ground motion in three directions, i.e. two horizontal and one vertical. In the past few decades, most of the research focuses on the horizontal ground motion and very limited study dealt with vertical ground motions. This is due to the belief that the existing structures are already strong vertically. According to Kim and Elnashai [1] many codes suggest of scaling the horizontal ground motion to 2/3 in order to obtain spectral shape for vertical component. This method was proposed by Newmark et al [2] and widely used. Besides that, Eurocode 8 [3] suggests that the peak ground acceleration ratio between horizontal and vertical ground accelerations (V/H) is equal to 0.9 for spectral shape type 1 and 0.45 for spectral shape type 2. However, from 200 records downloaded from Pacific Earthquake Engineering Research (PEER) Next Generation Attenution (NGA) project database [4], shown in Figure 1, it indicated that there are many ground motions that have V/H ratio more than 1 and the highest V/H ratio is 1.9, meaning that the peak ground acceleration of vertical ground motions almost double its horizontal components. These ground motion records with source distance less than 20 km. Before this, Kim and Elnashai [1] also collected and analyzed 452 earthquake records from PEER-NGA [4] database with source distance less than 50 km, large earthquake magnitude with Mw equal and more than 6.0 and peak ground acceleration of 0.1g or more and found that V/H ratios for most cases were within 2.0 and several cases exceed 2.5. This shows that, the assumption of V/H ratio of 2/3 used in most of the codes can seriously underestimate action on structures located near earthquake sources and overestimates action in far field regions. 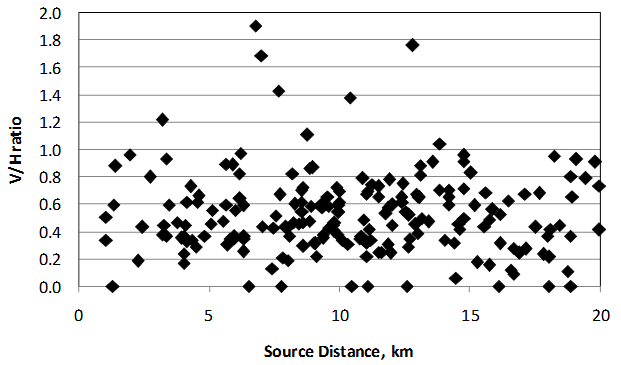 | Figure 1. Distribution of V/H ratio to source distance |
There were many field evidences reported the effect of vertical earthquake components cannot be taken for granted in seismic assessment and design of civil structures, for instance; [5], [6] and among others. Several studies were published regarding on the effect of vertical earthquake on reinforced concrete structures. Significant increase in axial force variation on reinforced concrete columns due to vertical earthquake was reported, undermining the column’s shear capacity [7]. The vertical components of earthquake also found to cause significant amplification in moment demands in girders at both the midspan at at the surface of the bent caps of bridge structures [8]. These studies suggest that seismic design of RC structures without considering the vertical earthquake component may cause the structure to collapse. However, there were a few numerical simulation carried out by researchers to underpin the above mentioned field evidence. Di Sarno et al [6] assess the performance of RC columns and a plane two storey-two bay RC frames subjected to only vertical ground motions recorded during the 2009 L’Aquila earthquake. The highest V/H ratio was 1.164 and PGAs were 0.659g and 0.522g in horizontal and vertical direction, respectively. Before that, Kim and Elnashai [1] who also evaluate the effect of vertical ground motion on the regular and irregular with transfer beam RC buildings considered 7 ground motions with the highest V/H is equal to 0.99 and the greatest PGAs were 1.13g and 0.84g for horizontal and vertical components, respectively. Therefore this study attempts to investigate the variation of axial load in the columns of irregular buildings with setback under vertical ground motion with a higher V/H ratio compare to previous study, which is from 0.3 up to near 2.0.
2. Ground Motions and RC Frame Models
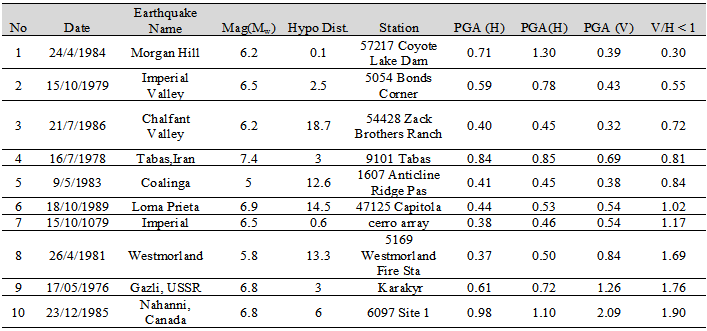
This study employs 10 natural earthquake records downloaded from PEER-NGA Database [4] and listed in Table 1. The ratio of peak ground acceleration of vertical to horizontal earthquake (V/H) is frequently used by researchers in order to represent the consequence of vertical ground motions. Newmark et. al. [2] suggested scaling down the horizontal spectral shape by factor of 2/3 to obtain spectral shape for vertical components and this procedure is widely used. However, many previous studies ([1]; [6] and among others) have proved that the 2/3 scaling down is not conservative for near field ground motions (d < 30 km) and over conservative for far field ground motions (d > 30 km). The use of this procedure may results in badly underestimate the actions on the buildings in near field area and absolutely the building is not safe for occupants. Meanwhile, in low seismicity area it will highly over estimate the actions on the building and eventually wasting the money. Furthermore, Eurocode 8 [3] suggests using factor of 0.9 for high and moderate seismicity area (Ms > 5.5) and factor of 0.45 for low seismicity area (Ms < 5.5). However, Kim and Elnashai [6] observed that there were many cases where the V/H ratio for near field region are around 2 and there were also several cases where V/H ratio more than 2.5. Therefore, since V/H ratio as a main characteristic employed to evaluate the effect of vertical earthquake component, this study considers ground motions records with wide range of V/H ratio which is from 0.3 as the lowest ratio to 1.9 as the highest V/H ratio. According to Eurocode 8 [3] if the peak ground acceleration of vertical earthquake component is exceeding 0.25g at any particular area the vertical component of ground motion should be take into account in the design process for five cases of structural systems, therefore, in this study all the selected ground motions are strong earthquake (Mw > 5) with minimum PGA of 0.4g and 0.32g in horizontal and vertical direction, respectively. The hypocentral distance of all earthquakes are less than 20 km in order to consider only near field ground motions as the effect of vertical earthquake components in far field regions (> 30 km) is not significant [4].Table 1. List of ground motions
 |
| |
|
This study employed 8-storey RC frames with setback as shown in Figure 3. Frame IS1 was designed for gravity load only and Frame IS2 was designed to resist horizontal earthquake with PGA equals to 0.2g and soil class B according to Eurocode 8 [3]. The detail information on the design of these frames can be found in Hartzigeogiou and Lilios’s [9]. As we can see, the cross sectional area of structural members for both models is identical, i.e. 350mm x 350mm for columns and 300mm x 500mm for beams. In terms of steel reinforcements, frame IS2 has 65% and 27% more steel reinforcement area, As, compared to IS1 model for columns and beams, respectively. This shows that the IS2 model is more ductile than the IS1 model and makes it satisfactory to resist earthquake in near field regions. This study employed a single component model which was developed with inelasticity along the member was lumped at both end of each member. In order to simulate the cyclic behaviour of reinforced concrete building, this study used modified-Takeda hysteresis curve as proposed by Zarein and Krawinkler [10]. Figure 2 shows the modified-Takeda hysteresis curve and its associated backbone curve employed in this study. There are five parameters to be determined in the modified-Takeda hysteresis curve and its associated backbone curve, namely: Flexural strength (My), Post yield hardening stiffness (My/Mc), Yield rotation (Өy), Plastic rotation capacity (Өp) and Post-capping rotation capacity (Өpc).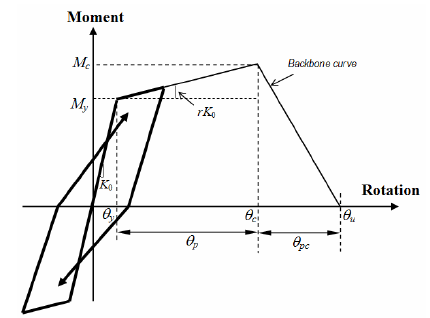 | Figure 2. Modified-Takeda hysteresis and backbone curve [8] |
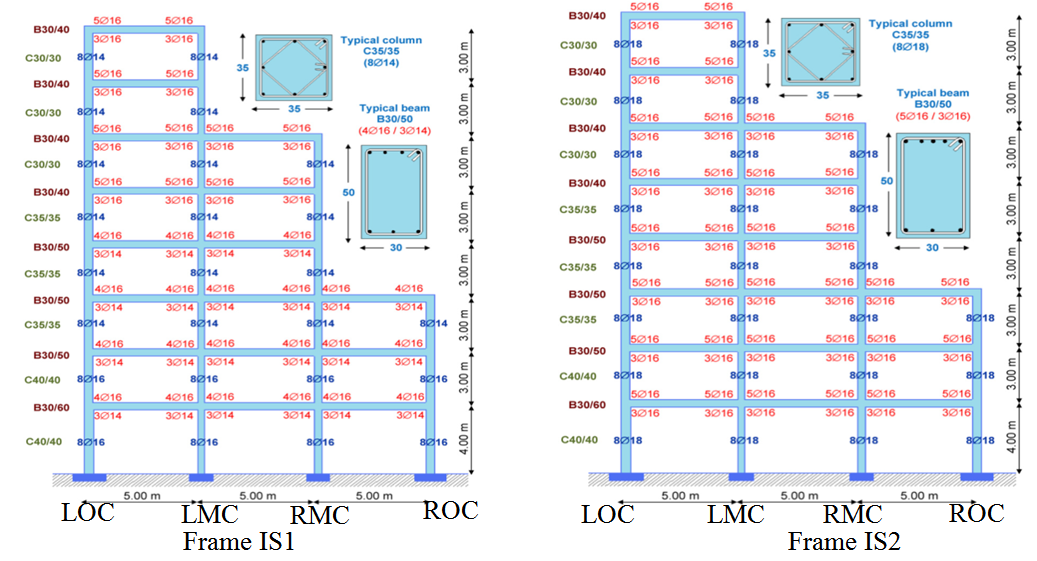 | Figure 3. Irregular frames with setback [7] |
The My is defined following Medina and Krawinkler [11] method in which the maximum moment resulted from the linear elastic static lateral method is assigned as the My at the hinges location. FEMA-P695 [12] recommends a constant value of 1.13 for Mc/My, hence, for this study this value was used for hardening stiffness. For the yield rotation, Figure 2 shows that it can be determined by the ratio of My to the elastic rotation stiffness (Ko = 6EI/L). Furthermore, FEMA P-695 [12] which is based on recent work by Haselton et al. [13] suggested the range of rotation capacities is between 0.015 to 0.082 and 0.015 to 0.100 for Өp and Өpc , respectively. The above ranges of rotation capacities were calculated using equation (1) and equation (2) and the key parameters considered in computing the above range of plastic rotation capacity (Өp) and post-capping rotation capacity (Өpc) are indicator variable (0 or 1) to signify possibility of longitudinal rebar slip past the column end, asl = 1 if slip is possible (defined by Fardis and Biskinis, [14]; Panagiotakos and Fardis, [15]), v = axial load ratio (P/Agf’c), ρsh = area ratio of transverse reinforcement, in region of close spacing at column end (Ash/sb), f’c = compressive strength of unconfined concrete, based on standard cylinder test (MPa), Failure classification – 0 for flexural failure, 1 for flexural-shear failure (as defined by Berry et al, [16]), Sn = rebar buckling coefficient and ρ = ratio of total area of longitudinal reinforcement.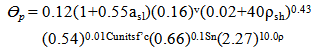 | (1) |
 | (2) |
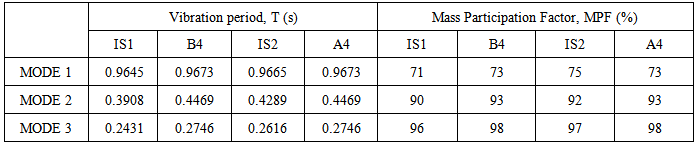
Zarein and Krawinkler [10] used rotation capacities within the above ranges in their study to investigate the behaviour of RC buildings. Hence, this study employed their rotation capacities which is Өp = 0.04 and Өpc = 0.06. Furthermore, modal analysis and nonlinear time history analysis have been carried to compare the dynamic characteristic and interstorey drift ratio (IDR) of these frame models. In Hartzigeogious and Lilios’ study [9], the 8 storey irregular gravity and earthquake designed frames with setback were designated as B4 and A4, respectively. Table 2 shows the dynamic characteristic of the frame models and the one from Hartzigeogious and Lilios’ study [9]. In terms of vibration periods, it shows that the vibration period of the frames used in this study are very close with the original one and the biggest different is in mode 2 for IS1 frame model which is about 0.05 s. Furthermore, the Mass Participation Factor of both models also very near with the original models. Therefore, it can be deduced that the model used in this study have similar dynamic properties with Hartzigeogious and Lilios’s [9] models. The nonlinear response of both models also was examined and compared using nonlinear time history analysis. The Imperial Valley earthquake recorded at station 5055 Hotville P.O. was employed in this analysis and the resulting Intestorey Drift Ratio (IDR) for model B4 and IS1 was plotted as shown in Figure 4. It is found that the both models exhibit similar fashion of IDR along the height of models in which the IDR increase as the height increases and it shows a little drops at top storey. The greatest IDR occurred at storey 6 and 7 for both models. This proved that nonlinear response along the height of the models have a similar trend. 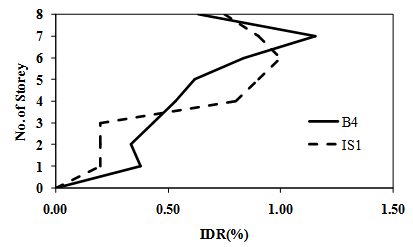 | Figure 4. Interstorey drift ratio |
Table 2. Dynamic Characteristic of Frames
 |
| |
|
3. Axial Loads in Columns
In this study, the nonlinear time history analysis was carried out according to Newmark’s method [2] and the following dynamic equilibrium equation is used to determine the response of the frames: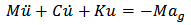 | (1) |
Where M is Mass, C is Damping, K is stiffness, ag is ground motion acceleration and the upper dots stand for time derivatives. The Ruaumoko [17] software was utilized to solve the above equation. Each of the RC frame models were excited by 20 ground motions; 10 horizontal earthquakes only (HGM) and 10 vertical plus horizontal ground motions (VHGM). In total, there were 40 nonlinear time history analyses were performed. The response of the frames due to vertical earthquake is quantified in terms of axial load variation or axial load ratio in the columns. The axial load ratio is determined as follows:  | (2) |
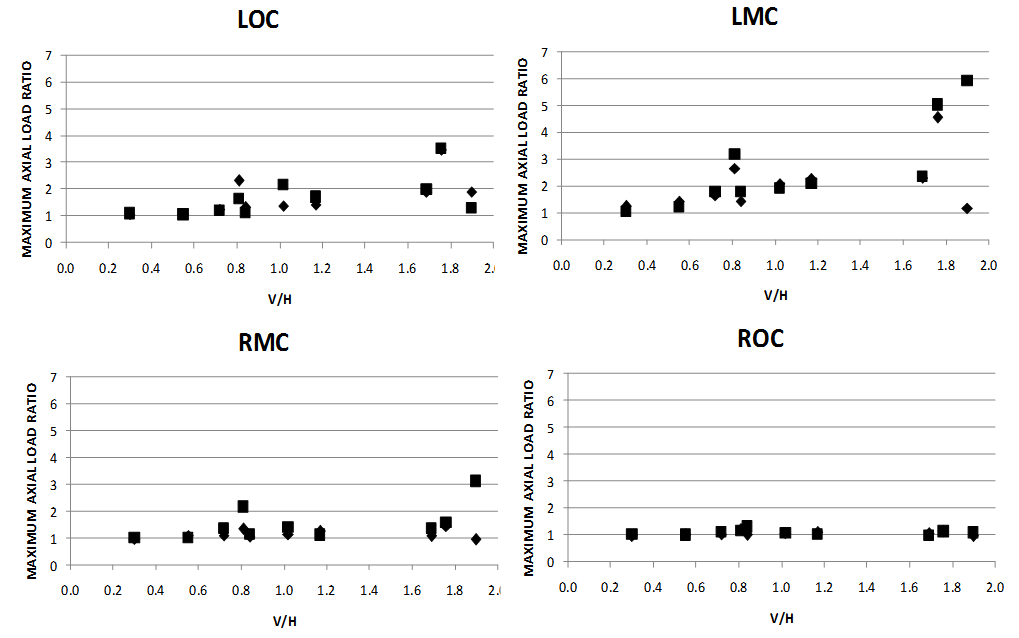
Where, Pv+h = axial load in column induced vertical and horizontal earthquake Ph = axial load in column induced by horizontal earthquake onlyFigure 5 shows the variations of axial load ratio along the height of the frame models. Positive sign indicates the tension forces and negative sign indicates the compression force. LOC, LMC, RMC and ROC are designated for Left Outer Column, Left Middle Column, Right Middle Column and Right Outer Column, respectively. It is found that, the axial load ratio increases as the V/H ratio increases, especially in LMC columns. Under the excitation of Morgan Hill Earthquake (G1) which have V/H = 0.3, the axial load in the column induced by VHGM is almost identical with the one that induced by HGM. However, when the V/H ratio increase to 0.81 (G4 – Tabas Earthquake), the axial load in LMC column under VHGM increases up to 3 times. Then, the axial load in LMC column increases up to 5 times when the V/H ratio increases to 1.76 (G9 – Gazli Earthquake). Besides that, the LOC column also shows an increase of axial load ratio as the V/H ratio increases, especially in higher storey, i.e. 7th and 8th storey. This significant increase of axial load in LMC and LOC columns may reduces the column’s ductility capacity and results in brittle failure mechanism. Furthermore, Figure 6 plotted the maximum axial load ratio for all columns (i.e.: LOC, LMC, RMC and ROC) of the IS1 model under ten ground motions with various V/H ratios, start from 0.3 until 1.9. The square and diamond shape of points indicate the compression and tension forces, respectively. It clearly show that the maximum axial load ratio increases as the V/H ratio increases except for ROC columns. The greatest increase of axial load is in LMC column, where, the VHGM of Nahanni earthquake (V/H = 1.9) induced 6 times greater compression forces compare to HGM. The most affected column for setback type of frames is the inner column (LMC). Furthermore, this study also found that the exterior columns (LOC) badly affected by the vertical ground motion. As illustrated in Figure 6, when VHGM is considered, the axial load in LOC column may amplified up to 3.5 times higher compared to the one without vertical components. This finding against the results obtained recently by Di Sarno et. al. [6], in which, they deduced that the variations of axial load in exterior columns when VHGMs are considered is negligible. This is because, the 6 April 2009 L’Aquila Earthquake that they considered posses low PGA and V/H ratio compared to this study. Therefore, in the near field region, the vertical earthquake component should be taken into account to design earthquake resistant structures. It also worth to highlight that, the vertical ground motion affects significantly the axial load in columns when its PGA is about 2/3 (70%) of its horizontal counterpart. There is also not much different between IS1 and IS2 buildings in term of the variation of axial load in the columns.
 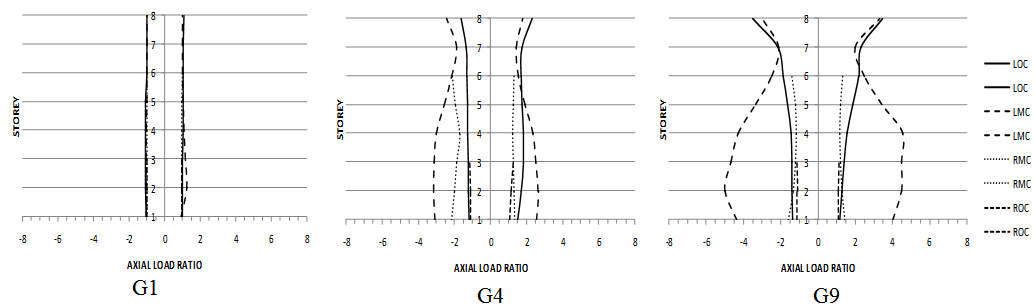 | Figure 5. Variation of axial load ratio along the height |
 | Figure 6. Maximum axial load ratio |
4. Conclusions
Numerous field evidents showed the devastating effect of vertical earthquake on the RC structures and a numbers of analytical study have been carried out to prove the field evident but not for setback type of buildings under various V/H ratio from 0.3 until near 2.0. This work investigated the effect of vertical ground motion on the irregular buildings with setback. For that purpose, this study considered ten natural earthquake records with epicentral distance less than 20 km. This study cannot be considered exhaustive. However, this study found that the vertical earthquake components may increase the axial load in interior columns up to 6 times higher than when on horizontal ground motion is considered. The exterior columns also may affected by the vertical ground motion especially when V/H more than 1 and PGA of the vertical earthquake more than 1g. This may reduces the ductility capacity of the column and result in brittle failure in shear. Therefore, the vertical earthquake components should be considered when designing a new structure or strengthening the existing one for both type of columns (exterior and interior).
ACKNOWLEDGEMENTS
The contribution of Ms Tan Mio Gin is gratefully acknowledged. Financial support for this research was provided by the Ministry of Education, Malaysia through a grant FRGS 9003-00407.
References
| [1] | Kim., S. J., & Elnashai., A. S. Seismic assessment of rc structures considering vertical ground motion. MAE Central Report No. 08-03. University of Illinois, Urbana, Illinois. 2008. |
| [2] | Nathan N. Newmark. A Study of Vertical and Horizontal Earthquake Spectra. United State Atomic and Energy Commission. 1974. |
| [3] | CEN. Eurocode 8: Design of Structures for earthquake resistance. Part 1: General rules seismic actions and rules for buildings. Final Draft prEN 1998. European Committee for Standardization. Brussels. 2003. |
| [4] | Pacific Earthquake Engineering Research (2008). PEER NGA Database, available at http://peer.berkeley.edu/nga/. |
| [5] | Papazoglou A.J. and Elnashai A.S. Analytical and field evidence of the damaging effect of vertical earthquake ground motion. Earthquake Engineering and Structural Dynamic. 1997. 25:1109-1137. |
| [6] | Di Sarno, L., Elnashai, A.S. and Manfredi, G. Assessment of RC Columns Subjected to Horizontal and Vertical Ground Motions Recorded during 2009 L’Aquila (Italy) Earthquake. Engineering Structures. 2011. 33:1514-1535. |
| [7] | Kim SJ, Holub CJ and Elnashai AS. Analytical assessment of the effect of vertical earthquake motion on RC bridge piers, ASCE J Struct Eng 2011; 137(2):252-60. |
| [8] | Kunnath SK, Erduran E, Chai YH, Yashinsky M. Effect of near fault vertical ground motions on seismic response of highway overcrossings. J Bridge Engineering ASCE 2008; 13(3):282-90. |
| [9] | Hatzigeorgiou., G. D., & Liolios., A. A. Nonlinear behaviour of RC frames under repeated strong ground motions. Soil Dynamics and Earthquake Engineering. 2009. In press. |
| [10] | Zarein, F., and Krawinkler, H. Simplified performance-based earthquake engineering. Report No. 169, John A. Blume Earthquake Engineering Center, Department of Civil and Environmental Engineering, Stanford University, Stanford. 2009. |
| [11] | Medina, R.A. and Krawinkler, H. Seismic demands for non-deteriorating frame structures and their dependence on ground motions. Report No. TR144, John A. Blume Earthquake Engineering Center, Department of Civil and Environmental Engineering, Stanford University, Stanford. 2003. |
| [12] | FEMA. Quantification of building seismic performance factors, 2009 edition, FEMA P-695, Applied Technology Council (ATC), Redwood City. 2009. |
| [13] | Haselton, C.B., Liel, A.B., Lange, S.T. & Deierlein, G.G. Beam-column element model calibrated for predicting flexural response leading to global collapse of RC frame buildings, Report No. 2007/03, Pacific Earthquake Engineering Research Center, University of California at Berkeley, Berkeley. 2007. |
| [14] | Fardis M. N. and Biskinis B. E. Deformation capacity of RC members, as controlled by flexural or shear. Otani Symposium, 2003. Pp: 511-530. |
| [15] | Panagiotakos T. B. and Fardis M. N. Deformations of reinforced concrete at yield and ultimate. ACI structural journal. Vol. 98 No. 2, March-April 2001. Pp: 135-147. |
| [16] | Berry, M., Parish, M., and Eberhard, M. PEER structural performance database user’s manual, Pacific Engineering Research Center, University of California, Berkeley, California. 2004. Available at http://nisee.berkeley.edu/spd/ and http://maximus.ce.washington.edu/-peera1/. |
| [17] | Carr, A.J. (2008). RUAUMOKO – inelastic dynamic analysis program. Department of Civil Engineering, University of Canterbury, Christchurch, New Zealand. |
 Abstract
 Reference
 Full-Text PDF
 Full-text HTML