-
Paper Information
- Next Paper
- Previous Paper
- Paper Submission
-
Journal Information
- About This Journal
- Editorial Board
- Current Issue
- Archive
- Author Guidelines
- Contact Us
Journal of Civil Engineering Research
p-ISSN: 2163-2316 e-ISSN: 2163-2340
2014; 4(3A): 116-119
doi:10.5923/c.jce.201402.19
Northern Uemachi Flexure Zone Investigated by Borehole Database and Numerical Simulation
 Abstract
 Reference
 Full-Text PDF
 Full-text HTML
Naoto Inoue1, Naoto Kitada1, Keiji Takemura2
1Geo-Research Institute
2Institute for Geothermal Sciences Kyoto University
Correspondence to: Naoto Inoue, Geo-Research Institute.
| Email: |  |
Copyright © 2014 Scientific & Academic Publishing. All Rights Reserved.
The subsurface flexure structure of the Uemachi Fault, which runs in the center of Osaka City, Japan, with N-S trend, was investigated based on numerous borehole database and numerical simulation, which was considered fault movements. The simulation result represents an actual layer profile, which was confirmed by borehole database.
Keywords: Borehole database, Fault structure, Flexure zone and fault displacement
Cite this paper: Naoto Inoue, Naoto Kitada, Keiji Takemura, Northern Uemachi Flexure Zone Investigated by Borehole Database and Numerical Simulation, Journal of Civil Engineering Research, Vol. 4 No. 3A, 2014, pp. 116-119. doi: 10.5923/c.jce.201402.19.
Article Outline
1. Introduction
- The Uemachi fault zone locates in the center of the Osaka City with N-S trend. The Uemachi fault is buried reverse fault and forms the flexure zone. Lifelines and constructions should consider the displacement of the Uemachi Fault Zone. In this region, the detection of geomorphological approach is difficult because of several regression of transgression of sea. Many organizations have carried out investigations of fault structures. Various surveys have been conducted, such as seismic reflection survey in and around Osaka (Fig. 1). Many borehole data for the constructions have been collected and the borehole database has been constructed. The database provides the high-quality subsurface structural information with several geological borehole data.
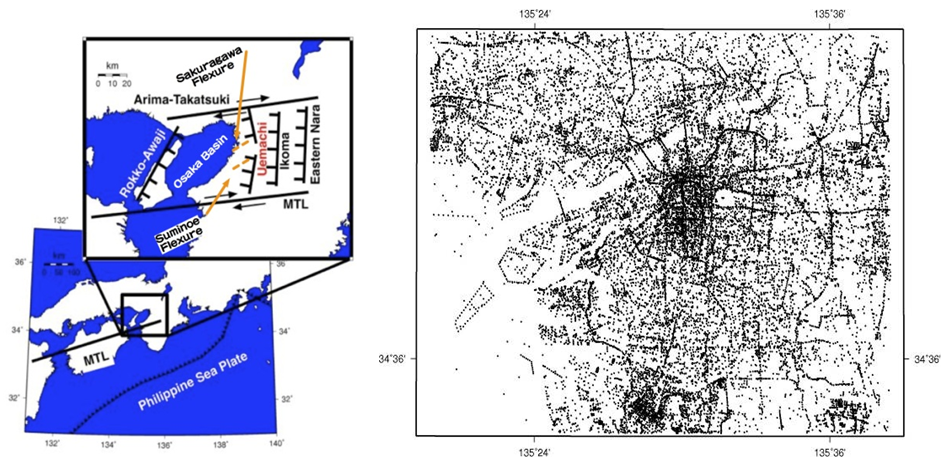 | Figure 1. Left: Tectonic setting of Uemachi fault. Right: Location of Uemachi Fault and survey lines and borehole points |
2. Data and Method
2.1. Borehole Data
- The many borehole data have been interpreted by compared with several geological investigated bore- hole and extend the lithological and geological information in lateral direction. Fig. 2 shows the example borehole profile across the Uemachi fault (Kansai Geo-informatics Network [1]).The distribution of interpreted marine clay layers was investigated. Fig. 3 shows gradient of the top on Ma10 above 1 degree. The contour of the basement also shown (Inoue et al. [2]). Fig. 2 and Fig. 3 indicate the flexure structures on the west side of the Uemachi fault. Furthermore, several layers on the eastern side of the Uemachi fault dips towards the east side. In the next section, we investigate the distribution of the marine clay due to the fault structure based on numerical simulation.
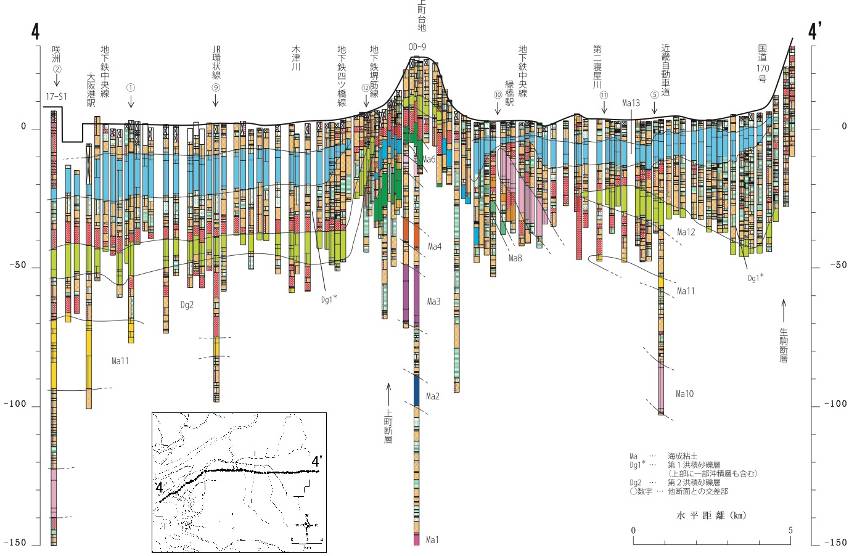 | Figure 2. Borehole database profile across the Uemachi Fault (Kansai Geo-informatics Network [1]) |
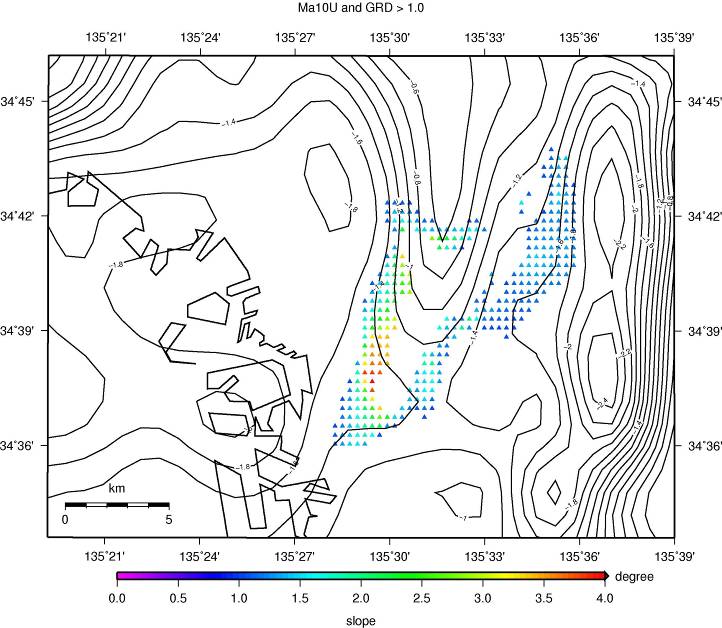 | Figure 3. Distribution of flexure zone of Uemathi fault (Inoue et al. [3]). The contour of the basement also shown (Inoue et al. [2]) in km |
2.2. Numerical Simulation
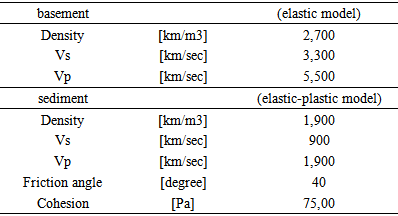
- Various numerical simulations have been carried out to investigate the development of buried reverse fault in soft sediment (e.g. Lin et al. [4]). The movement of the basement is given as wall movement in many numerical simulations (see Fig. 4 case 2). We carried out two cases of the simulations as shown in Fig. 4. The Comprehensive Research on the Uemachi Fault Zone reported that the dip of the Uemachi fault is 50° to 60°. Ishiyama [5] reported the 40°. We simulated low and high fault dip angle (30° and 60°). The total slip of the basement is 200m. The model was divided into 500 x 500 m. The Drucker-Prager and elastic model were used for the sediment and basement, respectively. The physical property is shown in Table. 1. We used Pylith code [6] for the simulation.
|
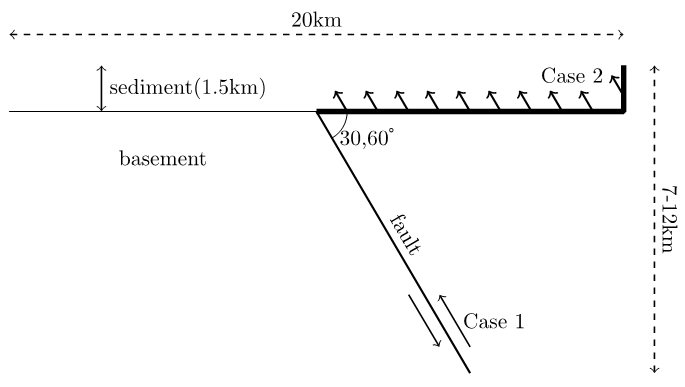 | Figure 4. Model Setting |
3. Concluding Remarks
- Fig. 5 shows the simulation result. The profiles shown the displacement at z=-50m. The case1 represents the flexure structure of marine clay on the west side of the fault and also represent the dipping to the east on the east side of the fault. The result of the low dip angle model is similar to the borehole profile in the northern part of the Uemachi fault (Fig. 2). The flexure structures were examined based on the borehole data around the Uemachi fault. The layers show the flexure structures on the west side of the fault and show the dipping to the east on the east side of the fault. We carried out 2 kinds of the Numerical simulation of the blind reverse fault. The simulation with fault movement shows the good agree with the actual distribution of the marine clay derived from borehole data.
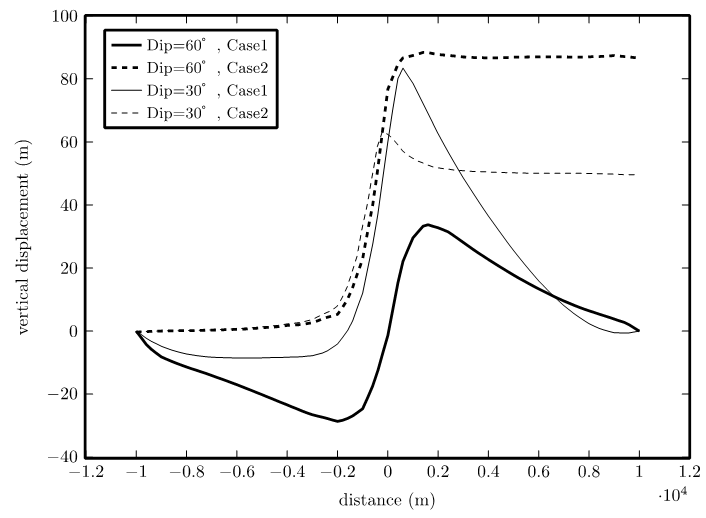 | Figure 5. FEM Result |
ACKNOWLEDGEMENTS
- This research is partly funded by the Comprehensive Research on the Uemachi Fault Zone (from FY2010 to FY2013) by the Ministry of Education, Culture, Sports, Science and Technology (MEXT).