-
Paper Information
- Next Paper
- Previous Paper
- Paper Submission
-
Journal Information
- About This Journal
- Editorial Board
- Current Issue
- Archive
- Author Guidelines
- Contact Us
Journal of Civil Engineering Research
p-ISSN: 2163-2316 e-ISSN: 2163-2340
2014; 4(3A): 72-77
doi:10.5923/c.jce.201402.12
Landslide Hazard Mapping of Penang Island Using Poisson Distribution with Dominant Factors
 Abstract
 Reference
 Full-Text PDF
 Full-text HTML
Lea Tien Tay1, Mutasem Sh. Alkhasawneh1, Habibah Lateh2, Md Kamrul Hossain2, Anton Abdulbasah Kamil2
1School of Electrical and Electronic Engineering, USM Engineering Campus, Penang, Malaysia
2School of Distance Education, Universiti Sains Malaysia, Penang, Malaysia
Correspondence to: Lea Tien Tay, School of Electrical and Electronic Engineering, USM Engineering Campus, Penang, Malaysia.
| Email: |  |
Copyright © 2014 Scientific & Academic Publishing. All Rights Reserved.
Landslides in Malaysia are mainly triggered by rainfall. However, there are many other landslide causative factors which are related to landslide event in Malaysia. One of them is topographical factor which plays an important role in the landslide susceptibility analysis. This paper presents landslide hazard mapping using dominant factors with Poisson Distribution approach and the study area is Penang Island of Malaysia. Landslide hazard map of Penang Island is generated by taking into account of twenty-two landslide causative factors, including fourteen topographic factors. After considering all twenty-two factors for landslide hazard mapping, the analysis is repeated with removing one factor at one time to determine the dominant landslide-causative factors. Eleven dominant factors are selected from the twenty-two factors. Landslide hazard map was segregated into four categories of risks, i.e. Highly hazardous area, Hazardous area, Moderately hazardous area and Not hazardous area. The maps was assessed using ROC (Receiver Operating Characteristic) based on the area under the curve method (AUC). Landslide hazard map produced by including all 22 factors has an accuracy of 77.75%. By removing 11 irrelevant factors and employing only 11 dominant factors, the generated hazard map achieves better performance with accuracy of 79.20%.
Keywords: Poisson Distribution, Geohazard, Hazard Mapping, Landslide
Cite this paper: Lea Tien Tay, Mutasem Sh. Alkhasawneh, Habibah Lateh, Md Kamrul Hossain, Anton Abdulbasah Kamil, Landslide Hazard Mapping of Penang Island Using Poisson Distribution with Dominant Factors, Journal of Civil Engineering Research, Vol. 4 No. 3A, 2014, pp. 72-77. doi: 10.5923/c.jce.201402.12.
Article Outline
1. Introduction
- Landslide is a geological phenomenon involving movement of mass of rock, deep failure of slopes or debris flows due to soil erosion. Landslides cause infrastructure damages, destroy properties and even claim human lives. Landslides happen rather frequently in Malaysia due to the heavy rainfall especially during annual monsoons mainly known as Southwest Monsoon from late May to September, and Northeast Monsoon from November to March. Damages due to landslides have been high from 2000 to 2009 [1]. It is difficult to predict a landslide event in space and time, however an area may be classified into different categories based on the level of potential hazard due to mass movement [2]. The identification of high risk areas is important in landslide prediction and warning system. Penang Island is chosen as area of interest in landslide hazard analysis in this research work as it has suffered numerous damages due to landslide in recent years. There have been many studies on landslide hazard evaluation using Geography Information Systems (GIS) and various analysis techniques. Probabilistic methods have been applied to achieve promising result in landslide hazard analysis [1, 3-6]. In this study, Poisson distribution was applied to produce the landslide hazard map for Penang Island. To the best of our knowledge, the Poisson distribution has been used for landslide hazard mapping for the first time in our previous study [7].
2. Study Area
- The study area chosen in this research work is Penang Island (Fig. 1) due to its frequent landslide occurrences over the years. Penang is one of the 13 states of Malaysia and it is located on the North West of Peninsular Malaysia. It is bounded to the north and east of the state of Kedah, to the south of the state of Perak and to the west of Strait of Malacca. Penang consists of the island of Penang and a coastal strip on the mainland known as Province Wellesley. In this paper, the island of Penang is considered for landslide analysis and mapping. The island covers an area of 285 km2 and is separated from the mainland by a channel. It is located on the geographical coordinates of 5o15’N to 5o 30’N latitudes and 100o 10’E to 100o 20’E longitudes. Elevation of the terrain ranges from 0 to 820 meters above sea level and slope gradient ranges from 0o to 87o. Penang Island is affected by fault lines that run from north to south mainly in the centre of the island. Land-cover of Penang Island consists mainly of swamp, plantation, forest, grassland and urban area. Major vegetation types are forest and fruit plantation. The average amount of rainfall varies from 2254 to 2903 mm annually.
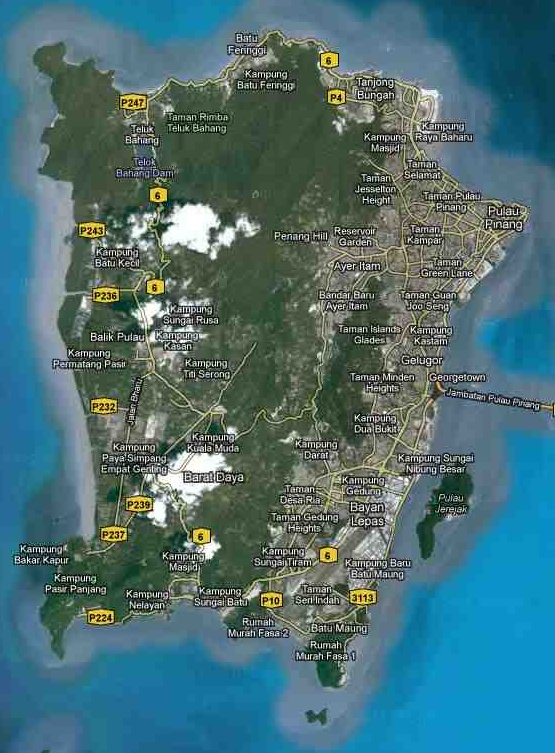 | Figure 1. Penang Island (Google map) |
3. Methodology
- Thirteen topographical factors were extracted from DEM, i.e. slope angle, slope aspect, plan curvature, profile curvature, tangential curvature, longitudinal curvature, cross section curvature, general curvature, total curvature, diagonal length, surface area, surface roughness and rugosity. Detailed works on the factors extraction can be found in [9]. Besides topographical factors, there are eight landslide-causative factors considered in this research work as well. They are land cover, vegetation cover, distance from road, distance from stream, distance from fault line, geology, soil texture and rainfall precipitation.Landslide hazard evaluation using probabilistic method has been proven to be very useful in the landslide prediction. The advantages of this method include its high efficiency, low cost, easy implementation and better interpretation of the relationships between landslides and landslide-causative factors. In probabilistic method, the weightages of each factor are calculated based on landslide density for certain classes [11]. These weightages represent the importance of each factor to occurrence of landslide and are used to produce landslide hazard index. Poisson distribution is a discrete distribution [12]. It is very useful in ecological studies. In this study, Poisson distribution is used for “landslide” which is a geological event. The distribution function for the Poisson distribution is defined as
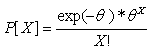 | (1) |
 | (2) |

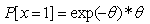
 Higher value of the probability for a characteristic shows high risk of landslide occurrence. Landslide hazard index is computed by summing up the probability of landslide in term of Poisson distribution of various factors as follows:
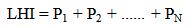 | (3) |
4. Verification and Discussion
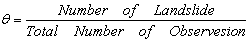
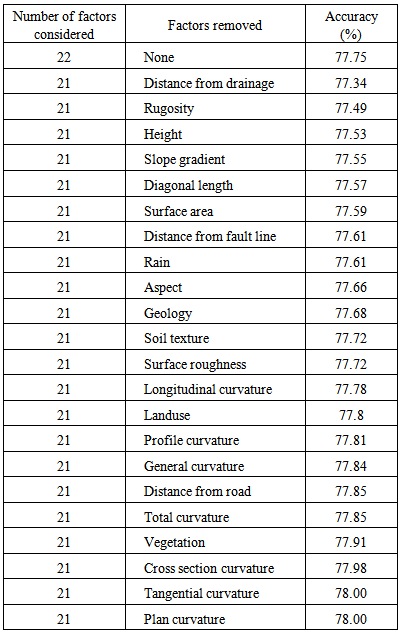
- In our analysis, ROC method was employed to verify the efficiency and accuracy of the landslide hazard mapping. Two assumptions are necessary to verify the maps. First assumption is that landslides are related to spatial information such as slope gradient and slope aspect, and the second assumption is that the future landslides will be affected by triggering factor such as rainfall [13]. Both assumptions are fulfilled in this study. Verification by ROC is carried out by first sorting the landslide hazard indexes (LHI) in a descending order. The ordered indexes are then divided into 100 classes and set on y-axis, with accumulated 1% intervals on x-axis [1]. The resulting graph shows a line curve that explains how well the model and factors predict future landslide [13]. The accuracies of the prediction models is represented by the area under the curves and it is one of the commonly used accuracy statistics in natural hazard assessments [13]. Table 1 shows the results obtained from the assessment of the landslide hazard map produced using all twenty-two factors and also the maps produced by removing one factors at one time. The accuracies of the landslide hazard maps are presented in percentage. If the accuracy of the produced map decreases when one particular factor is removed, this particular factor is a dominant landslide-causative factor. One the other hand, if the accuracy of the produced map increases by removing a particular factor, that factor is unimportant in landslide hazard analysis. Therefore, those unimportant factors should be removed to produce a hazard map with better accuracy. Based on the results in Table 1, eleven dominant factors are selected and they are distance from distance from drainage, rugosity, height, slope gradient, diagonal length, surface area, distance from fault line, rain, aspect, geology and soil texture. The unimportant factors are plan curvature, tangential curvature, cross section curvature, vegetation, total curvature, distance from road, general curvature, profile curvature, landuse, longitudinal curvature and surface roughness. The factors are arranged in the level of their importance in landslide analysis in Table 1, from the most important factor (distance to drainage) to the two least important factors (tangential curvature and plan curvature).
|
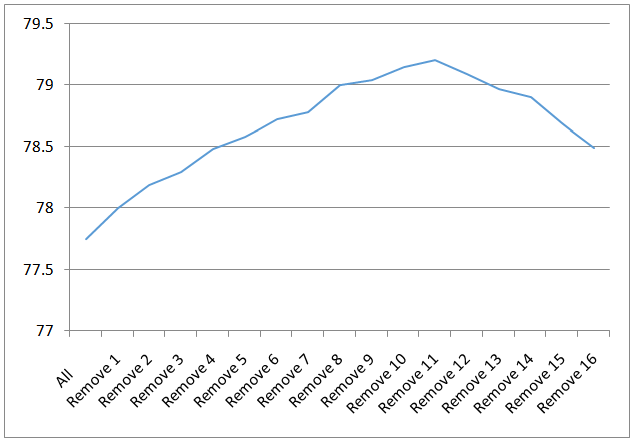 | Figure 2. Accuracies of the landslide hazard maps produced by removing increasing number of factors |
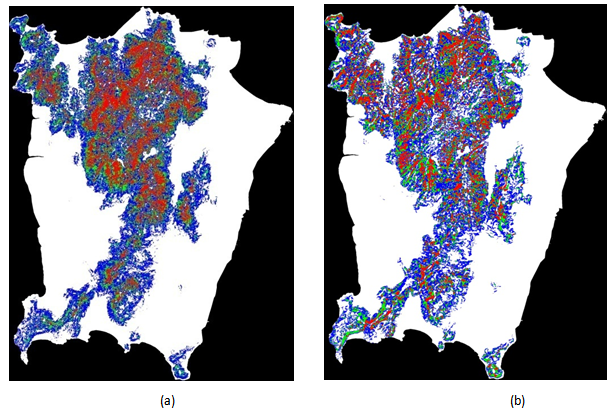 | Figure 3. Landslide hazard maps produced using Poisson distribution (a) with all twenty-two factors, (b) with eleven dominant factors |
5. Conclusions
- There are a lot of housing and development in the mountainous areas of Penang Island due to the limitation of flat land. This creates a scenario where landslide warning system is required to warn people of impending landslides on hazardous area. Prediction models such as statistical or probabilistic methods are simple approaches which have been proven to produce promising results in landslide prediction. In this paper, landslide hazard maps of Penang Island were produced with Poisson distribution using twenty-two landslide-causative factors available and also eleven dominant factors. The accuracy of the produced landslide hazard map improves when eleven dominant factors are used in the landslide hazard analysis as compared to the map produced using all twenty-two factors. The produced maps are useful as part of the guidelines in the sustainable land use planning and future development.
ACKNOWLEDGMENTS
- The authors would like to thanks the sponsorship from Ministry of Education Malaysia (MOE) under FRGS Top-Down research grant. The authors would also like to thank the Minerals and Geosciences Department Malaysia and Department of Irrigation and Drainage Malaysia for the data used in this research.