Mohammad Radzif Taharin, Fauziah Ahmad, Ahmad Shukri Yahaya
School of Civil Engineering, Engineering Campus, Universiti Sains Malaysia, Pulau Pinang, Malaysia
Correspondence to: Mohammad Radzif Taharin, School of Civil Engineering, Engineering Campus, Universiti Sains Malaysia, Pulau Pinang, Malaysia.
| Email: |  |
Copyright © 2014 Scientific & Academic Publishing. All Rights Reserved.
Abstract
The objective of the research is to determine the landslide trigger points in Kundasang, Sabah. Then the factor of safety (FOS) was developed by using the groundwater: landslide depth ratio. A set of data from two different sites in Kundasang were collected from the site investigation report. There are three main stages in determining the landslide trigger points. The first stage is to determine the location and coordinate of each boreholes from the two different sites in Kundasang. The second stage is to obtain descriptive statistics of the geotechnical characterization which includes internal angle of friction (Ф’), cohesion (c’), and groundwater level (m). The third stage is to determine the factor of safety of landslide by using Strength to Slope Ratio (SSR) in Infinite Slope Stability Charts. Boreholes with high groundwater level will be selected due to the criteria in the Infinite Slope Stability Charts. Results will be determined by the FOS value, 1.
Keywords:
Groundwater level, Slope Stability, Factor of Safety
Cite this paper: Mohammad Radzif Taharin, Fauziah Ahmad, Ahmad Shukri Yahaya, Determination of Landslide Trigger Points by Using Infinite Slope Stability Chart, Journal of Civil Engineering Research, Vol. 4 No. 3A, 2014, pp. 66-71. doi: 10.5923/c.jce.201402.11.
1. Introduction
Sabah is located at the north of Borneo Island, East Malaysia and adjacent to another state in Malaysia, which is Sarawak, and close to two other countries, which are Indonesia (Kalimantan) and Brunei. The area of the Sabah state is 73,620 km2. Kundasang is located at the toe of the Mount of Kinabalu, which is the highest peak in South East Asia, and part of the Crocker Range, and also the connecting road between west coast and east coast of Sabah. Due to its popularity as a tourist attraction area, the development of holiday resorts has been very rapid in Kundasang area. However, due to the landslide occurrence, the development needs to be planned properly to avoid any unnecessary losses due to the landslide. In most of the landslide cases in Malaysia, clay content has been one of the major factors. The unique of this Kundasang area, is that the clay content is very low, compare to other types of soil. And groundwater level is quite high at the certain area.Based on the previous study, Farooqi et al. (2005) presented a correlation of how clay can be determined as a major factor of the landslide in Batu Feringghi, Penang. The angle of internal friction is correlated with cohesion, which showed that relationship between these two parameters in positive-negative relationship. However, in the area, which clay existence is very minimal and the cohesion is zero, this relationship could not be used to describe the factors of landslide event, such as in Kundasang. Due to the high groundwater level, minimal percentage of clay existence and zero cohesion value, a simple method need to be adapted in order to determine which are the points that have a very high possibility to trigger the landslide (Das, 2002). Conforth (2005) has developed a chart for infinite slope analysis for slope stability, where the landslide:groundwater ratio (h:z) is emphasized as the main factor for the charts, which can also provide the slope angle (β) value, before determining the factor of safety (FOS) value. The unique of this chart is that the failure value of FOS is 1. Any FOS value, which is approximate to 1 is considered the less safe area. This study aims to determine the points of boreholes in the studied area, which has potential to trigger the landslide in Kundasang, so in the future, engineers can use this method to determine which area need to have more priority to avoid landslides.
2. Methodology
The data was obtained from 24 boreholes which were collected from two sites around the area of Kundasang in Sabah. The information contained in the report that will be used in the research are locations, description of soils, depth of soil and groundwater level. Kundasang is located in the northern part of Crocker Range National Park in Sabah as shown in Figure 1. 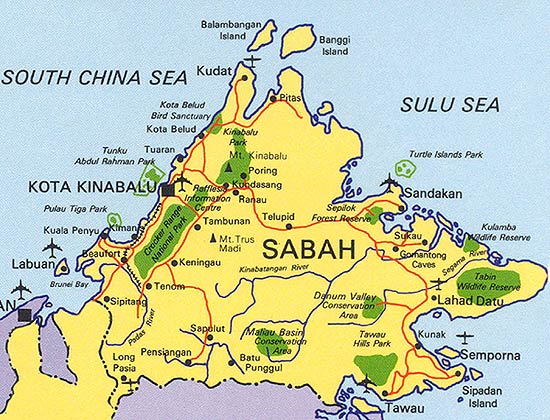 | Figure 1. Map of Sabah showing the study location. (Source: enton-1malaysia.blogspot.com, 2010) |
Popular as a tourist attraction, Kundasang is also connecting the west coast and the east coast of Sabah via transportation road. Furthermore, there are communities who reside in this area (Figure 2). Small town, schools, and other facilities and infrastructures are complete here. Despite of having all these, Kundasang is quite popular for landslide occurrence. Within these decades, there are lots of landslide occurrences alone in Kundasang area. And these landslides are affecting the transportation road and residential area, which causing inconvenience for road users and community, who resides there. 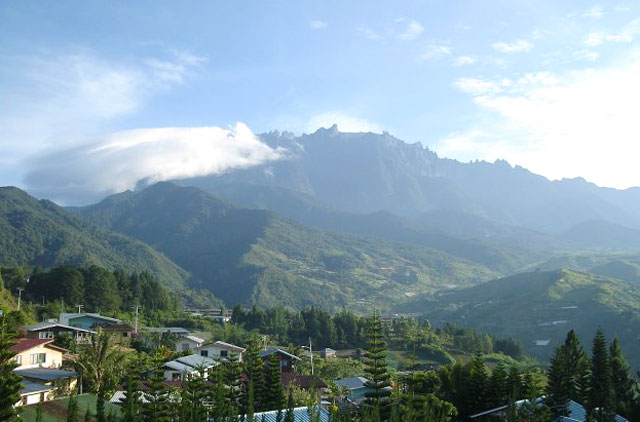 | Figure 2. Small town of Kundasang, Ranau, Sabah |
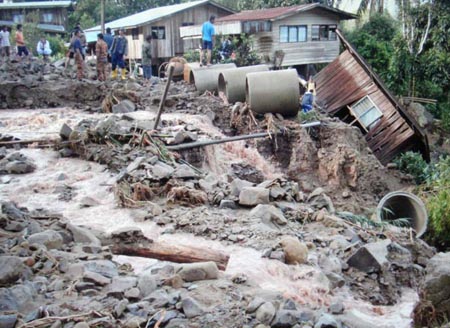
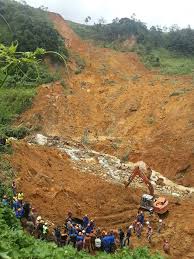
Within these five years, there are five landslides occurrence in Kundasang, and these landslides took place after long heavy rain. Each landslide occurred in 2010 and 2011 (Figure 3 and Figure 4), while in 2013, there are two landslides (Figure 5 and Figure 6) and one more in 2014. Due to the high frequency of landslides occurrence, Kundasang area is the most suitable area to be chosen as a study area for landslide. Different area would provide different type of soil. A study by Ahmad et.al (2005) showing that the landslide occurrence is highly contributed by the clay existence (Figure 7). However, this study could apply on the area with high percentage of clay. For the area with low percentage of clay, it is difficult to take the same conclusion for the different type of soil.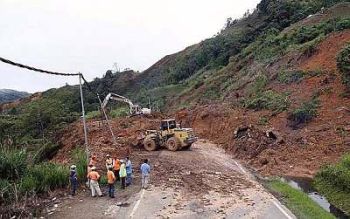 | Figure 3. Landslide in KM79.9, Kundasang in the year 2010. (Source: JKR Sabah, 2010) |
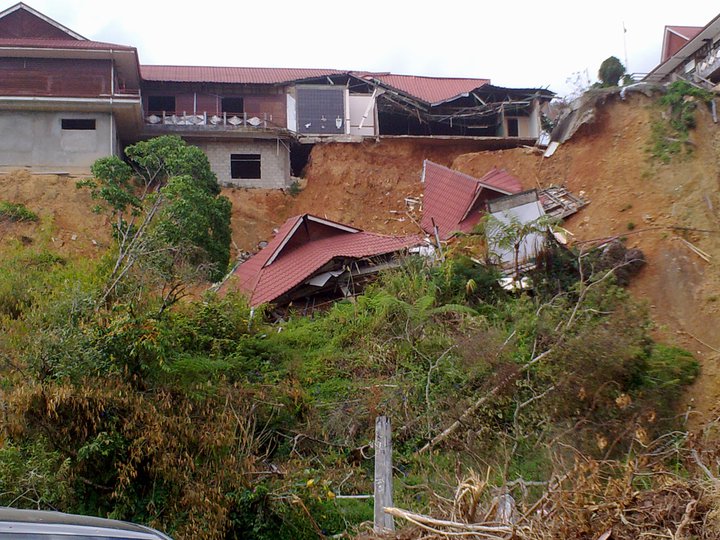 | Figure 4. Landslide in Zen Garden, Kundasang in the year 2011. (Source: JKR Sabah, 2011) |
 | Figure 5. Landslide in Mohimboyon, Kundasang in the year of 2013. (Source: JKR Sabah, 2013) |
 | Figure 6. Landslide in Mensilau, Kundasang in the year of 2013. (Source: JKR Sabah, 2013) |
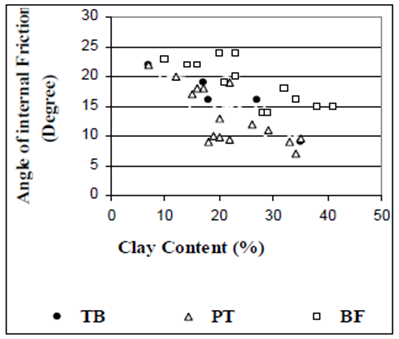 | Figure 7. Correlation of clay content and angle of internal friction (Ahmad et al, 2005) |
Kundasang area is popular with non-cohesive soil, where the existence of clay is very minimal or none at all. Due to these criteria, different approach is needed to determine the exact points that trigger the landslide. One of the best method for this type of soil, is to use the infinite slope analysis, whereby the parameters such as internal angle of friction, (Ф’), reduced level (m), groundwater level (m), borehole depth (m) and groundwater landslide ratio (h:z) will be used to determine the slope angle β, that trigger the landslide.The borehole with the highest groundwater level will be chosen, and the slope angle will be determined by using the Infinite Slope Analysis chart as shown in Figure 8 below. The soil cohesion for this method must equal to 0. The factor of safety, F is equal to 1, where the slope angle will be shown, according to Ф’ and h:z ratio.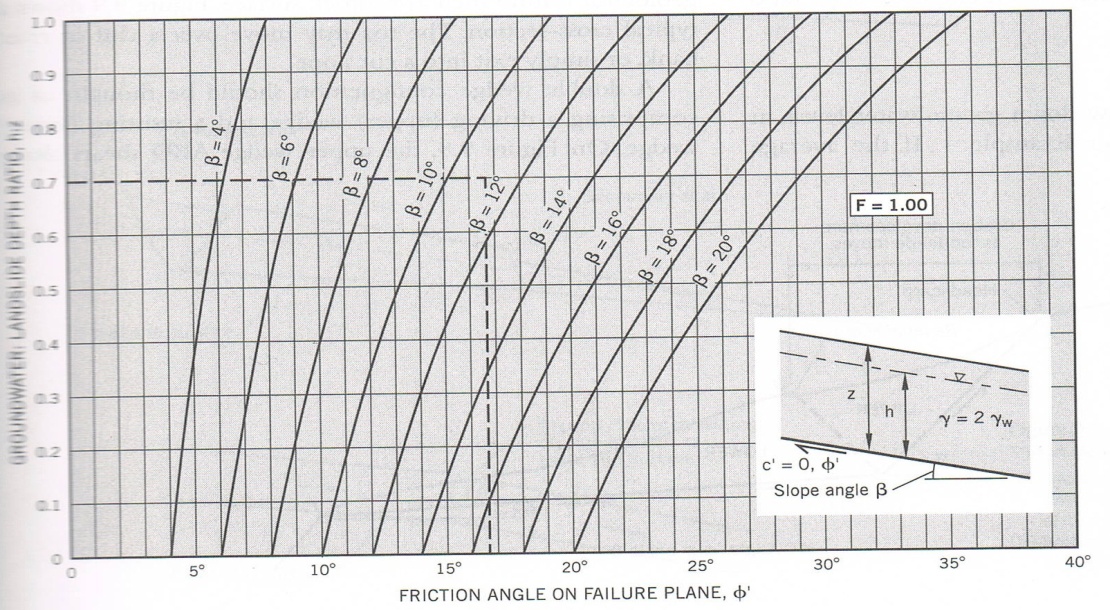 | Figure 8. Infinite Slope Analysis. Determination of Ф’ on failure plane based on slope angle β and groundwater/landslide depth ratio. (Source: Conforth, 2005) |
For this study, two landslides area has been chosen to be reviewed for case studies, which are Zen Garden as case study 1 and KM79.9 as case study 2. Area with high groundwater level is more likely to trigger the landslides (Cho, 2010). For this case study, the slope angle β could be determined since the groundwater level and the internal angle of friction, Ф’ are known. Only boreholes with increased value of groundwater level will be chosen due to the h:z ratio to be used in both charts (Rao, 2012). Value of β is obtained to show when the slope fail (F = 1).These slope angle β value, which were obtained from the Figure 8 can be cross validate to determine the accuracy of the factor of safety, F for the mentioned slope. This process in essential due to the accuracy of the slope angle β, which were detected as the landslide trigger is assured with small differences from the first method. If the percentage of difference is small, the method can be said is accurate and potential to be used for other landslide trigger point’s determination. If the percentage of differences in value of F is big, there is a need to use other methods in order to ensure that the value of F will be approximate to the first method.In order to cross validate this value, the second Infinite Slope Analysis chart (Fig.9) can be used. This chart can be use to determine the slope factor of safety by h:z ratio and Strength-Slope Ratio (SSR), which can be obtain by inserting the Ф’ and β value for determination by Equation (1):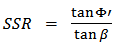 | (1) |
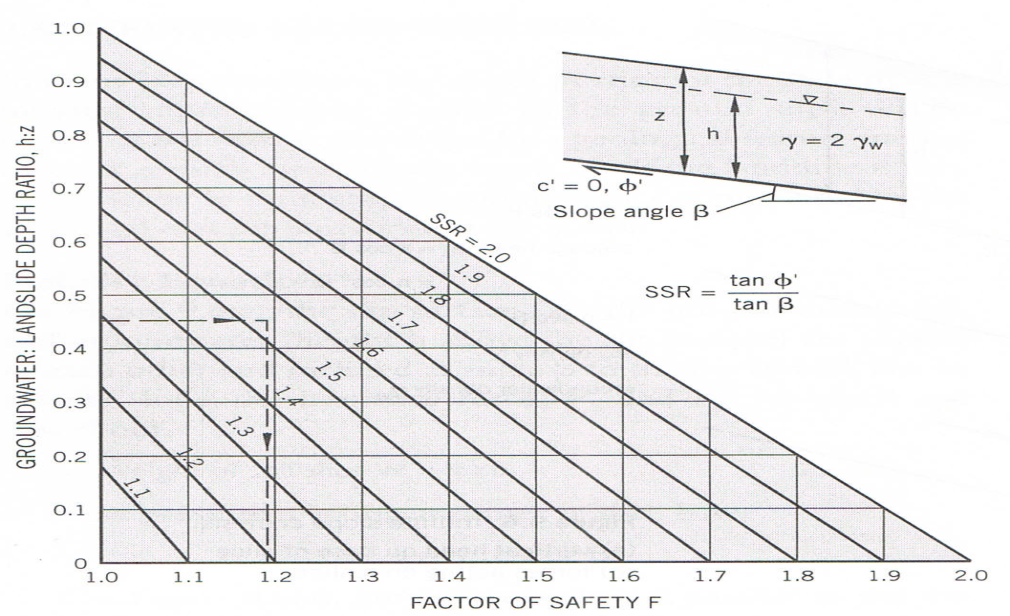 | Figure 9. Infinite Slope Analysis. Determination of factor of safety F for known groundwater:landslide depth ratio (h:z) and known shear strength:slope inclination ratio (tan Ф’/ tan β). (Source: Conforth, 2005) |
SSR were used to determine how strong the slope can be sustained when the Ф’ value is divided with the β value, by using the tangent of both parameters. This is due to the certain soils could not sustain at the slope when certain slope angle were given, especially for non-cohesive soils (Rao, 2012). Once again, for this type of soils (non-cohesive), groundwater: landslide depth ratio (h:z) is playing an important role to be a deciding factor of F value.By using the slope angle β value, which was obtained from the Infinite Slope Analysis chart from Figure 8, SSR value can be determined. The next process will be is determining the value of F, by mapping the SSR value and h:z ratio in the Infinite Slope Analysis chart from Figure 9. The differences could be seen and compared to the value of F, which is in this case, is 1.
3. Results and Discussions
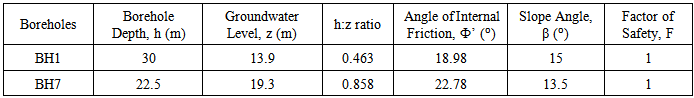
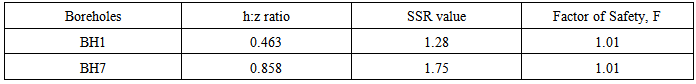
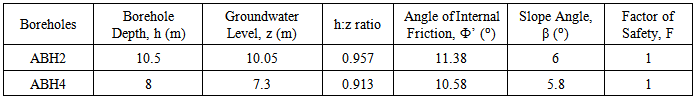
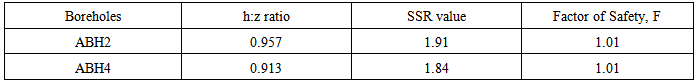
The analyses are done using the descriptive statistics to get the typical values that represent the study area. Figure 10 (case study 1) and Figure 11 (case study 2) below show the summary of the descriptive statistics for all boreholes in Kundasang. In both figures (Figure 10 and Figure 11), the chart is showing the reduced level, depth of the boreholes from the ground surface, and the groundwater level from the bedrock. This data is important to show which boreholes that filled with high level groundwater, and which are not. For this method to be applied, the high groundwater level will be given priorities due to the high contribution to the h:z ratio compare to the low groundwater level. Note that only few boreholes were filled with groundwater, and the level is different from one to another. Reduced level is showing the ground surface heights from the sea level.From Figure 10, only three boreholes that have groundwater level from the bedrock, which are BH1, BH7, and BH11. Other boreholes will be discarded for this method. Due to the BH11 is been determined as rock, and the value of Ф’ could not be determined, this method would only considered the data from BH1 and BH7. By using the data from these boreholes, the value of β could be determined by mapping all the values shown in Table 1 with the charts in Figure 8. After the value of β is determined, the cross-validation process will take place and by using the data shown in the Table 2, the mapping can be done by using the chart in Figure 9 to obtain the F value. From Figure 11, the same process will be done. The data from ABH2 and ABH4 were chosen and both of these boreholes went through the same process. The data is shown in Table 3 before using the first chart, and the cross-validated data is shown in the Table 4.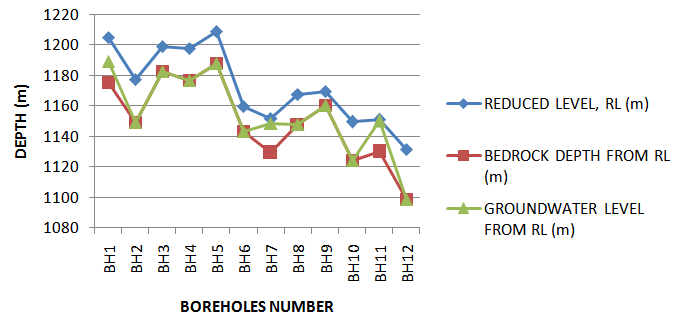 | Figure 10. Boreholes number and depth at Zen Garden (Case study 1) |
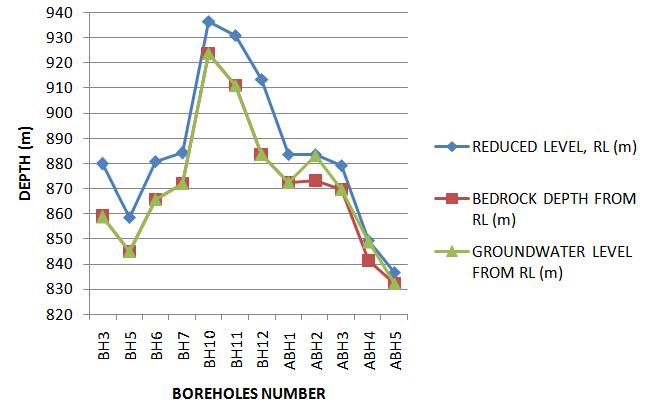 | Figure 11. Boreholes number and depth at KM 79.9 (Case study 2) |
Table 1. Properties of boreholes selected in Zen Garden
 |
| |
|
Table 2. Crosscheck the factor of safety, F by using the chart in Fig. 9
 |
| |
|
Table 3. Properties of boreholes selected in KM79.9
 |
| |
|
Table 4. Crosscheck the factor of safety, F by using the chart in Fig. 9
 |
| |
|
4. Conclusions
The research is to analyze the connection between the elevation of groundwater level and the factor of safety at slope. There are many theories have been mentioned regarding this relation but there are lacks of study to proof it. These are based on site investigation reports of project developments done during recent years. The study concentrates on the results of statistical analyses on the data.This research proves that the non-cohesive soils could contribute to the slope failure and landslide as much as cohesive soils (clay). And the high slope angle β, does not necessarily contribute to the slope failure or landslide, as the most of the study has shown. The groundwater level also playing important role in triggering the landslide, which is always overlooked as one of the initial factor of landslide. The factor of safety, F on the slopes tends to reduce due to the elevation of the groundwater level (Michalowski, 2009). In one slope area, there are only few boreholes that have elevated groundwater level. However, these few boreholes are the one which could trigger the landslide. The slope angle could be determined through this research and the differences of factor of safety; F value is very small, which is 1%.With these infinite slope analysis charts, the factor of safety, F and the slope angle, β, could be determine if one of them is available. This research is showing how important the groundwater level at the slope area to be given priority for safety and management planning, especially for the development which involved in such area. Engineers and researchers would benefit from this research in determining which areas need to be given priority for the risk, which area is need to be avoid, and which area is need the remedial works in the future.
ACKNOWLEDGEMENTS
The authors would like to acknowledge the Universiti Malaysia Sabah (UMS), Universiti Sains Malaysia (USM), Jabatan Kerja Raya (JKR) for providing these data and funding for this research.
References
| [1] | Enton-1malaysia.blogspot.com, Maps of Sabah, 2010. |
| [2] | Fauziah Ahmad, Ahmad Shukri Yahaya and Mohd Ahmadullah Farooqi. Characterization and Geotechnical Properties of Penang Residual Soils with Emphasis on Landslides, American Journal of Environmental Sciences, 2006, 2(4): 121-128. |
| [3] | D. H. Conforth, Landslides in Practice, 2005, New York; John Wiley and Sons. |
| [4] | B.M. Das. Principles of Geotechnical Design, 2001. New York; Thomson. |
| [5] | N.S.V.K. Rao, Foundation Design, 2012. New York; John Wiley and Sons. |
| [6] | R. L. Michalowski. Critical Pool Level and Stability of Slopes in Granular Soils, Journal of Geotechnical and Geoenvironmental Engineering, ASCE, 2009.135: 444-448. |
| [7] | Sung Eun Cho. Probabilistic Assessment of Slope Stability That Considers the Spatial Variability of Soil Properties, Journal of Geotechnical and Geoenvironmental Engineering, ASCE, 2010.136: 975-984. |
 Abstract
 Reference
 Full-Text PDF
 Full-text HTML