Fauziah Ahmad, Ahamd Shukri Yahaya, Muhamad Hisyam Halim, Kong Chun Sian
School of Civil Engineering, Engineering Campus, Universiti Sains Malaysia, Pulau Pinang, Malaysia
Correspondence to: Fauziah Ahmad, School of Civil Engineering, Engineering Campus, Universiti Sains Malaysia, Pulau Pinang, Malaysia.
| Email: |  |
Copyright © 2014 Scientific & Academic Publishing. All Rights Reserved.
Abstract
The soil contents for sand and silt are important in the development of project. Twelve locations containing 112 boreholes data in the Penang Island were collected and a database was set up. These boreholes logs were taken from site investigation reports by the Public Works Department, Penang Island. The database was set up for five sub-districts in Penang Island. Descriptive statistics was carried out on the thickness of sand and silt in these five sub-districts. Analysis of variance (ANOVA) was used to determine whether there are significant different in the thickness of sand and silt between the five sub-districts. All the analyses were carried out as case studies involving sand and silt thickness for Penang Island. Based on the results of the analyses, the mean of sand in five sub-districts were almost the same. District 11 – Teluk Kumbar is the area which contained the least sand if compared to other districts. For the thickness of silt, the results can be divided into two groups. These two groups were divided base on the mean value obtained from each sub-district.
Keywords:
Sand, Silt, ANOVA test
Cite this paper: Fauziah Ahmad, Ahamd Shukri Yahaya, Muhamad Hisyam Halim, Kong Chun Sian, Analysis of Thickness of Sand and Silt in Penang Island, Journal of Civil Engineering Research, Vol. 4 No. 3A, 2014, pp. 41-47. doi: 10.5923/c.jce.201402.06.
1. Introduction
Penang Island lie off the northwestern coast of Peninsula Malaysia with an area of about 293 km2. Penang has evolved from a trading centre to a manufacturing centre. Penang has begun the industrialization program in 1972 with the establishment of the first Free Trade Zone in Malaysia. It has attracted both foreign and local companies which have established projects in Penang. Hence many construction activities had been completed in this island ranging from small projects, such as condominiums, hotels, housings, highways and stadiums to mega projects such as the Penang bridge and the Sultan Abdul Halim bridge. In Penang, the most frequent hazard that always occurs is landslide. Malaysia is a hilly or a mountainous country and the slope failure are a common occurrence. Thus it is important to analyze the soil conditions in Penang Island.Fauziah Ahmad et al. (2006) has described in detailed about the characteristics, nature, structural features, engineering behaviour and field properties of soil samples in Penang Island. They found that the soil around Penang Island is either silty, clayey or sandy. Fauziah Ahmad et al. (2010) have determined the rating scale of two areas in Penang Island and found that 12% of the areas have high environmental risk. Chu et al. (1997) report reveals that the coastal area in the north and south of Penang Island is of rocky type and partially sandy beach. Based on aerial photographs, topography and coastal map and field observation works, they pointed out some results which can be visually compared with the TiungSAT-1 image (Abdul Hadi et al., 2000). This study aims at comparing the thickness of sand and silt between sub-districts of Penang Island to determine whether there are significant differences in their thickness. This will help engineers and policy makers make appropriate decisions in the future development of Penang Island.
2. Methodology
2.1. Study Area
The site investigation (S.I.) reports were collected from the Public Works Department, Penang. The data comes from 112 boreholes which were collected from 12 sites. The soil explorations of the sites were for the development of projects such as residential housing schemes, retaining wall, higher buildings and so on. The S.I. reports were produced from the year 1999 until the year 2004. These reports contain important information that had been extracted such as purpose of the project, water level, date drilled, depth of borehole, description of different layers and types of soils and rock, thickness of different layers and types of soils and rock, standard penetration test (SPT) of different layers and types of soils.In this case, the locations were from five districts out of 18 districts in Penang Island. They are District 11-Teluk Kumbar, District 12-Bayan Lepas, District 13-Paya Terubong, District 17-Batu Feringghi and District 18-Tanjung Tokong. The location of the study area is given in Figure 1. | Figure 1. Map of Penang (Source: Penang map, 2012) |
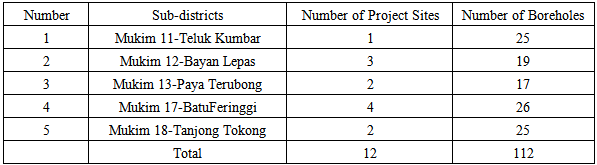
Table 1 shows in detail the five sub-districts, the number of boreholes and the number of project sites. A total of 12 project sites and 112 boreholes were used in the analysis.Table 1. Description of project sites and number of boreholes
 |
| |
|
The coordinates of the boreholes were determined from the site investigation reports. Interpolation techniques were used to obtain the location of each borehole.
2.2. Data Analyses
Descriptive statistics were used to characterize the data. Bar charts were plotted for each sub-districts to determine the distribution of the sand and silt thickness. The measures of location such as mean, median and mode and the measures of spread such as standard deviation and variance were also calculated. Comparisons of the descriptive statistics were also done. Inferential statistics in particular analysis of variance test (ANOVA) was used to compare whether there are significant differences in the sand and silt thickness between the sub-districts. If the ANOVA test is significant, Duncan's multiple range test was then used to determine the pairs of sub-districts that have similar sand or silt thickness.
3. Results and Discussions
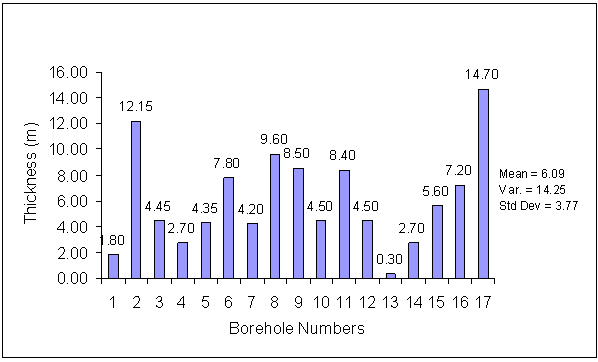
Bar charts for thickness of sand against borehole number for each district were plotted. Figures 2, 3, 4, 5 and 6 shows the sand thickness with the values for mean, variance and standard deviation.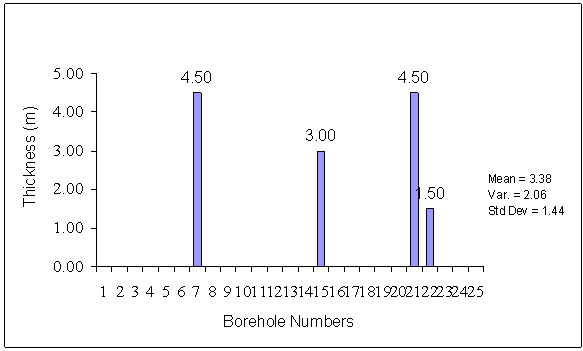 | Figure 2. Sand thickness(m) against borehole numbers for District 11-Teluk Kumbar |
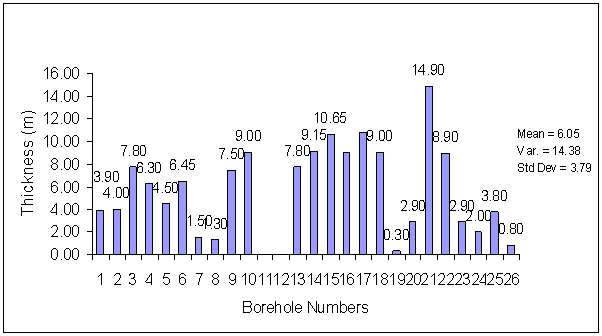
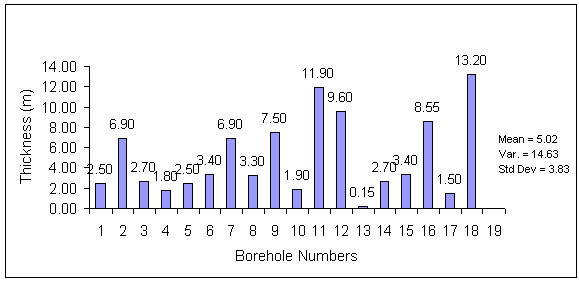 | Figure 3. Sand thickness(m) against borehole numbers for District 12-Bayan Lepas |
 | Figure 4. Sand thickness(m) against borehole numbers for District 13-Paya Terubong |
 | Figure 5. Sand thickness(m) against borehole numbers for District 17-Batu Ferringhi |
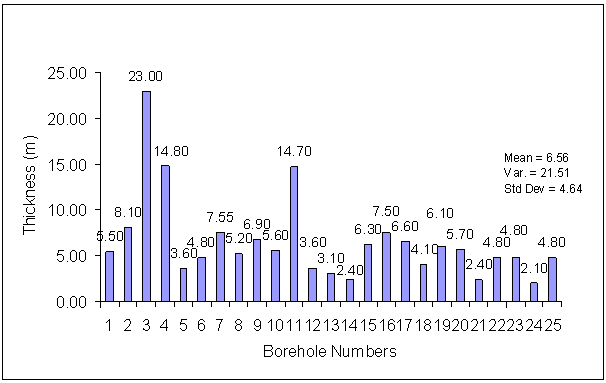 | Figure 6. Sand thickness(m) against borehole numbers for District 18-Tanjong Tokong |
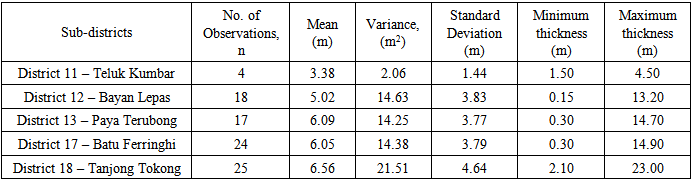
The summary of the descriptive statistics for sand is shown in Table 2. The mean thickness of sand ranged from 3.38m to 6.56m among the five sub-districts. The lowest mean thickness is in District 11 – Teluk Kumbar which is 3.38m, followed by District 12 – Bayan Lepas is 5.02m, District – 17 Batu Ferringhi is 6.05m, District 13 – Paya Terubong is 6.09m and District 18 – Tanjong Tokong is 6.56m. The variability of the sand thickness is low. District 18 – Tanjong Tokong has high sand thickness because it is near to the sea. Sand has high infiltration, lose water quickly and can be a good drainage system. It is a suitable place for development especially for roads and building.Table 2. Descriptive statistics for sand thickness in the five sub-districts
 |
| |
|
Bar charts for thickness of silt against borehole number for each district were plotted. Figures 7, 8, 9, 10 and 11 shows the silt thickness with the values for mean, variance and standard deviation.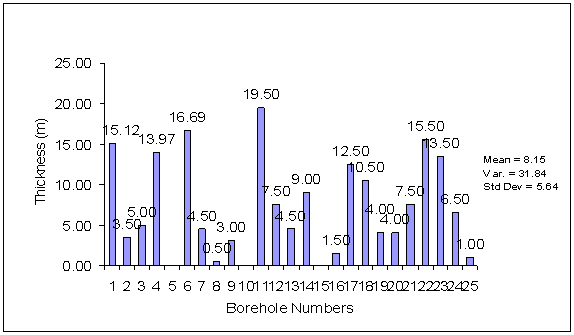 | Figure 7. Silt thickness (m) against borehole numbers for District 11-Teluk Kumbar |
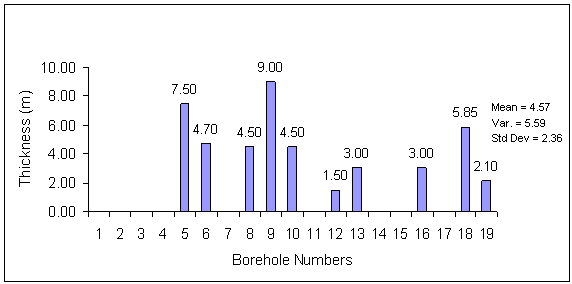 | Figure 8. Silt thickness (m) against borehole numbers for District 12-Bayan Lepas |
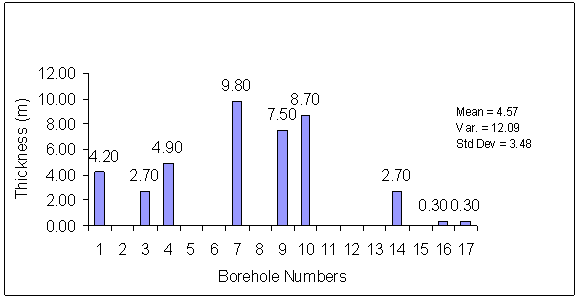 | Figure 9. Silt thickness(m) against borehole numbers for District 13-Paya Terubong |
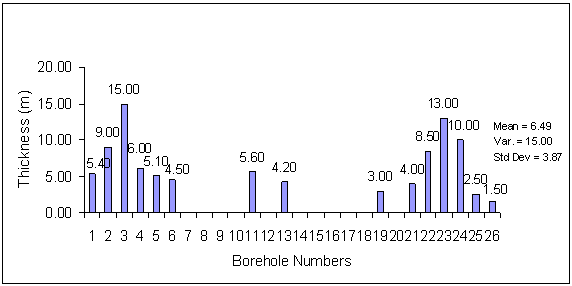 | Figure 10. Silt thickness(m) against borehole numbers for District 17-Batu Ferringhi |
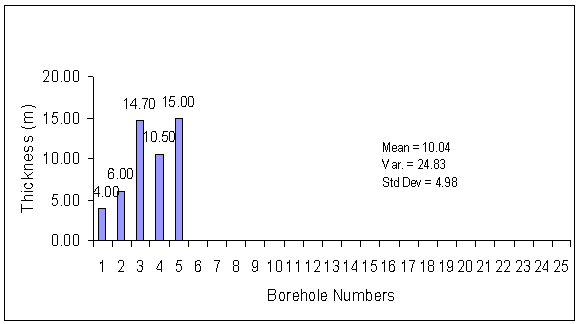 | Figure 11. Sand thickness (m) against borehole numbers for District 18-Tanjong Tokong |
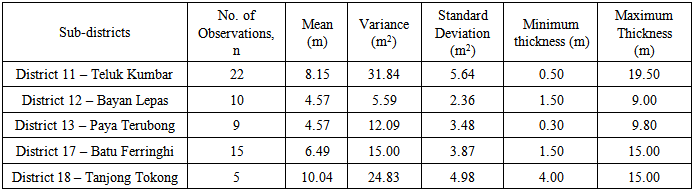
Table 3 shows the summary of the descriptive statistics for silt among the five sub-districts. District 10, District 13 and District 15 have mean thickness of silt which is less than 8.00 m. The standard deviations of the data were calculated too for measuring the variability of the mean values. Here, the standard deviation is small compared to the mean. Thus, the variability among the districts is small. The minimum thickness of silt was found in District 13 (0.30m) and maximum silt thickness is obtained at District 11 (19.50m).Table 3. Descriptive statistics for silt thickness in the five sub-districts
 |
| |
|
The analysis of variance (ANOVA) test (Ahmad Shukri Yahaya et al., 2008) was done to determine whether there are significant differences in the mean sand and silt thickness between the five sub-districts. The results of the ANOVA test shows that there is no significant difference in the thickness of sand between the five sub-districts (F-statistic = 0.801 and p-value = 0.528). For the thickness of silt, the ANOVA test shows that there is a significant difference between the five sub-districts (F-statistic = 2.350 and p-value = 0.065). Duncan’s Multiple Range test was performed to determine the different groups. The first group is District 12, District 13, District 11 and District 17 which have no significantly differences in the mean thickness of silt. The second group is District 11, District 17 and District 18 which have no significantly differences in the mean thickness of silt. However, the mean thickness of silt for group 2 is greater and is significantly different than the mean thickness of silt for group 1.For silt, District 11 – Teluk Kumbar and District 18 – Tanjong Tokong have higher silt thickness compared to the other districts. The size particle for silt is smaller than sand but it has more plasticity and cohesively. Existing sand and silt in soil helps in selecting the type and depth of foundation which are suitable for a structure. Frictional force between soil and the pile shaft helps support the structure loading. Thus, it is important to determine the total sand and silt thickness in soil.
4. Conclusions
The research is to analyze the thickness of sand and silt in Penang Island. These are based on site investigation reports of project developments done during recent years. The study concentrates on the results of statistical analyses on the data. To have a complete database of characteristics of soil is necessary to plan for future development in Penang Island. The soils characteristics are described and analyzed based on information from a total of 112 boreholes logs collected. Five sub-districts were considered. The descriptive statistics were calculated to determine the soil profile around the area. District 18 – Tanjong Tokong has high mean sand thickness and therefore it is a suitable place for development especially for roads and buildings. For silt, District 11 – Teluk Kumbar and District 18 – Tanjong Tokong have higher mean silt thickness compared to the other districts. The size particle for silt is smaller than sand but it has more plasticity and cohesively. Existing sand and silt in soil helps in selecting the type and depth of foundation which are suitable for a structure. Frictional force between soil and the pile shaft helps support the structure loading. Thus, it is important to determine the total sand and silt thickness in soil. One way Analysis of Variance test was applied to test whether the mean thickness between the sub-districts are equal or not. From the results of the analyses, conclusions of thickness of sand and silt in Penang Island can be interpreted. The thicknesses of sand in the five sub-districts were found not to be significantly different. However, the means of silt thicknesses between the five sub-districts are not equal. Thus, Duncan’s Multiple Range Test has been carried out. The result shows that silt thickness among the five districts is significantly different. Thus, the thickness of silt between the sub-districts is not equal between them.
ACKNOWLEDGEMENTS
The authors would like to acknowledge the Universiti Sains Malaysia for funding this research through the Research University grant scheme and Education Malaysia for ERGS grant scheme.
References
| [1] | Abdul Hadi Abd Rahman, Mohamad Zaki Ibrahim and Yajesh V. Ramachandram. Coastal Sedimentation and Recent Coastalline Changes Along the Seberang Perai. Proceedings of the Geological Society of Malaysia Annual Geological Conference 2000, 8 – 9 September 2000. |
| [2] | Ahmad Shukri Yahaya, Amran Ahmed, Darmesah Gabda, Chin Su Na, 2008. Problems and Solutions in Statistics for Engineers and Scientists. 2008. Pearson Prentice-Hall, 299 pp. |
| [3] | L.H. Chu, H.P. Ong, P.P. Sinjeng, A.A. Kadir, K.M. Slar and C.S. Ismail. An Investigation of Malaysia Granitic Rocks as Suitable Source of Feldspar. Journal of Asian Earth Sciences. 1997, 15: 477-488. |
| [4] | Fauziah Ahmad, Ahmad Shukri Yahaya and Mohd Ahmadullah Farooqi. Characterization and Geotechnical Properties of Penang Residual Soils with Emphasis on Landslides, American Journal of Environmental Sciences, 2006, 2(4): 121-128. |
| [5] | F. Ahmad, A.S. Yahaya, M.M. Ali, WNAM Hussain. Environmental Risk Assessment On Hill Site Development In Penang, Malaysia: Recommendation On Management System, European Journal of Scientific Research. 2010, 40(3):318-340. |
| [6] | Penang Map available at: http://malaysia-maps.com/penang/ (accessed 01/01/2012). |
 Abstract
 Reference
 Full-Text PDF
 Full-text HTML