Ahmad Shukri Yahaya, Fauziah Ahmad, Lo Yean Tiing
School of Civil Engineering, Engineering Campus, Universiti Sains Malaysia, Pulau Pinang, Malaysia
Correspondence to: Ahmad Shukri Yahaya, School of Civil Engineering, Engineering Campus, Universiti Sains Malaysia, Pulau Pinang, Malaysia.
| Email: |  |
Copyright © 2014 Scientific & Academic Publishing. All Rights Reserved.
Abstract
The objective of the research is to determine the characteristics of sand in Batu Ferringhi, Penang. Then an ordinary kriging model was developed which can be used to predict thickness of sand. A set of data from three different sites in Batu Ferringhi were collected from the site investigation report. There are three main stages in predicting sand thickness. The first stage is to determine the location and coordinate of each boreholes from the three different sites in Batu Ferringhi. The second stage is to obtain descriptive statistics of the thickness of sand. The third stage is to model the sand thickness using ordinary kriging and to obtain the best model. The results show that the best model variogram is the exponential function. Five boreholes were then used for prediction using the best ordinary kriging model. It was found that the prediction is quite accurate.
Keywords:
Sand, Semivariogram, Ordinary kriging
Cite this paper: Ahmad Shukri Yahaya, Fauziah Ahmad, Lo Yean Tiing, Prediction of Sand Thickness Using Ordinary Kriging, Journal of Civil Engineering Research, Vol. 4 No. 3A, 2014, pp. 36-40. doi: 10.5923/c.jce.201402.05.
1. Introduction
Penang is located at the north-eastern coast and constituted by two geographically varying entities which is an island with area of 293 km2 called Penang Island and a portion of mainland called Seberang Perai having the area of about 755 km2. Batu Ferringhi is located in Penang island. The development in Penang Island is very rapid because it is one of the most industrialized area in Malaysia. In Penang, the most frequent hazard that always occurs is landslide. Malaysia is a hilly or a mountainous country and the slope failure are a common occurrence. Geologically, this area is also underlain by medium to coarse-grained biotite granite layer with predominant orthoclase and subordinate microcline (Fauziah Ahmad et al., 2005). Thus it is important to analyze the soil conditions as well as to predict sand thickness in Penang Island.Based on the kriging principle, Ishii and Suzuki (1989) presented a simple probabilistic model that evaluates an unknown value of ground thickness and estimation of error for the soil properties at unsampled location in the ground. This model is capable to evaluate the borehole spacing. However, the model required statistical parameters, namely, a correlation distance and variance of soil properties as important data input. The geotechnical database system for Saga Plain, Japan provided the parameters needed. Finally, the exploration spacing for different values of estimation error was suggested for site investigation. A kriging prediction case study was carried out on clay thickness data in Kuala Lumpur (Saffur, 2003). This prediction technique is capable in predicting the clay thickness at an unsampled location provided that the data used were collected at reasonable distances so that it is correlated, for the technique to work. The kriging method was used to estimate the presumed unknown values of sorptivity for a soil under tilled and no-tilled condition in some locations in the 0.5 m × 0.5 m grid distances (Sepaskhah et al., 2004). The result shows that the method is capable to estimate the unknown sorptivity of the soil. This study aims to determine the characteristics of sand thickness in Batu Ferringhi, Penang Island and to predict sand thickness using ordinary kriging so that engineers can use this model to predict sand thickness at unsampled locations.
2. Methodology
2.1. Study Area
The data was obtained from 22 boreholes which were collected from three sites around the area of Batu Ferringhi in Penang Island. The information was obtained from the Public Works Department, Malaysia from the site investigation reports. The data that was extracted from the reports t are location, description of soils, depth of soil and thickness of soil. Batu Ferringhi is located in the northern part of Penang Island as shown in Figure 1. The coordinates of the boreholes are obtained using ArcView GIS software (Lee and Wong, 2001) by plotting the boreholes based on the contour levels in the report and hence the coordinate for each borehole was obtained.  | Figure 1. Map of Penang showing the study location (Source: Penang map, 2012) |
2.2. Descriptive Statistics
Descriptive statistics for measures of location such as mean, median, minimum and maximum values were obtained. The mean represents the average value of all the observations of size n while the median is the middle value in a set of observations when they are arranged in the order of magnitude. The measures of spread such as standard deviation, variance and range were calculated. The standard deviation measures the variability of the data from the mean. The coefficient of variation (COV) was also calculated to determine the extent of variability of the data on sand thickness. The value of COV less than 1 shows low variability in the data while COV greater than 1 indicates high variability in the data.
2.3. Semivariogram Models
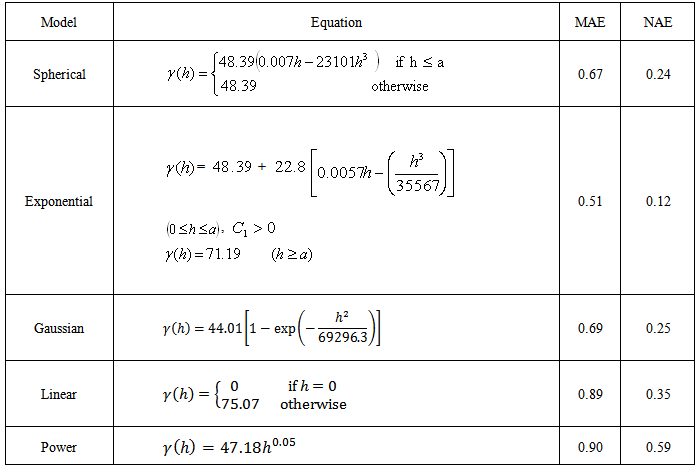
For predicting sand thickness five semivariogram models were fitted namely Spherical, Exponential, Gaussian, Linear and Power functions. These models are discussed in the following sections. More information about these models can be found in Kaluzny et al. (1997). The best semivariogram model was chosen to be used in ordinary kriging.
2.3.1. Spherical Model
The spherical model is given in Equation 1. Spherical model has a linear behaviour at small separation distances near the origin but flattens out at larger distances, and reaches the sill at  . In fitting this model to a sample semivariogram it is useful to note that the tangent at the origin reaches the sill at about two thirds of the range.
 | (1) |
where  is the semivariogram model,
  is the Euclidean distance between two points,
  is the range and
  is the nugget.
2.3.2. Exponential Model
The equations for exponential model with a nugget are  | (2) |
 | (3) |
where  +
+  is the sill of the semivariogram,
  is the nugget effect that represents the micro-scale variation and/or measurement error,
  is the Euclidean distance between two points and
  is the range.
2.3.3. Gaussian Model
The form of the Gaussian model is  | (4) |
where  is the nugget effect that represents measurement error,
  is the Euclidean distance between two points and
  is the range. Asymptotically,
  approaches the sill.
2.3.4. Linear Model
The equation for the linear model is | (5) |
where  +
+  is the sill of the semivariogram and
  is the Euclidean distance between two points.
2.3.5. Power Model
The equation for the Power model with a nugget is | (6) |
where  is the nugget effect,
  is the Euclidean distance between two points and
  is the range. For this model the parameter
  is a dimensionless quantity,
  has dimensions of the variance and there is no sill for the power model.
2.4. Error Measures
Goodness-of-fit was used to examine how well a sample of sand thickness data agrees with a given semivariogram model. From this measures, the best semivariogram model that fit the sand thickness data will be chosen. In this research, error measures such as the mean absolute error (MAE) and normalized absolute error (MAE) were used. The equations are given by Lu (2002).The mean absolute error (MAE) is: | (7) |
The normalized absolute error (NAE) is: | (8) |
where;n = Total number of data  = Predicted values of sand thickness using one of the semivariogram models
 = Observed values of sand thickness
 = Mean of the predicted values of sand thickness using one of the semivariogram models
 = Mean of the observed values of sand thicknessFor both the MAE and NAE, values closer to zero indicates better semivariogram distribution.
2.5. Ordinary Kriging
The ordinary kriging model (Webster and Oliver, 2000) must meet two assumptions that are given as follows: (1) The first assumption is that the sampling is a partial realization of a random function Z(x), where x denotes spatial location.(2) The second assumption is that the random function is second order stationary over sampling domain, which implies that,  and
and 
 .where E[.] denotes expected value, m is a constant mean, h is a vectorial distance in the sampling space and Cov [.] is the covariance of the random function. The best semivariogram model was used to obtain the ordinary kriging model that is given below:
 | (9) |
where  and
and  are the random variables of a random function sampled at sites
  and
and  is the estimated location,
  with
with  ’s be the optimal weights for the estimator and
  is the Lagrange multiplier,
  is the covariance matrix.
3. Results and Discussions
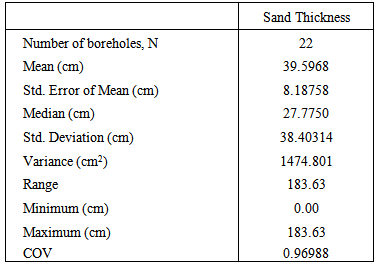
The analyses are done using the descriptive statistics to get the typical values that represent the study area. Table 1 below shows the summary of the descriptive statistics for all boreholes in Batu Ferringhi.Table 1. Summary of descriptive statistics for thickness of sand and clay
 |
| |
|
From Table 1, the mean for sand thickness is 39.6cm. This shows that the geotechnical profile for Batu Ferringhi is rich with sand. The range of sand thickness is 183.6cm. The value for coefficient of variation (COV) is small (less than one) showing that the variability of sand thickness is small.The surface plot for sand thickness based on the coordinates of the boreholes is given in Figure 2. From the Figure 2, the bubble plots are the point and the locations of the boreholes with the sand thickness. The bigger the bubble, the greater is the thickness. The surface of the sand thickness indicates that the most thickness area falls between x-coordinate from 253000 to 254000.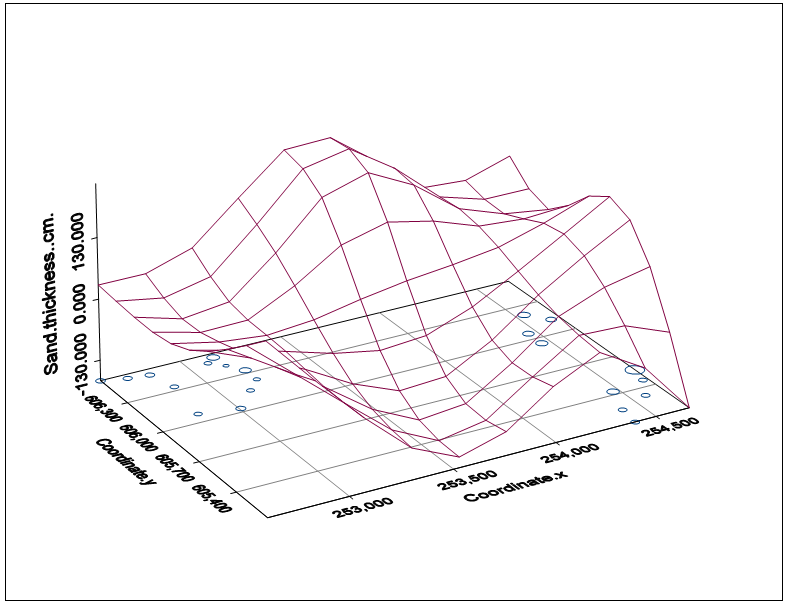 | Figure 2. Surface plot of the sampled points |
3.1. The Semivariogram Model
The results of fitting the semivariogram models to the 22 samples of sand thickness together with the values for the error measures are given in Table 2.Table 2. Semivariogram models and error measures
 |
| |
|
From the results of Table 2, the smallest values for MAE and NAE are obtained for the exponential model. Thus the exponential model was chosen to be used for obtaining the ordinary kriging model.
3.2. Prediction Using Ordinary Kriging
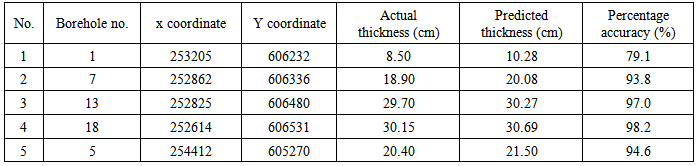
In this case study, 22 samples of sand thickness from Batu Ferringhi were used to carry on the ordinary kriging prediction. The coordinates for the 22 boreholes were obtained by visiting the sites as well as by using the ArcView GIS software.Due to lack of data, five observations of sand thickness were then taken out randomly in order to predict the thickness of sand, which is assumed, had not been visited. Table 3 shows the five samples used to predict sand thickness.Table 3. Prediction of sand thickness using ordinary kriging
 |
| |
|
Table 2 shows the predicted sand thickness for the five locations, which was assumed, had not been visited. The percentage accuracy for the prediction varies from 79.1% until 98.2%. Four out of five locations were accurately predicted with percentage accuracy more than 90% which were borehole 7, 13, 18 and 5. The sand thickness at borehole number 1 was not predicted reasonably well (percentage accuracy of 79.1%).
4. Conclusions
The research is to analyze the thickness of sand at Batu Ferringhi, Penang Island. These are based on site investigation reports of project developments done during recent years. The study concentrates on the results of statistical analyses on the data. The characteristics of sand are described and analyzed based on information from a total of 22 samples. The descriptive statistics were calculated to determine the sand profile around the area. It was found that the mean sand thickness is 39.6cm and the variability of sand thickness in Batu Ferringhi was very small.The best variogram model was found to be the exponential function with range, a = 261.02, sill = 71.19 and nugget, Co = 48.39. This variogram model was used to obtain the ordinary kriging model. Predictions of sand thickness at five chosen points were found to be accurate. Thus it will enable engineers to predict with good accuracy the sand thickness using the developed model.
ACKNOWLEDGEMENTS
The authors would like to acknowledge the Universiti Sains Malaysia for funding this research through the Research University grant scheme.
References
| [1] | K. Ishii and M. Suzuki. Stochastic finite element analysis for spatial variations of soil properties using kriging technique. In: Proceedings of ICOSSAR '89, the 5th International Conference on Structural Safety and Reliability, Part II, Aug 7-11 1989, San Francisco, CA, USA. America: America Society of Civil Engineers. pp. 1161-1168. |
| [2] | S. Saffur. Analysis of site classification for Kuala Lumpur’s ground assessment. 2003, MSc thesis, University Sains Malaysia. |
| [3] | Fauziah Ahmad, Ahmad Shukri Yahaya and Mohd Ahmadullah Farooqi. Characterization and Geotechnical Properties of Penang Residual Soils with Emphasis on Landslides, American Journal of Environmental Sciences, 2006, 2(4): 121-128. |
| [4] | A.R. Sepaskhah, S. H. Ahmadi and A.R. Nikbakht Shahbazi. Geostatistical analysis of sorptivity for a soil under tilled and no-tilled conditions. Journal of American Society of Civil Engineers. 2004, 83(2):237-245. |
| [5] | Penang map (2012) available athttp://www.welt-atlas.de/karte_von_penang_6-151 (accessed 01/01/2012). |
| [6] | J. Lee and D.W.S. Wong. Statistical analysis with ArcView GIS. 2001. New York: John Wiley. |
| [7] | R. Webster and M.Oliver. Geostatistics for environmental scientists. 2000. Chichester: John Wiley and Sons. |
| [8] | N.A.C. Cressie. Statistics for spatial data. 1991. New York: John Wiley and Sons,Inc. |
| [9] | H.C. Lu. The statistical characters of PM10 concentration in Taiwan area. Atmospheric Environment, 2002, 36, p. 491 – 502. |
| [10] | S.P. Kaluzny, S.C. Vega, T.P. Cardoso and A.A. Shelly. S+ Spatial Statistics: Users Manual For Windows And Unix. 1997. New York: Springer-Verlag. |
 Abstract
 Reference
 Full-Text PDF
 Full-text HTML