Netra Prakash Bhandary1, Ryuichi Yatabe1, Koji Yamamoto2, Youb Raj Paudyal3
1Graduate School of Science and Engineering, Ehime University, Japan
2Geo-Research Institute, Japan
3Department of Education, Government of Nepal
Correspondence to: Netra Prakash Bhandary, Graduate School of Science and Engineering, Ehime University, Japan.
| Email: |  |
Copyright © 2014 Scientific & Academic Publishing. All Rights Reserved.
Abstract
Building a reliable geo-info database and using it in various civil engineering projects as well as geo-disaster risk reduction study largely depends on the accuracy of available borehole information as well as borehole distribution density. In a developing country like Nepal, the available borehole information even in the most developed urban areas is highly sparse, which does not really help achieve the purpose of generating a geo-info database out of the available borehole information. Kathmandu Valley, the capital city area of Nepal accommodates about 3 million people in densely populated urban settlements of many poorly built and over-aged houses and buildings. It consists of thick lake deposits measuring more than 500 meters at some locations. This particular study is aimed at building a geo-info database system out of sparsely distributed borehole information, using the geo-info database in reliability check of ambient ground vibration survey results, and preparing a ground shaking map for earthquake disaster risk reduction in the Kathmandu Valley. The sparsely distributed borehole locations and different purposes of boring obviously lead to a less reliable geo-info database system. So, an extensive ambient ground vibration survey, which consists of a total of 176 survey points in about 1-km grid spacing, was conducted in Kathmandu Valley to predict the ground behavior in case of seismic shaking. The results of the geo-info database system and the ambient ground vibration survey were compared for reliability check of the latter. Finally, a ground shaking map was proposed for earthquake disaster risk mitigation in the Kathmandu Valley. The main understandings are: 1) specific use of the geo-info database system built out of the available borehole information may still be in question, but a broader implication, especially in terms of predicting the nature of soil deposit in the Kathmandu Valley can be adequately made; 2) the ground structure can be broadly predicted out of the ambient ground vibration data analysis, which in case of the Kathmandu Valley has been well confirmed by comparing the previously reported ground profiles and the results of the ambient ground vibration survey; and 3) the densely populated urban areas in the Kathmandu Valley are mostly situated over the soft and thick deposits with longer period of shaking, so longer period (i.e., 1.0-2.0 s.) structures here are prone to seismic damage.
Keywords:
Ambient ground vibration, Geo-info database, Ground shaking map, Kathmandu valley
Cite this paper: Netra Prakash Bhandary, Ryuichi Yatabe, Koji Yamamoto, Youb Raj Paudyal, Use of a Sparse Geo-Info Database and Ambient Ground Vibration Survey in Earthquake Disaster Risk Study − A Case of Kathmandu Valley −, Journal of Civil Engineering Research, Vol. 4 No. 3A, 2014, pp. 20-30. doi: 10.5923/c.jce.201402.03.
1. Introduction
Building and maintaining geo-info databases out of existing borehole information, particularly in medium- to large-scale urban areas in Japan gained significant momentum in the past one decade. There are basically two main purposes for building such a database. The first is reusing available borehole information for any further geotechnical projects, while the second is making an optimum use of ground information and material properties in geo-disaster risk mitigation efforts, such as understanding earthquake damage risk. In a developed nation like Japan, most big cities in most occasions have a dense distribution of borehole locations, but when it comes to developing or underdeveloped nations, obtaining borehole information may not be easy. As such, building of geo-info database system in Japan started in 1970s, but it was only in 2006, the Japanese Geotechnical Society formed a group of experts from academia, government agencies, and private firms for the purpose of gathering borehole information in major urban areas, such as Tokyo, Osaka, Kobe, etc. to build a geo-info database system for each big urban area in Japan leading to developing a digital subsurface model of the major urban areas in Japan, which is now on the web for public use. As of October 2014, this digital subsurface model map created in 250-m mesh size includes 31 medium- to large-scale urban areas of Japan.Unlike Japan, however, the status of borehole information availability in most developing nations in Asia is still poor. There may be two reasons for this: poorly maintained borehole exploration documentation and sparse or extremely low-density distribution of existing borehole information. For example, the Kathmandu Valley in Nepal (Fig. 1), which lies in one of the most earthquake disaster prone areas on the Himalayan thrusts, greatly lacks a well explored ground information system and enough number of existing boreholes that could help build a reliable geo-info database system and study the earthquake disaster risk level in the valley. There is a big number of urban areas in Asia as well as in the world that have a similar situation as that of Kathmandu when we talk about exiting borehole information and geo-disaster risk mitigation efforts. Most ground exploration techniques involve a massive amount of cost, which has led to little geophysical exploration study in Kathmandu-like urban areas. So, because of the cost involvement, neither it is feasible to go for increased number of planned borehole explorations, nor is it possible to adopt heavily expensive geophysical exploration techniques in a country like Nepal. Making use of existing borehole information is one solution, but the reliability involved in the maintained data and extremely sparse distribution of the available borehole information make it difficult to use a geo-info database system in earthquake disaster risk study.Situated over the subduction zone of Indian plate underneath the Eurasian continent, Nepal awaits a big earthquake in the next 10-20 years. Earthquake history in the region indicates that a big earthquake, equal to or greater than M8.0 takes place every 80-100 years, and from the latest big earthquake of 1934 measuring M8.0, it is soon going to be 80 years. Moreover, the locations of epicenters of the earthquakes in the past 300-400 years indicate that the area from west to mid Nepal lies in a zone of seismic gap [1], which has increased the risk of next big earthquake in this zone. While the predicted earthquake disaster risk in the valley is one of the highest in the world, the risk mitigation efforts have mostly focused at non-geological and non-geotechnical issues. One of the most prominent issues to be addressed when talking of earthquake disaster risk mitigation in the Kathmandu Valley is soft-layer deposit and its role in water-bowl effect during an earthquake. Similar studies have been conducted in various parts of the world, and most researchers have identified the Kathmandu Valley to be somewhat similar to Mexico City that suffered a tremendous loss during the 1985, M8.0 earthquake. Based on the earthquake occurrence frequency in Nepal and the Himalayan Region and the damage caused by 1934 Earthquake, it has been predicted that the capital area of Kathmandu Valley (Fig. 1) will sustain severe damage in case of a big earthquake, mainly because of its ground structure, which is made of soft lake deposits. The 2002 JICA study on earthquake disaster risk in Kathmandu Valley estimates that more than 40,000 people will be killed, tens of thousands of people will be injured, and more than 200,000 houses and buildings will be damaged [2]. Moreover, lifelines including roads, bridges, electricity, water supply, and communication will remain dysfunctional for several days.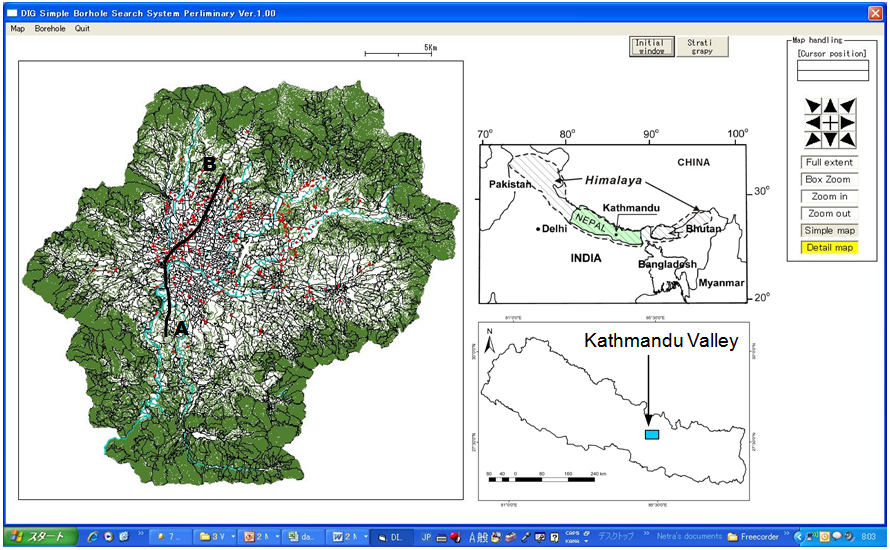 | Figure 1. The windows look of the geo-info database system and Kathmandu |
In this study, we first build a simple geo-info database system for the Kathmandu Valley out of the existing borehole information. Next, we try a comparatively cheaper method based on ground frequency measurement, commonly known as microtremor observation technique [3] to interpret the ground structure in terms of soft and hard deposits or shallow and deep deposits in the valley. Then, the ground structure interpretation is used in predicting the earthquake disaster risk level in terms of predominant period-based ground shaking map. The interpretation is also used in estimating the basement topography of the valley. Finally, to crosscheck and validate the frequency measurement-based method of ground structure prediction, we compare the ground profiles interpreted from this method with the ground profiles obtained from the geo-info database.
2. Material and Method
2.1. Geo-Info Database Preparation
Kathmandu Valley measures about 25 km east-west and about 20 km north-south. There have been various attempts of borehole exploration in the valley for different purposes, and the collected borehole data consist of borehole logs of about 500 locations. However, due to lack of enough information, particularly in relation with the ground strata and geotechnical data, only the data from about 300 boreholes were used in preparing preliminary geo-info database for the Kathmandu Valley (Fig. 1). The information entered into the database system mainly includes: 1) soil types in six categories consisting of sandy, silty, clayey, organic clay, gravel-rich, and bedrock, 2) groundwater level, and 3) SPT N-value. A typical ground profile extracted from the database system is shown in Fig. 2.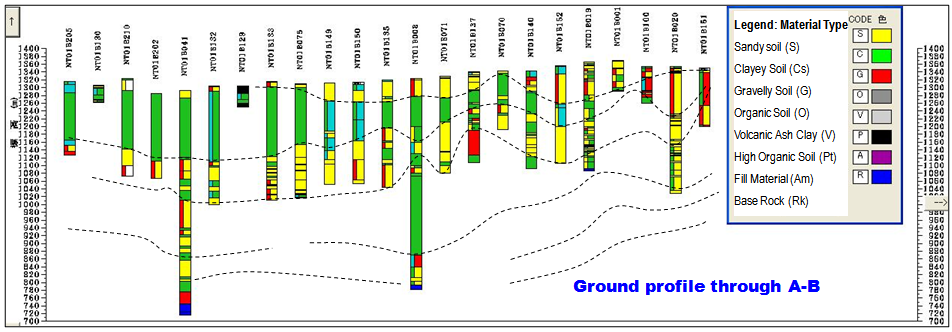 | Figure 2. Ground profile through line A-B (Fig.1) |
2.2. Ambient Ground Vibration Survey
Ambient ground vibration survey (also often referred to as microtremor survey) was conducted in the valley core in an area covering 18km east-west and 11km north-south with a grid spacing of one kilometer (Fig. 3) using a portable microtremor measurement device (NewPIC: by System and Data Research (SDR) Co. Ltd., Japan). Sampling frequency was set at 100 Hz. At each survey point, the data were recorded for 300 seconds (i.e. 30,000 samples at a sampling rate of 100 Hz), and velocity time histories of three components of all recorded data were drawn. Each component of signal was corrected by the base line and divided into 15 windows; each window consisting of 2048 samples (i.e., 20.48 s). For each point, 8-12 windows were picked up for analysis, omitting the windows that are influenced by nearby noise sources. Fourier analysis of the each window was carried out using Fast Fourier Transform (FFT) computer program, and the obtained spectra were smoothed using Parzen window of bandwidth 0.5 Hz. The average spectral ratio of horizontal-to-vertical components was obtained from Eq. (1) [4].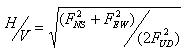 | (1) |
Where, FNS, FEW and FUD are the Fourier amplitude spectra in the north-south (NS), east-west (EW) and up-down (UD) directions, respectively.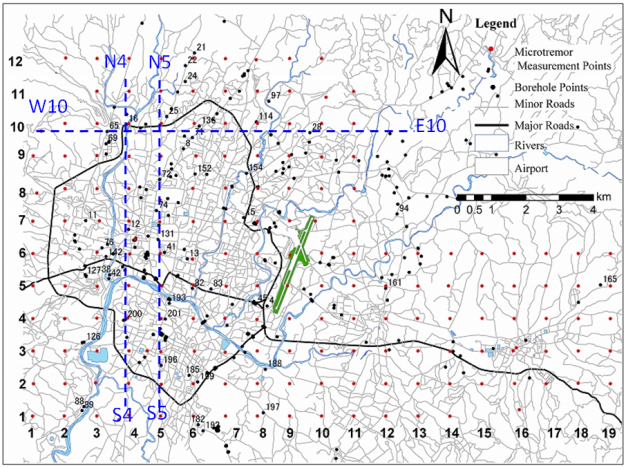 | Figure 3. Distribution of borehole points and ambient ground vibration (microtremor) survey points |
The ambient ground vibration or microtremor analysis has been widely applied in the last two decades for different purposes, such as site effects evaluation, wave amplification estimation, liquefaction vulnerability assessment, sediment depth estimation and microzonation studies in different geographical and geological regions of the world. In this study, the fundamental resonant frequency of the soil layer is used to estimate thickness of the soft sediments in the Kathmandu Basin. At the same time, the predominant period values obtained for each survey points were used to prepare a GIS-based ground shaking map for the study area.
3. Results and Discussion
3.1. Ambient Vibration Survey Results
The results of the ambient ground vibration survey are expressed in terms of predominant frequency of each ground point, as typically shown in Fig. 4. This figure shows the H/V spectral ratio versus predominant frequency for four typical points in the study area. Variations in the shape of H/V curves can be noticed in this figure. These curves are representative to a particular site condition and they describe the overall seismic site response at that location. Based on the observed peaks in the H/V curves, the predominant period (i.e., inverse of the predominant frequency) is obtained, as shown for each South-North and West-East straight line in Fig. 5. These analysis results indicate that the predominant period in the surveyed area is found to vary from 0.11 sec to 2.05 sec. As in Fig.5, the predominant period is maximum approximately in the middle of the South-North lines, while it is maximum towards west for the West-East lines.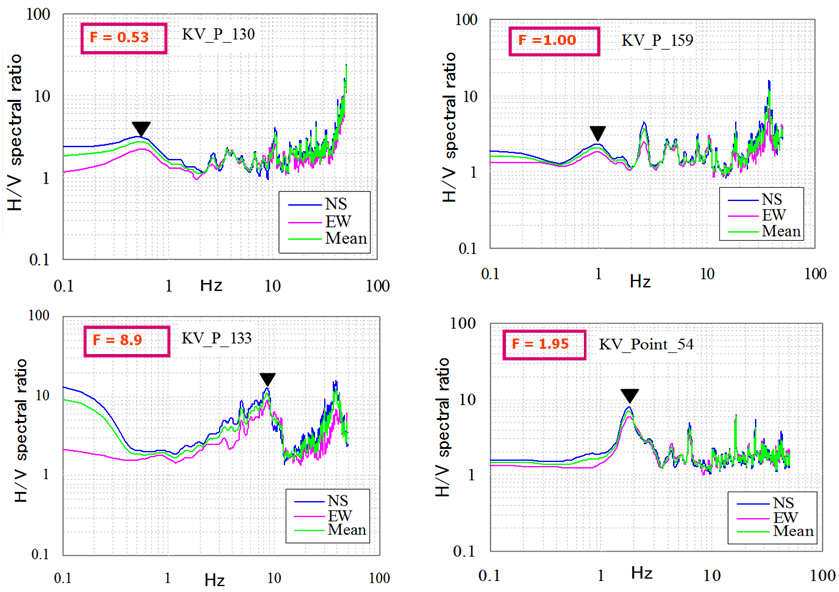 | Figure 4. Estimation of predominant frequency from the H/V spectra at four typical locations |
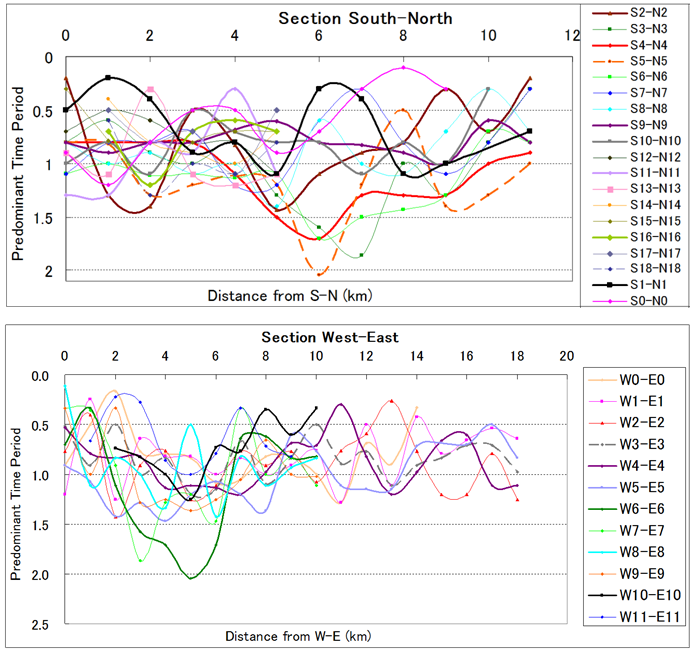 | Figure 5. Predominant period profiles of survey points in South-North and West-East straight lines |
3.2. Ground Profiles Interpreted from Borehole Logs and Ambient Vibration Analysis
The ambient ground vibration survey results were interpreted in terms of predominant periods of the ground points. Based on the predominant periods, ground profiles through various lines were plotted and compared with the borehole log-based ground profiles. Fig. 6 shows typical profiles of the ground through line S5-N5 and W10-E10 (as in Fig. 3). This comparison indicates that there is some degree of reliability. This interpretation is based on the fact that the softer ground, i.e., the soil layers made of deeper clayey, silty materials has a longer natural period, while harder ground, particularly the bedrock mass at shallower depth has a shorter natural period.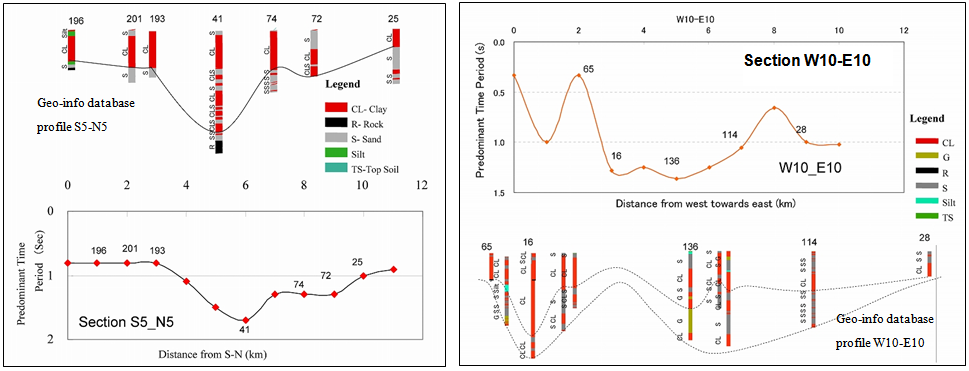 | Figure 6. Comparison of ground profiles interpreted from geo-info database and predominant period (S5-N5) |
3.3. Predominant Period and Ground Shaking Map
Using GIS environment (ArcGIS9.0), the predominant period information, as estimated in Fig. 5, was attributed to each survey point, and then applying the method of krigging, a predominant period distribution map was prepared, as shown in Fig. 7. The whole area was divided into five zones of predominant period, as indicated in the figure, using natural breaks technique. The predominant period distribution map indicates that the core area has a predominant period of around 2.0 s, while it decreases to below 1.0 s towards the outskirts.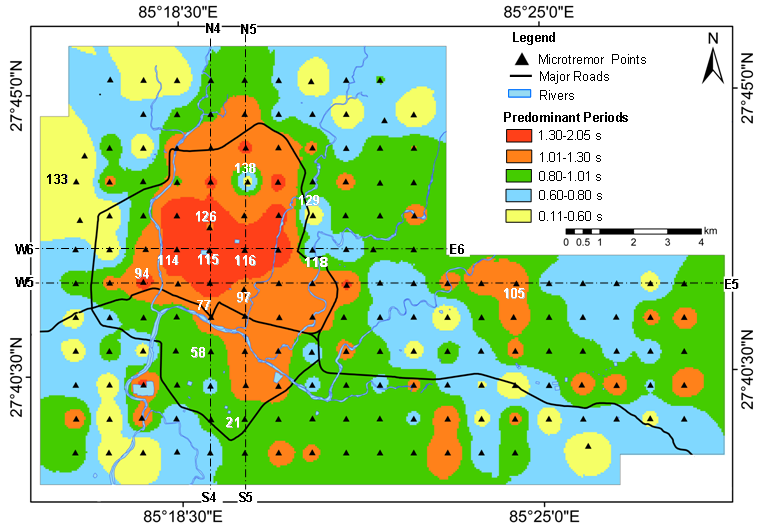 | Figure 7. Predominant period-based ground shaking map obtained from ambient ground vibration survey |
3.4. Sediment Depth and Predominant Frequency
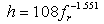
According to Ibs-von Seht and Wohlenberg [5], the fundamental resonant frequency (fr) of a soil layer is closely related with its thickness (h) as: | (2) |
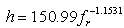
where, a and b are standard errors of the correlation coefficients. They demonstrated that it was possible to establish a direct functional relationship between h and fr even without the information of shear wave velocity (Vs). They also estimated a and b values, and proposed an empirical relationship (as in Eq. 3) between h and fr based on the information of 34 boreholes of depth from 15 m to 1,257 m and 102 seismic stations data in western Lower Rhine Embayment in Germany. Likewise, Parolai et al. [6] have developed another empirical relationship (Eq. 4) between h and fr for Cologne area in Germany based on the information of 32 boreholes of depth range from 20 m to 402 m and 337 seismic station data. More recently, Birgöen et al. [7] have derived another empirical relationship (Eq. 5) between h and fr for Istanbul region (Turkey) based on the H/V ratios from 15 measurements at the borehole locations and velocity profile of two microtremor array measurement sites. They have shown a very strong relationship (R2 value: 0.995) between the resonant frequency and the thickness of the sediment which varies from 20 m to 449 m. Özalaybey et al. [8] have also derived an equation (as in Eq. 6) for the sediment cover in Izmit Basin in Turkey which has as thick as 1200 m of sedimentary cover at the deepest point. | (3) |
 | (4) |
 | (5) |
 | (6) |
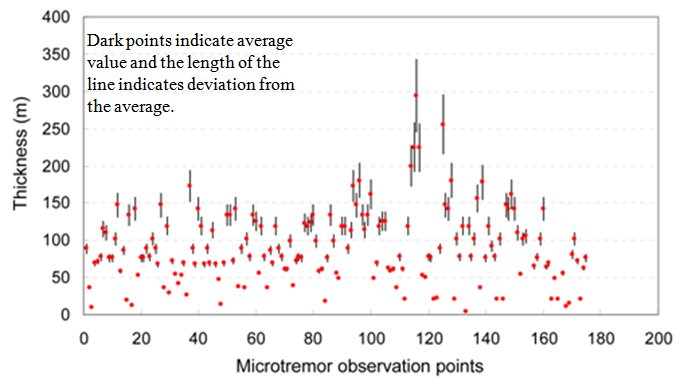
To estimate the soft sediment thickness in the Kathmandu Valley, we adopt terrain specific equations given by above researchers. Using the above equations, theoretical thickness values of the sediments are first calculated considering the fundamental frequency (fr) obtained from the ambient vibration or microtremor analysis at each measurement station. As shown in Fig. 8, the estimated depths, based on the above four equations, exhibit remarkable variation with an average standard deviation of 41.88 m.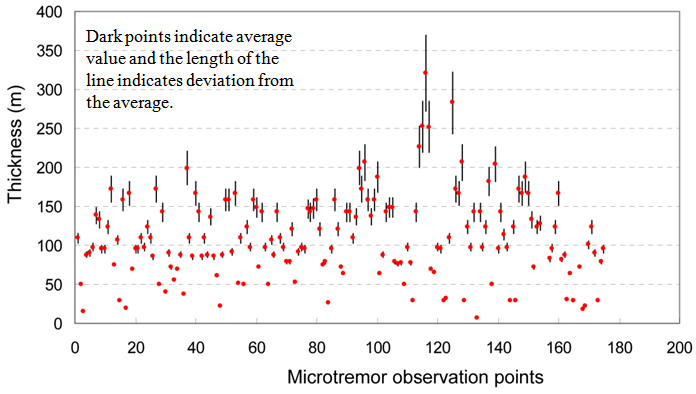 | Figure 8. Comparison between depths calculated by using Eq. 3 [5], Eq. 4 [6], Eq. 5 [7], and Eq. 6 [8] |
In order to minimize the value of standard deviation and to obtain more reliable results, the depths estimated by the above equations are divided into two groups, emphasizing less variation of estimated depths in each group. In first group, the depth of the Kathmandu Basin sediments is estimated using Eq. 3 [5] and Eq. 4 [6], since these equations show more comparable results with each other. In second group, the depth is estimated using Eq. 5 [7] and Eq. 6 [8]. The standard deviation of each group is obtained as in Fig. 9 and Fig. 10, which show that the standard deviation of the first group (i.e., 48.55 m) is significantly higher than that of the second group (i.e., 7.44 m). It is also understood that thickness values obtained by Eq. 5 [7] and Eq. 6 [8] are more compatible with each other than the first two. In other words, sediment depths calculated by Birgöen et al. [7] and Özalaybey et al. [8] show negligible variation due to comparable geotechnical characteristics of the geological formations. Furthermore, we averaged the values obtained from Eq. 5 and Eq. 6 to obtain a best-fit equation for the Kathmandu Basin, which we have proposed as: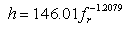 | (7) |
 | Figure 9. Comparison of depths calculated by Eq. 3 [5] and Eq. 4 [6] |
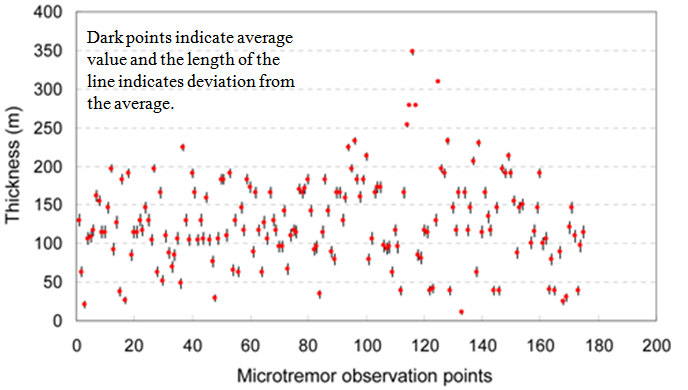 | Figure 10. Comparison of depths calculated by Eq. 5 [7] and Eq. 6 [8] |
This equation is used for obtaining primary information on relative variation in depth of the interface between two physically contrasting layers of lacustrine sediment and the underlain hard strata (or bedrock) in the Kathmandu Basin, which is validated by comparing with the results of the gravity contour map proposed by Moribayashi and Mauro [9] and also with the depth of the bedrock based on the borehole drilled for academic purposes in the Kathmandu Basin.
3.5. Basement Topography
A bedrock contour map and a 3D view of basement topography of the Kathmandu Basin prepared out of the estimated soft sediment thickness are respectively shown in Fig. 11 and Fig. 12. As seen in the figures, the basin center consists of a deep interface of soft sediment (unconsolidated) and basement, while the basin outskirts consist of shallower interfaces. In Fig. 11, abrupt changes in the thickness can be seen at point A (sediment thickness about 48 m, about 2 km north of central part) and point B (sediment thickness about 30 m, about 3 km north of central part), which indicate that the basement rock is close to ground surface.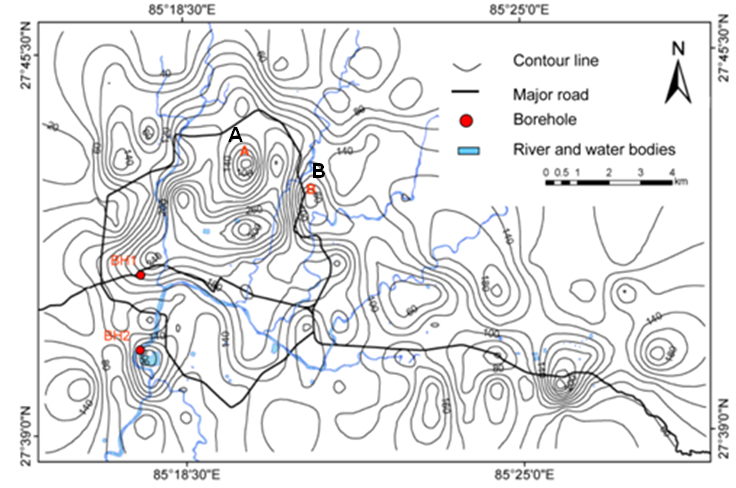 | Figure 11. Contour map of basement topography of the Kathmandu Basin |
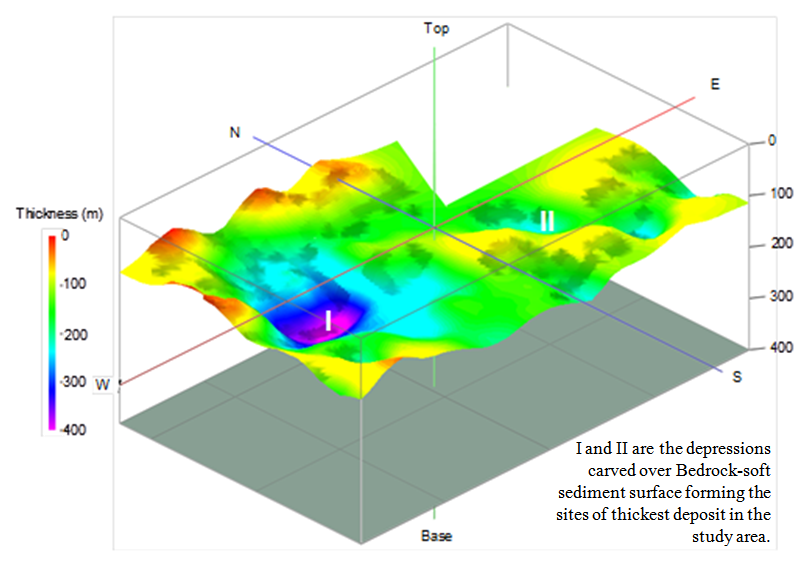 | Figure 12. Bedrock-soft sediment palaeo-topography of the Kathmandu Valley Basin (vertically exaggerated by 15 times) |
The sediment depth elevation model suggests that the sediment distribution in the basin is far from uniform and have an undulating topography with steep relief in many locations in the basin. A closer analysis of the 3D view of the basement topography (Fig. 12) reveals two possibilities: first, the calculated depth of the sediment directly represents the total depth of lake deposit over the basement rock; second, it may not necessarily indicate the depth of hard basement rock, it rather represents the depth of basement layer beyond which the sediment does/may not contribute to amplification of the ground motion. From geotechnical point of view, however, this contrast corresponds to presence of bedrock.
4. Crosscheck and Validation
At first, we compared the basement topography results with the estimation of Moribayashi and Maruo [9] using gravitational method. Although owing to space restrictions we have not included their results here, our basement prediction was found to be quite similar to theirs. In their work, they have found that the gravity in the central part of the valley, where the thickness of the lacustrine sediments is high is lower, but it gradually increases towards the marginal area where the sediment thickness is low. They have also estimated that the maximum sediment thickness is about 650 m at the central part, but in reality, the density of lacustrine sediments is lower [2] than the value assumed by Moribayashi and Maruo [9] while calculating the gravity values. In addition, the actual density distribution of the bedrock and the overlain sediment should be based on the sediment types and depths, bedrock type, and degree of sediment consolidation. According to JICA [2], the average density of the Kathmandu sediment layer up to 30 m depth is about 1.52 g/cm3 and it varies from 1.43 g/cm3 to 1.68 g/cm3 according to the sediment types and depth, which is quite lower than the value (i.e., 1.87 g/cm3) assumed by Moribayashi and Maruo [9]. This overestimated material density as well as assumption of the same value throughout the area might have resulted in greater depth of sediment in the Kathmandu basin.Then, in order to verify the estimated sediment thickness, the sediment depth profiles through the center of the basin extracted from Fig. 10 were compared with the schematic cross section of the sediment proposed by Sakai et al. [10] and based on borehole exploration (Note: owing to space restriction, the diagrammatical comparison has been skipped in this paper), which revealed that the depth profiles are in good agreement with the profile proposed by Sakai et al [10].Finally, the soft sediment depth estimated in this study was also compared with the borehole information-based ground profiles. Again for the space limitation, two typical comparative diagrams are shown in Fig. 11 and Fig. 12. Although, not very perfect, the comparison indicates that there is some degree of reliability in the ambient vibration analysis-based profile prediction.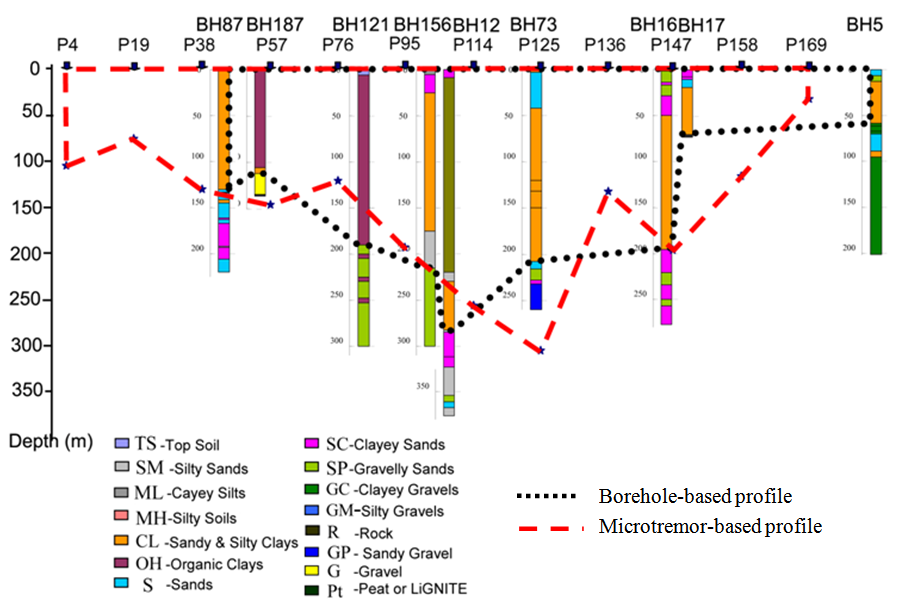 | Figure 13. Soft sediment depths based on geo-information database system and ambient ground vibration survey (Section S4-N4, Fig. 3) |
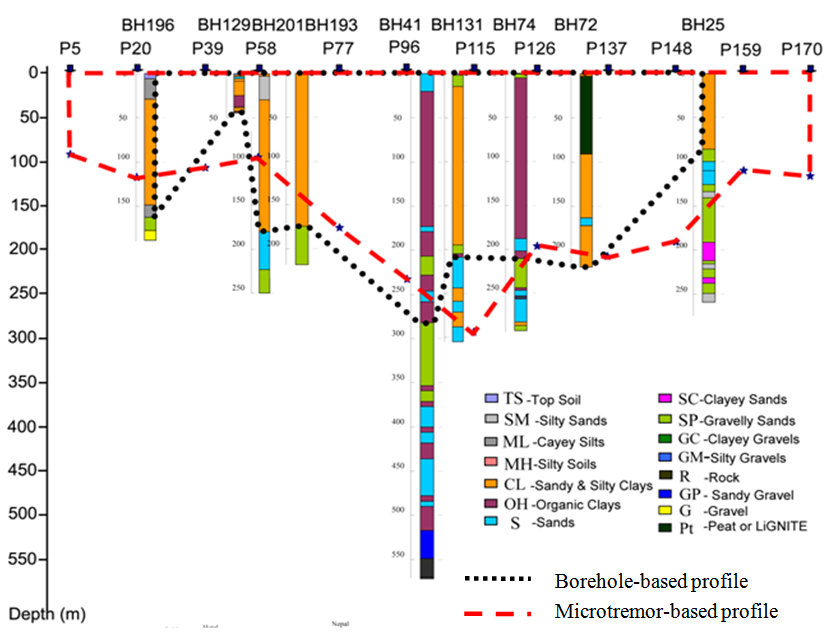 | Figure 14. Soft sediment depths based on geo-information database system and ambient ground vibration survey (Section S5-N5, Fig. 3) |
5. Concluding Remarks
The reliability of the ground profile in the Kathmandu Valley drawn out of the available borehole logs is heavily reduced by the sparse distribution of the borehole points. In an attempt to prepare geo-info database towards earthquake disaster reduction efforts, about 300 borehole logs were entered in a windows-based database system. Sparse distribution of boreholes makes it largely difficult to accurately predict the ground profile of the valley, mainly because the borehole explorations were made for different purposes, which have led to dissimilar evaluation of the ground stratification. However, the interpretations of the ground profile from microtremor or ambient ground vibration analyses results in terms of predominant period have to some extent confirmed that the ground profiles drawn out of the borehole information are acceptable. Nevertheless, predicting the details of the ground stratification was still difficult because the present evaluation has been limited to estimating the sediment mass above the bedrock mass regardless of the soil layer types. It is expected that further analysis of the microtremor survey results may yield the presence of sandy, silty, or clayey layers underneath the points of measurement.In this study, a predominant period-based shaking map for the Kathmandu Valley was also prepared out of the ambient ground vibration survey at 172 points. It was understood that in the urban cores and peripheral settlements of the valley, the predominant period varies from about 0.1 s to 2.0 s, and that it gradually decreases from a longer value in the central part to a shorter value in the outskirts. This trend is found to follow the distribution of sediment depth in the valley. This trend of predominant period distribution in the valley indicates that the possibilities of long-period ground vibration are higher in and around the valley center, which mostly consist of 5- to 7-story old masonry and reinforced concrete-framed buildings. Additionally, because of increasing population and development into a greater commercial hub, the central part has seen a sharp rise in the number of mid-height to tall buildings, which have been constructed under inadequate geotechnical investigations. In order to reduce the disaster risk, therefore, special considerations must be made in the seismic design of tall or long structures in the valley center. At the same time, it may also be necessary to consider enhanced seismic design criteria for medium- and short-period structures in the remaining part of the valley.
References
| [1] | Bilham, R., Larson, K., Freymueller, J. and Project Idylhim Members. GPS measurements of present-day convergence across the Nepal Himalaya. Nature (Lond). 1997, Vol. 386, pp. 61-64. |
| [2] | JICA. The Study on earthquake disaster mitigation in the Kathmandu Valley Kingdom of Nepal. Main Report. 2002 (Unpublished). |
| [3] | Nakamura, Y. A method for dynamic characteristics estimation of subsurface using microtremor on the ground surface. Quarterly Report of the Railway Technical Research Institute. 1989, 30 (1): 25-33. |
| [4] | Delgado, J., Casado, C. L., Lopez, Giner, J., Estevez, A., Cuenca, A., Molina, S. Microtremors as a geophysical exploration tool: applications and limitations. Pure and Applied Geophysics. 2000, 157: 1445-1462. |
| [5] | Ibs-von Seht, M., Wohlenberg, J. Microtremor measurements used to map thickness of soft sediments. Bulletin of the Seismological Society of America. 1999, 89: 250–259. |
| [6] | Parolai, S., Bormann, P., and Milkereit, C. New relationship between Vs thickness of sediments and resonance frequency calculated by the H/V ratio of seismic noise for the Cologne area (Germany). Bulletin of the Seismological Society of America. 2002, 92 (6): 2521-2527. |
| [7] | Birgören, G., Özel, O., Siyahi, B. Bedrock depth mapping of the coast south of Istanbul: comparison of analytical and experimental analyses. Turkish Journal of Earth Science. 2009, 18: 315–329. |
| [8] | Özalaybey, S., Zor, E., Ergintav, S. and Tapırdamaz, M. C. Investigation of 3-D basin structures in the İzmit Bay area (Turkey) by single-station microtremor and gravimetric methods. Geophysical Journal International. 1980, 186: 883–894. |
| [9] | Moribayashi, S. and Maruo, Y. Basement topography of the Kathmandu Valley Nepal-An application of the gravitational method to the survey of a tectonic basin in the Himalaya. Journal of Japan Society of Engineering Geology. 1980, 21: 30-37. |
| [10] | Sakai, H., Fujii, R., Kuwahara, Y., Upreti, B. N. and Shrestha, S. D. Core drilling of the basin-fill sediments in the Kathmandu Valley for paleoclimatic study: preliminary results. Journal of Nepal Geological Society. 2001, 25 (Special Issue): 9-18. |
 Abstract
 Reference
 Full-Text PDF
 Full-text HTML